
|
|||||
|
 | |
| |
| |
| |
| |
| |
|
Gene: PCGF6 |
Gene summary for PCGF6 |
| Gene information | Species | Human | Gene symbol | PCGF6 | Gene ID | 84108 |
| Gene name | polycomb group ring finger 6 | |
| Gene Alias | MBLR | |
| Cytomap | 10q24.33 | |
| Gene Type | protein-coding | GO ID | GO:0000122 | UniProtAcc | Q9BYE7 |
Top |
Malignant transformation analysis |
| Identification of the aberrant gene expression in precancerous and cancerous lesions by comparing the gene expression of stem-like cells in diseased tissues with normal stem cells |
| Entrez ID | Symbol | Replicates | Species | Organ | Tissue | Adj P-value | Log2FC | Malignancy |
| 84108 | PCGF6 | LZE4T | Human | Esophagus | ESCC | 1.20e-07 | 2.39e-01 | 0.0811 |
| 84108 | PCGF6 | LZE7T | Human | Esophagus | ESCC | 2.59e-05 | 2.52e-01 | 0.0667 |
| 84108 | PCGF6 | LZE24T | Human | Esophagus | ESCC | 1.09e-14 | 2.85e-01 | 0.0596 |
| 84108 | PCGF6 | P1T-E | Human | Esophagus | ESCC | 3.49e-06 | 2.45e-01 | 0.0875 |
| 84108 | PCGF6 | P2T-E | Human | Esophagus | ESCC | 1.13e-21 | 4.23e-01 | 0.1177 |
| 84108 | PCGF6 | P4T-E | Human | Esophagus | ESCC | 1.39e-21 | 4.27e-01 | 0.1323 |
| 84108 | PCGF6 | P5T-E | Human | Esophagus | ESCC | 9.78e-24 | 5.08e-01 | 0.1327 |
| 84108 | PCGF6 | P8T-E | Human | Esophagus | ESCC | 1.88e-12 | 1.56e-01 | 0.0889 |
| 84108 | PCGF6 | P9T-E | Human | Esophagus | ESCC | 9.12e-03 | 7.59e-02 | 0.1131 |
| 84108 | PCGF6 | P10T-E | Human | Esophagus | ESCC | 5.40e-04 | 6.57e-02 | 0.116 |
| 84108 | PCGF6 | P11T-E | Human | Esophagus | ESCC | 4.26e-12 | 3.83e-01 | 0.1426 |
| 84108 | PCGF6 | P12T-E | Human | Esophagus | ESCC | 3.82e-27 | 4.28e-01 | 0.1122 |
| 84108 | PCGF6 | P15T-E | Human | Esophagus | ESCC | 1.73e-07 | 1.65e-01 | 0.1149 |
| 84108 | PCGF6 | P16T-E | Human | Esophagus | ESCC | 1.18e-13 | 2.47e-01 | 0.1153 |
| 84108 | PCGF6 | P19T-E | Human | Esophagus | ESCC | 6.87e-07 | 4.86e-01 | 0.1662 |
| 84108 | PCGF6 | P20T-E | Human | Esophagus | ESCC | 6.06e-11 | 2.87e-01 | 0.1124 |
| 84108 | PCGF6 | P21T-E | Human | Esophagus | ESCC | 2.24e-10 | 2.24e-01 | 0.1617 |
| 84108 | PCGF6 | P22T-E | Human | Esophagus | ESCC | 1.59e-13 | 2.70e-01 | 0.1236 |
| 84108 | PCGF6 | P23T-E | Human | Esophagus | ESCC | 2.91e-24 | 4.94e-01 | 0.108 |
| 84108 | PCGF6 | P24T-E | Human | Esophagus | ESCC | 7.75e-06 | 1.44e-01 | 0.1287 |
| Page: 1 2 3 4 |
| Tissue | Expression Dynamics | Abbreviation |
| Esophagus |  | ESCC: Esophageal squamous cell carcinoma |
| HGIN: High-grade intraepithelial neoplasias | ||
| LGIN: Low-grade intraepithelial neoplasias | ||
| Oral Cavity | 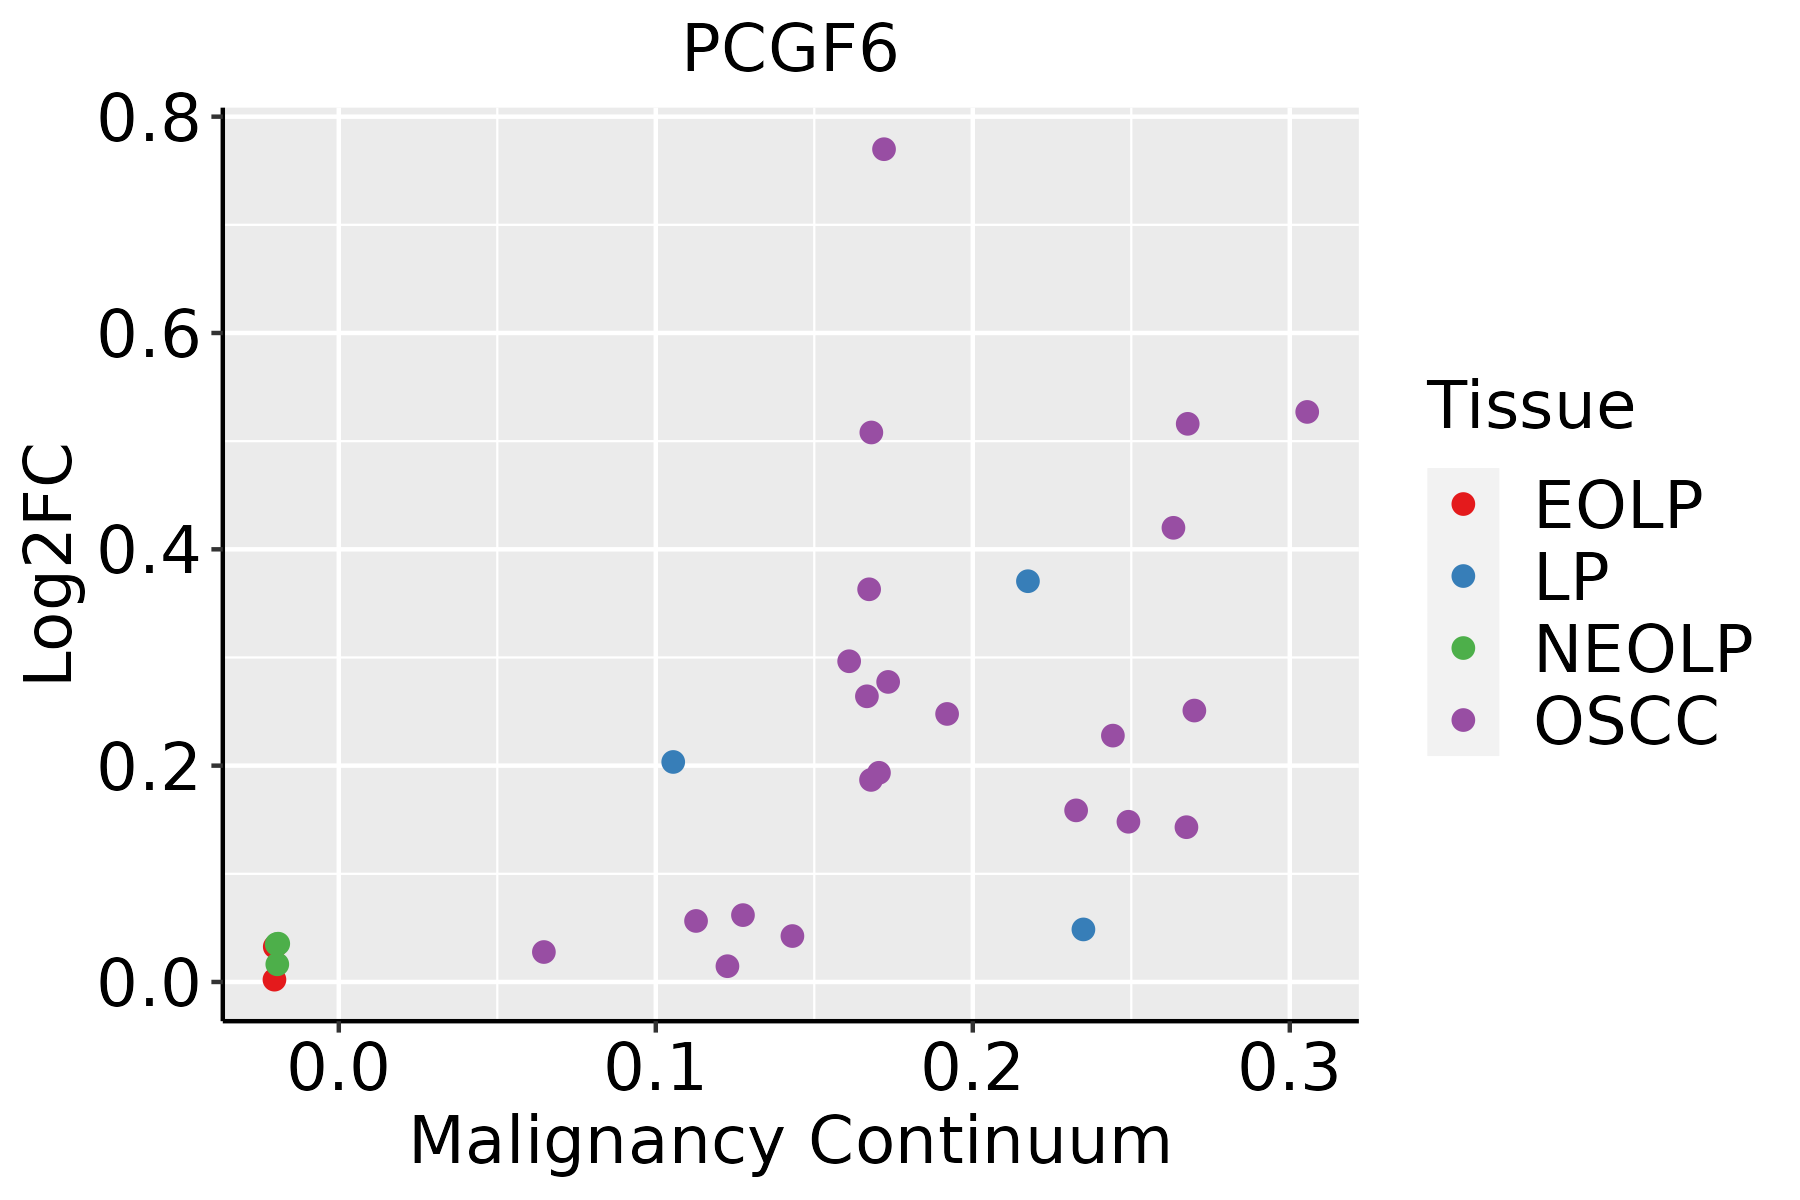 | EOLP: Erosive Oral lichen planus |
| LP: leukoplakia | ||
| NEOLP: Non-erosive oral lichen planus | ||
| OSCC: Oral squamous cell carcinoma |
| ∗log2FC in expression of this searched gene in stem-like cells from each diseased tissue sample relative to stem-like cells in normal samples in each tissue plotted against the malignancy continuum. Samples are colored based on if they are from different disease stage. |
Top |
Malignant transformation related pathway analysis |
| Find out the enriched GO biological processes and KEGG pathways involved in transition from healthy to precancer to cancer |
| Tissue | Disease Stage | Enriched GO biological Processes |
| Colorectum | AD |  |
| Colorectum | SER |  |
| Colorectum | MSS |  |
| Colorectum | MSI-H |  |
| Colorectum | FAP |  |
| ∗Top 15 enriched GO BP terms are showed in the bar plot of each disease state in each tissue. Each row represents a significant GO biological process which is colored according to the -log10(p.adjust). |
| Page: 1 2 3 4 5 6 7 8 9 |
| GO ID | Tissue | Disease Stage | Description | Gene Ratio | Bg Ratio | pvalue | p.adjust | Count |
| GO:001657015 | Esophagus | ESCC | histone modification | 323/8552 | 463/18723 | 2.61e-26 | 7.88e-24 | 323 |
| GO:00065136 | Esophagus | ESCC | protein monoubiquitination | 53/8552 | 67/18723 | 2.11e-08 | 4.03e-07 | 53 |
| GO:001657414 | Esophagus | ESCC | histone ubiquitination | 40/8552 | 47/18723 | 2.40e-08 | 4.55e-07 | 40 |
| GO:003352213 | Esophagus | ESCC | histone H2A ubiquitination | 23/8552 | 26/18723 | 6.82e-06 | 6.90e-05 | 23 |
| GO:00103904 | Esophagus | ESCC | histone monoubiquitination | 25/8552 | 29/18723 | 7.24e-06 | 7.20e-05 | 25 |
| GO:00355182 | Esophagus | ESCC | histone H2A monoubiquitination | 15/8552 | 17/18723 | 3.48e-04 | 2.03e-03 | 15 |
| GO:00165707 | Oral cavity | OSCC | histone modification | 270/7305 | 463/18723 | 1.59e-17 | 1.50e-15 | 270 |
| GO:00165746 | Oral cavity | OSCC | histone ubiquitination | 38/7305 | 47/18723 | 5.22e-09 | 1.14e-07 | 38 |
| GO:00065135 | Oral cavity | OSCC | protein monoubiquitination | 47/7305 | 67/18723 | 2.32e-07 | 3.68e-06 | 47 |
| GO:00103903 | Oral cavity | OSCC | histone monoubiquitination | 24/7305 | 29/18723 | 1.74e-06 | 2.26e-05 | 24 |
| GO:00335224 | Oral cavity | OSCC | histone H2A ubiquitination | 21/7305 | 26/18723 | 1.66e-05 | 1.64e-04 | 21 |
| GO:00355181 | Oral cavity | OSCC | histone H2A monoubiquitination | 13/7305 | 17/18723 | 1.92e-03 | 8.94e-03 | 13 |
| Page: 1 |
| Pathway ID | Tissue | Disease Stage | Description | Gene Ratio | Bg Ratio | pvalue | p.adjust | qvalue | Count |
| Page: 1 |
Top |
Cell-cell communication analysis |
| Identification of potential cell-cell interactions between two cell types and their ligand-receptor pairs for different disease states |
| Ligand | Receptor | LRpair | Pathway | Tissue | Disease Stage |
| Page: 1 |
Top |
Single-cell gene regulatory network inference analysis |
| Find out the significant the regulons (TFs) and the target genes of each regulon across cell types for different disease states |
| TF | Cell Type | Tissue | Disease Stage | Target Gene | RSS | Regulon Activity |
| ∗The dot plots of a searched regulon are shown for all cell subpopulations in each disease state of each tissue based on the regulon specific score inferred using pySCENIC and by calculating the average expression. |
| Page: 1 |
Top |
Somatic mutation of malignant transformation related genes |
| Annotation of somatic variants for genes involved in malignant transformation |
| Hugo Symbol | Variant Class | Variant Classification | dbSNP RS | HGVSc | HGVSp | HGVSp Short | SWISSPROT | BIOTYPE | SIFT | PolyPhen | Tumor Sample Barcode | Tissue | Histology | Sex | Age | Stage | Therapy Types | Drugs | Outcome |
| PCGF6 | SNV | Missense_Mutation | novel | c.164G>A | p.Gly55Asp | p.G55D | Q9BYE7 | protein_coding | deleterious_low_confidence(0) | benign(0.103) | TCGA-A7-A6VX-01 | Breast | breast invasive carcinoma | Female | >=65 | I/II | Chemotherapy | docetaxel | CR |
| PCGF6 | SNV | Missense_Mutation | novel | c.170N>T | p.Ser57Phe | p.S57F | Q9BYE7 | protein_coding | deleterious_low_confidence(0) | probably_damaging(0.979) | TCGA-D8-A73U-01 | Breast | breast invasive carcinoma | Female | >=65 | I/II | Hormone Therapy | tamoxiphen | SD |
| PCGF6 | SNV | Missense_Mutation | c.967C>G | p.Arg323Gly | p.R323G | Q9BYE7 | protein_coding | deleterious(0.01) | benign(0.146) | TCGA-EW-A1OY-01 | Breast | breast invasive carcinoma | Female | <65 | I/II | Chemotherapy | doxorubicin | SD | |
| PCGF6 | SNV | Missense_Mutation | novel | c.396N>G | p.Ile132Met | p.I132M | Q9BYE7 | protein_coding | deleterious(0) | probably_damaging(0.995) | TCGA-PE-A5DE-01 | Breast | breast invasive carcinoma | Female | <65 | I/II | Chemotherapy | taxotere | CR |
| PCGF6 | SNV | Missense_Mutation | novel | c.508N>G | p.Pro170Ala | p.P170A | Q9BYE7 | protein_coding | deleterious(0) | probably_damaging(0.998) | TCGA-C5-A1MH-01 | Cervix | cervical & endocervical cancer | Female | >=65 | III/IV | Chemotherapy | cisplatin | PD |
| PCGF6 | SNV | Missense_Mutation | c.574N>G | p.Gln192Glu | p.Q192E | Q9BYE7 | protein_coding | deleterious(0.01) | probably_damaging(0.931) | TCGA-IR-A3LL-01 | Cervix | cervical & endocervical cancer | Female | <65 | I/II | Chemotherapy | cisplatin | CR | |
| PCGF6 | SNV | Missense_Mutation | c.281N>C | p.Glu94Ala | p.E94A | Q9BYE7 | protein_coding | deleterious_low_confidence(0.01) | benign(0.027) | TCGA-AA-3821-01 | Colorectum | colon adenocarcinoma | Female | >=65 | I/II | Unknown | Unknown | SD | |
| PCGF6 | SNV | Missense_Mutation | c.940G>C | p.Glu314Gln | p.E314Q | Q9BYE7 | protein_coding | tolerated(0.15) | possibly_damaging(0.879) | TCGA-BM-6198-01 | Colorectum | rectum adenocarcinoma | Male | >=65 | III/IV | Chemotherapy | xeloda | SD | |
| PCGF6 | SNV | Missense_Mutation | novel | c.631C>T | p.His211Tyr | p.H211Y | Q9BYE7 | protein_coding | tolerated(0.1) | benign(0.01) | TCGA-AP-A056-01 | Endometrium | uterine corpus endometrioid carcinoma | Female | <65 | I/II | Unknown | Unknown | SD |
| PCGF6 | SNV | Missense_Mutation | rs199872878 | c.361N>T | p.Arg121Cys | p.R121C | Q9BYE7 | protein_coding | deleterious(0) | possibly_damaging(0.897) | TCGA-AP-A0LM-01 | Endometrium | uterine corpus endometrioid carcinoma | Female | <65 | III/IV | Chemotherapy | cisplatin | SD |
| Page: 1 2 3 |
Top |
Related drugs of malignant transformation related genes |
| Identification of chemicals and drugs interact with genes involved in malignant transfromation |
| (DGIdb 4.0) |
| Entrez ID | Symbol | Category | Interaction Types | Drug Claim Name | Drug Name | PMIDs |
| Page: 1 |

Copyright 2023-Present -The University of Texas Health Science Center at Houston |