
|
|||||
|
 | |
| |
| |
| |
| |
| |
|
Gene: PCGF2 |
Gene summary for PCGF2 |
| Gene information | Species | Human | Gene symbol | PCGF2 | Gene ID | 7703 |
| Gene name | polycomb group ring finger 2 | |
| Gene Alias | MEL-18 | |
| Cytomap | 17q12 | |
| Gene Type | protein-coding | GO ID | GO:0000122 | UniProtAcc | A0A024R1V6 |
Top |
Malignant transformation analysis |
| Identification of the aberrant gene expression in precancerous and cancerous lesions by comparing the gene expression of stem-like cells in diseased tissues with normal stem cells |
| Entrez ID | Symbol | Replicates | Species | Organ | Tissue | Adj P-value | Log2FC | Malignancy |
| 7703 | PCGF2 | GSM4909290 | Human | Breast | IDC | 3.64e-33 | 7.56e-01 | 0.2096 |
| 7703 | PCGF2 | GSM4909292 | Human | Breast | IDC | 2.42e-08 | 6.83e-01 | 0.1236 |
| 7703 | PCGF2 | GSM4909293 | Human | Breast | IDC | 1.40e-42 | 7.70e-01 | 0.1581 |
| 7703 | PCGF2 | GSM4909311 | Human | Breast | IDC | 5.25e-04 | 1.94e-03 | 0.1534 |
| 7703 | PCGF2 | GSM4909319 | Human | Breast | IDC | 5.37e-07 | 8.84e-03 | 0.1563 |
| 7703 | PCGF2 | DCIS2 | Human | Breast | DCIS | 8.24e-29 | 9.83e-02 | 0.0085 |
| 7703 | PCGF2 | P2T-E | Human | Esophagus | ESCC | 1.51e-22 | 3.98e-01 | 0.1177 |
| 7703 | PCGF2 | P4T-E | Human | Esophagus | ESCC | 1.24e-11 | 3.20e-01 | 0.1323 |
| 7703 | PCGF2 | P5T-E | Human | Esophagus | ESCC | 1.46e-06 | 1.60e-01 | 0.1327 |
| 7703 | PCGF2 | P8T-E | Human | Esophagus | ESCC | 4.01e-23 | 3.72e-01 | 0.0889 |
| 7703 | PCGF2 | P9T-E | Human | Esophagus | ESCC | 1.10e-04 | 1.05e-01 | 0.1131 |
| 7703 | PCGF2 | P10T-E | Human | Esophagus | ESCC | 1.68e-12 | 1.62e-01 | 0.116 |
| 7703 | PCGF2 | P11T-E | Human | Esophagus | ESCC | 4.66e-09 | 3.71e-01 | 0.1426 |
| 7703 | PCGF2 | P12T-E | Human | Esophagus | ESCC | 2.02e-43 | 7.26e-01 | 0.1122 |
| 7703 | PCGF2 | P15T-E | Human | Esophagus | ESCC | 4.53e-28 | 6.62e-01 | 0.1149 |
| 7703 | PCGF2 | P16T-E | Human | Esophagus | ESCC | 1.78e-25 | 4.69e-01 | 0.1153 |
| 7703 | PCGF2 | P20T-E | Human | Esophagus | ESCC | 5.79e-05 | 1.22e-01 | 0.1124 |
| 7703 | PCGF2 | P21T-E | Human | Esophagus | ESCC | 2.54e-13 | 2.01e-01 | 0.1617 |
| 7703 | PCGF2 | P22T-E | Human | Esophagus | ESCC | 1.61e-05 | 1.01e-01 | 0.1236 |
| 7703 | PCGF2 | P23T-E | Human | Esophagus | ESCC | 9.55e-08 | 2.93e-01 | 0.108 |
| Page: 1 2 3 4 5 |
| Tissue | Expression Dynamics | Abbreviation |
| Breast | 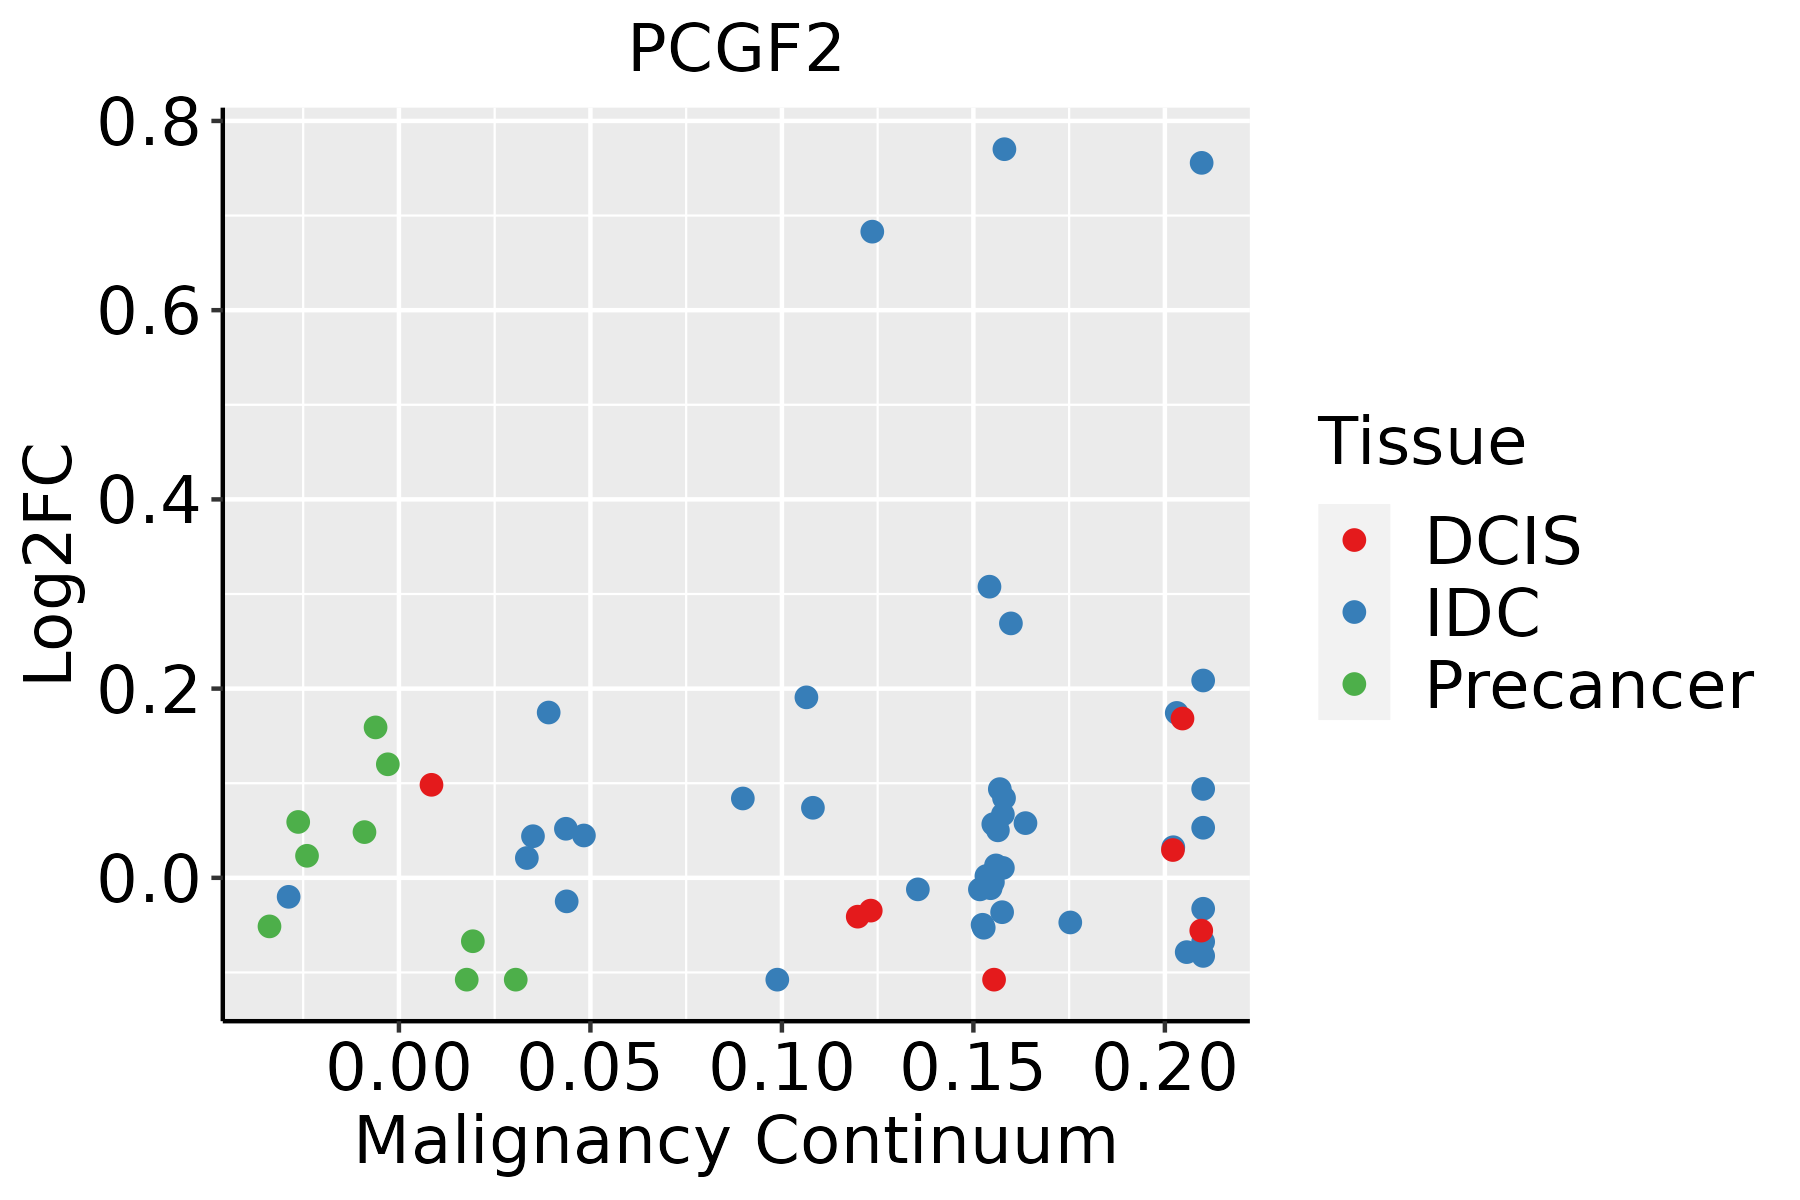 | IDC: Invasive ductal carcinoma |
| DCIS: Ductal carcinoma in situ | ||
| Precancer(BRCA1-mut): Precancerous lesion from BRCA1 mutation carriers | ||
| Esophagus | 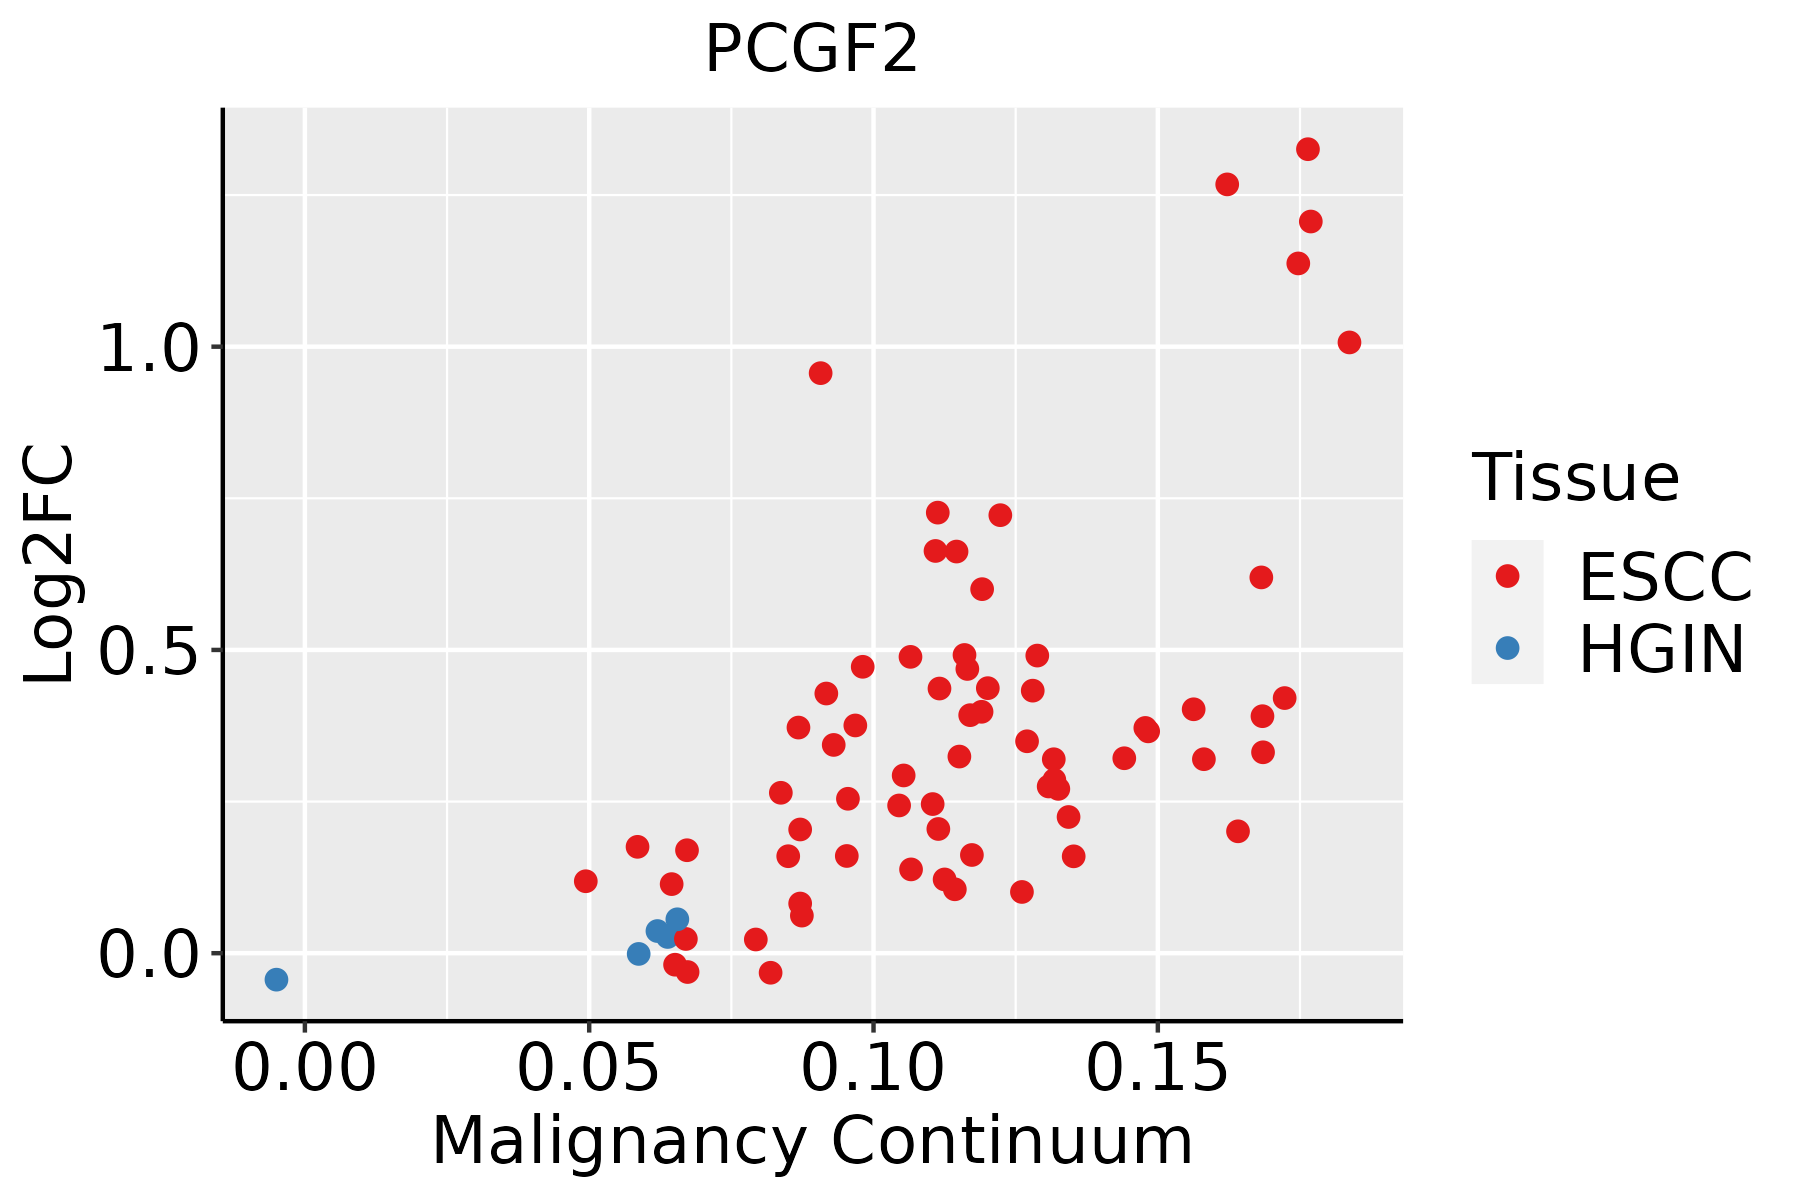 | ESCC: Esophageal squamous cell carcinoma |
| HGIN: High-grade intraepithelial neoplasias | ||
| LGIN: Low-grade intraepithelial neoplasias | ||
| Liver |  | HCC: Hepatocellular carcinoma |
| NAFLD: Non-alcoholic fatty liver disease | ||
| Oral Cavity | 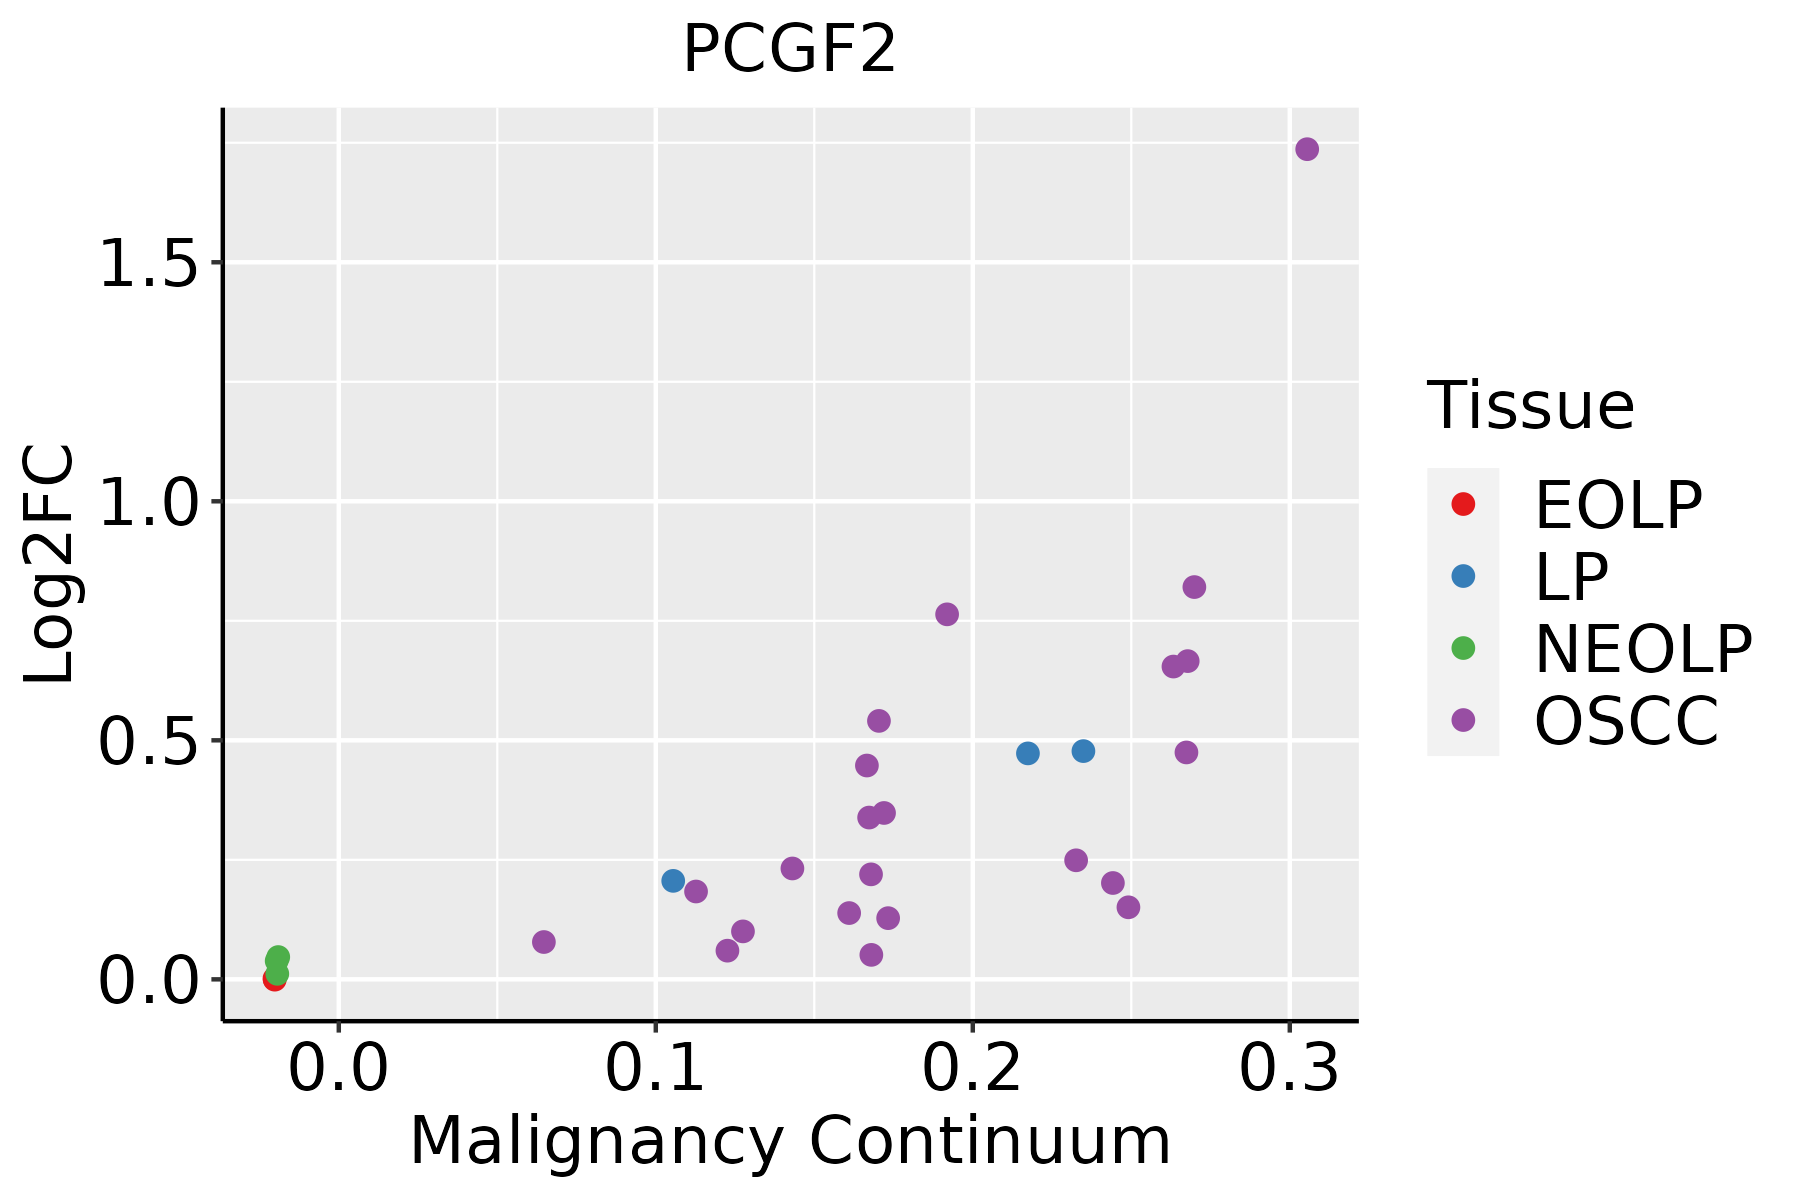 | EOLP: Erosive Oral lichen planus |
| LP: leukoplakia | ||
| NEOLP: Non-erosive oral lichen planus | ||
| OSCC: Oral squamous cell carcinoma | ||
| Thyroid | 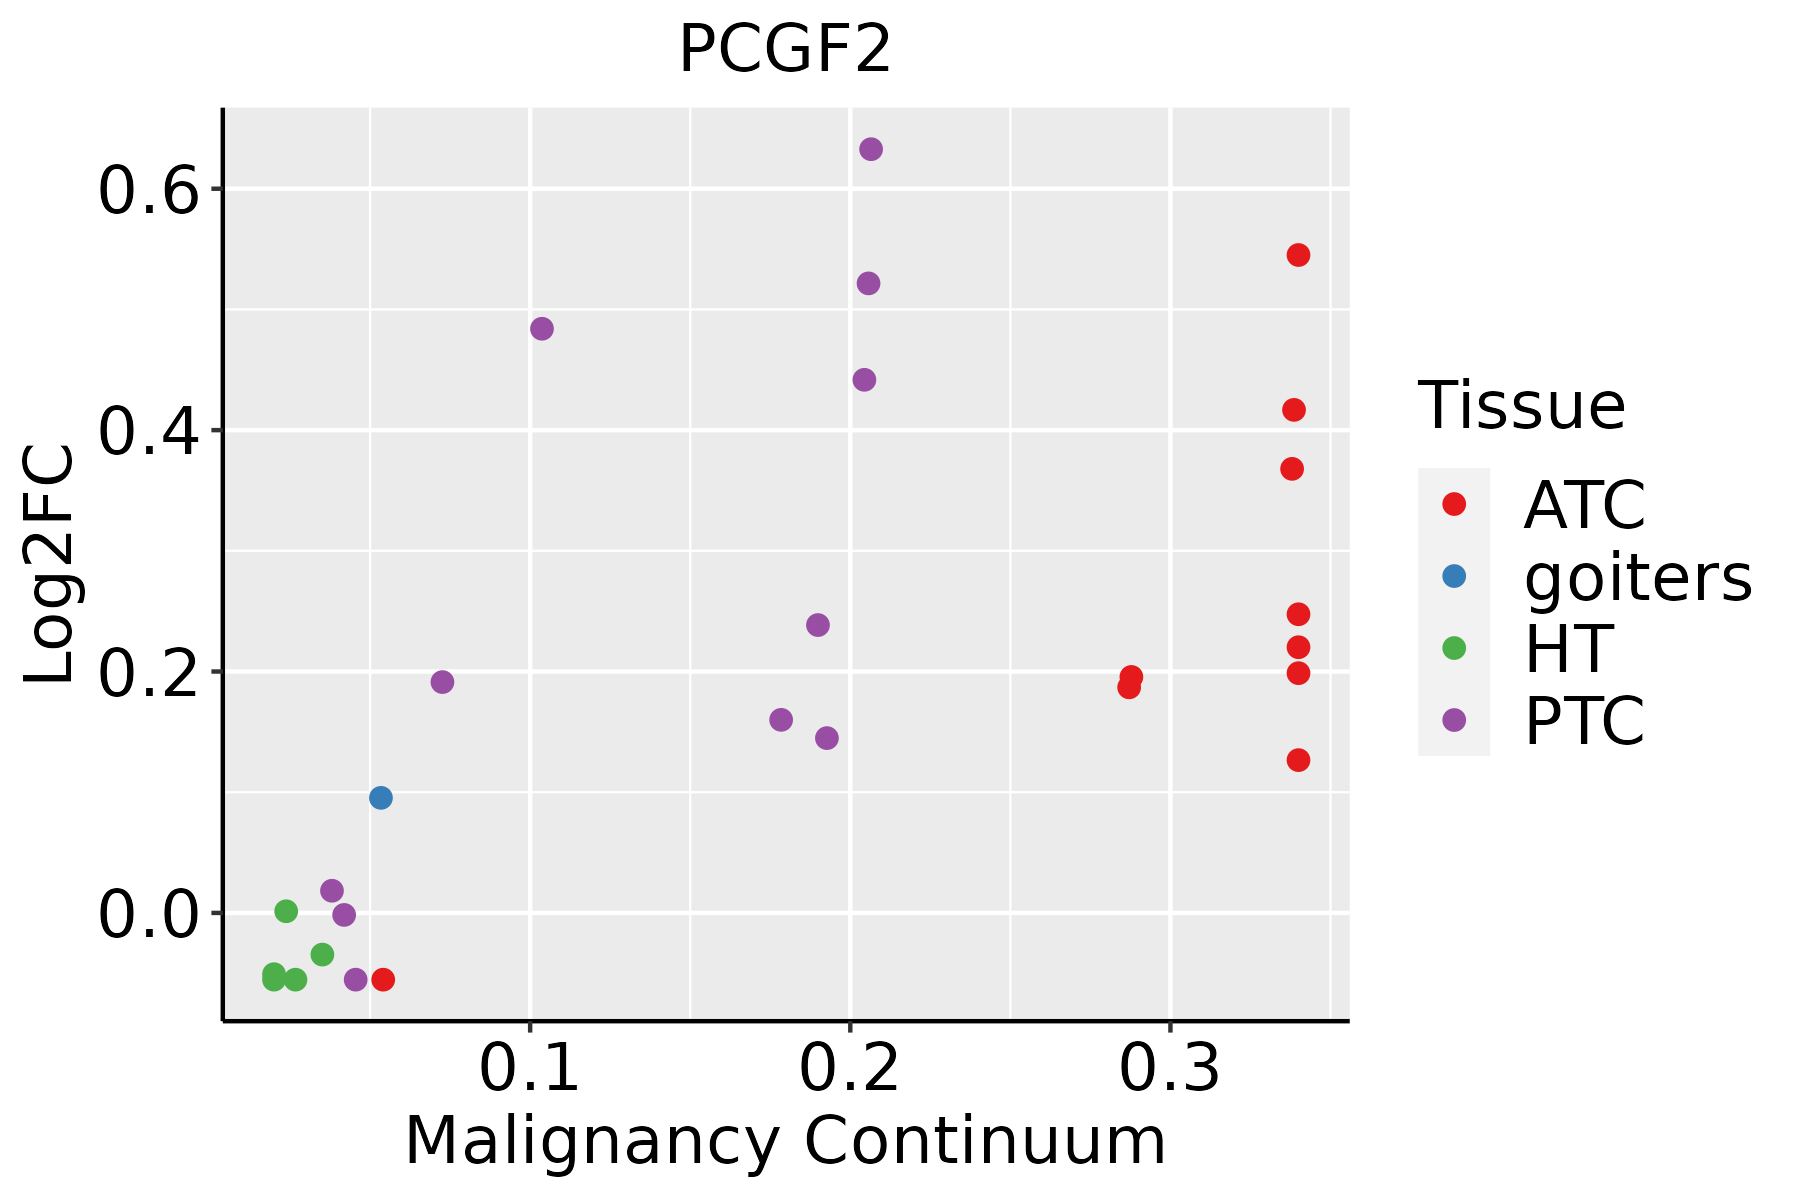 | ATC: Anaplastic thyroid cancer |
| HT: Hashimoto's thyroiditis | ||
| PTC: Papillary thyroid cancer |
| ∗log2FC in expression of this searched gene in stem-like cells from each diseased tissue sample relative to stem-like cells in normal samples in each tissue plotted against the malignancy continuum. Samples are colored based on if they are from different disease stage. |
Top |
Malignant transformation related pathway analysis |
| Find out the enriched GO biological processes and KEGG pathways involved in transition from healthy to precancer to cancer |
| Tissue | Disease Stage | Enriched GO biological Processes |
| Colorectum | AD |  |
| Colorectum | SER |  |
| Colorectum | MSS |  |
| Colorectum | MSI-H |  |
| Colorectum | FAP |  |
| ∗Top 15 enriched GO BP terms are showed in the bar plot of each disease state in each tissue. Each row represents a significant GO biological process which is colored according to the -log10(p.adjust). |
| Page: 1 2 3 4 5 6 7 8 9 |
| GO ID | Tissue | Disease Stage | Description | Gene Ratio | Bg Ratio | pvalue | p.adjust | Count |
| GO:200123314 | Breast | IDC | regulation of apoptotic signaling pathway | 82/1434 | 356/18723 | 6.27e-20 | 5.93e-17 | 82 |
| GO:000697914 | Breast | IDC | response to oxidative stress | 83/1434 | 446/18723 | 2.36e-14 | 7.06e-12 | 83 |
| GO:200123414 | Breast | IDC | negative regulation of apoptotic signaling pathway | 49/1434 | 224/18723 | 1.45e-11 | 2.58e-09 | 49 |
| GO:000030214 | Breast | IDC | response to reactive oxygen species | 46/1434 | 222/18723 | 4.12e-10 | 4.59e-08 | 46 |
| GO:004254213 | Breast | IDC | response to hydrogen peroxide | 32/1434 | 146/18723 | 4.65e-08 | 3.02e-06 | 32 |
| GO:006219714 | Breast | IDC | cellular response to chemical stress | 55/1434 | 337/18723 | 7.07e-08 | 4.36e-06 | 55 |
| GO:003459914 | Breast | IDC | cellular response to oxidative stress | 44/1434 | 288/18723 | 8.26e-06 | 2.43e-04 | 44 |
| GO:003461413 | Breast | IDC | cellular response to reactive oxygen species | 25/1434 | 155/18723 | 3.03e-04 | 4.57e-03 | 25 |
| GO:000170113 | Breast | IDC | in utero embryonic development | 42/1434 | 367/18723 | 5.85e-03 | 4.24e-02 | 42 |
| GO:200123324 | Breast | DCIS | regulation of apoptotic signaling pathway | 81/1390 | 356/18723 | 3.51e-20 | 3.31e-17 | 81 |
| GO:000697924 | Breast | DCIS | response to oxidative stress | 82/1390 | 446/18723 | 1.22e-14 | 3.85e-12 | 82 |
| GO:200123424 | Breast | DCIS | negative regulation of apoptotic signaling pathway | 48/1390 | 224/18723 | 1.70e-11 | 3.22e-09 | 48 |
| GO:000030223 | Breast | DCIS | response to reactive oxygen species | 44/1390 | 222/18723 | 1.62e-09 | 1.48e-07 | 44 |
| GO:006219724 | Breast | DCIS | cellular response to chemical stress | 56/1390 | 337/18723 | 9.64e-09 | 7.38e-07 | 56 |
| GO:004254223 | Breast | DCIS | response to hydrogen peroxide | 30/1390 | 146/18723 | 2.75e-07 | 1.33e-05 | 30 |
| GO:003459924 | Breast | DCIS | cellular response to oxidative stress | 45/1390 | 288/18723 | 1.57e-06 | 5.88e-05 | 45 |
| GO:003461423 | Breast | DCIS | cellular response to reactive oxygen species | 25/1390 | 155/18723 | 1.88e-04 | 3.05e-03 | 25 |
| GO:007030111 | Breast | DCIS | cellular response to hydrogen peroxide | 15/1390 | 98/18723 | 5.65e-03 | 4.09e-02 | 15 |
| GO:000170122 | Breast | DCIS | in utero embryonic development | 41/1390 | 367/18723 | 5.74e-03 | 4.13e-02 | 41 |
| GO:001657015 | Esophagus | ESCC | histone modification | 323/8552 | 463/18723 | 2.61e-26 | 7.88e-24 | 323 |
| Page: 1 2 3 4 5 6 7 8 9 |
| Pathway ID | Tissue | Disease Stage | Description | Gene Ratio | Bg Ratio | pvalue | p.adjust | qvalue | Count |
| Page: 1 |
Top |
Cell-cell communication analysis |
| Identification of potential cell-cell interactions between two cell types and their ligand-receptor pairs for different disease states |
| Ligand | Receptor | LRpair | Pathway | Tissue | Disease Stage |
| Page: 1 |
Top |
Single-cell gene regulatory network inference analysis |
| Find out the significant the regulons (TFs) and the target genes of each regulon across cell types for different disease states |
| TF | Cell Type | Tissue | Disease Stage | Target Gene | RSS | Regulon Activity |
| ∗The dot plots of a searched regulon are shown for all cell subpopulations in each disease state of each tissue based on the regulon specific score inferred using pySCENIC and by calculating the average expression. |
| Page: 1 |
Top |
Somatic mutation of malignant transformation related genes |
| Annotation of somatic variants for genes involved in malignant transformation |
| Hugo Symbol | Variant Class | Variant Classification | dbSNP RS | HGVSc | HGVSp | HGVSp Short | SWISSPROT | BIOTYPE | SIFT | PolyPhen | Tumor Sample Barcode | Tissue | Histology | Sex | Age | Stage | Therapy Types | Drugs | Outcome |
| PCGF2 | SNV | Missense_Mutation | novel | c.291N>A | p.Phe97Leu | p.F97L | P35227 | protein_coding | deleterious(0.04) | probably_damaging(0.945) | TCGA-AN-A046-01 | Breast | breast invasive carcinoma | Female | >=65 | I/II | Unknown | Unknown | SD |
| PCGF2 | SNV | Missense_Mutation | rs746734324 | c.500N>A | p.Arg167Gln | p.R167Q | P35227 | protein_coding | tolerated(0.51) | benign(0.037) | TCGA-C8-A8HP-01 | Breast | breast invasive carcinoma | Female | <65 | III/IV | Chemotherapy | 5-fluorouracil | CR |
| PCGF2 | SNV | Missense_Mutation | novel | c.871N>A | p.Gly291Arg | p.G291R | P35227 | protein_coding | tolerated(0.49) | probably_damaging(0.996) | TCGA-D8-A1JA-01 | Breast | breast invasive carcinoma | Female | <65 | III/IV | Chemotherapy | adriamycin | PD |
| PCGF2 | deletion | Frame_Shift_Del | novel | c.228_232delAGACA | p.Gln76HisfsTer11 | p.Q76Hfs*11 | P35227 | protein_coding | TCGA-D8-A1JG-01 | Breast | breast invasive carcinoma | Female | <65 | I/II | Chemotherapy | doxorubicin | SD | ||
| PCGF2 | SNV | Missense_Mutation | rs746734324 | c.500N>A | p.Arg167Gln | p.R167Q | P35227 | protein_coding | tolerated(0.51) | benign(0.037) | TCGA-VS-A958-01 | Cervix | cervical & endocervical cancer | Female | <65 | I/II | Chemotherapy | cisplatin | CR |
| PCGF2 | SNV | Missense_Mutation | novel | c.82N>A | p.Ala28Thr | p.A28T | P35227 | protein_coding | deleterious(0.02) | possibly_damaging(0.672) | TCGA-AA-3815-01 | Colorectum | colon adenocarcinoma | Female | >=65 | I/II | Unknown | Unknown | SD |
| PCGF2 | SNV | Missense_Mutation | novel | c.278N>A | p.Arg93Gln | p.R93Q | P35227 | protein_coding | deleterious(0.01) | benign(0.109) | TCGA-AA-3984-01 | Colorectum | colon adenocarcinoma | Female | <65 | I/II | Unknown | Unknown | SD |
| PCGF2 | SNV | Missense_Mutation | novel | c.82G>A | p.Ala28Thr | p.A28T | P35227 | protein_coding | deleterious(0.02) | possibly_damaging(0.672) | TCGA-AD-A5EJ-01 | Colorectum | colon adenocarcinoma | Female | >=65 | I/II | Unknown | Unknown | SD |
| PCGF2 | SNV | Missense_Mutation | rs779878626 | c.346N>A | p.Glu116Lys | p.E116K | P35227 | protein_coding | tolerated(0.05) | benign(0.18) | TCGA-AZ-6598-01 | Colorectum | colon adenocarcinoma | Female | >=65 | I/II | Unknown | Unknown | SD |
| PCGF2 | SNV | Missense_Mutation | novel | c.790C>T | p.Pro264Ser | p.P264S | P35227 | protein_coding | tolerated(0.96) | benign(0.01) | TCGA-CK-4951-01 | Colorectum | colon adenocarcinoma | Female | >=65 | I/II | Unknown | Unknown | PD |
| Page: 1 2 3 4 5 |
Top |
Related drugs of malignant transformation related genes |
| Identification of chemicals and drugs interact with genes involved in malignant transfromation |
| (DGIdb 4.0) |
| Entrez ID | Symbol | Category | Interaction Types | Drug Claim Name | Drug Name | PMIDs |
| Page: 1 |

Copyright 2023-Present -The University of Texas Health Science Center at Houston |