
|
|||||
|
 | |
| |
| |
| |
| |
| |
|
Gene: PCGF1 |
Gene summary for PCGF1 |
| Gene information | Species | Human | Gene symbol | PCGF1 | Gene ID | 84759 |
| Gene name | polycomb group ring finger 1 | |
| Gene Alias | 2010002K04Rik | |
| Cytomap | 2p13.1 | |
| Gene Type | protein-coding | GO ID | GO:0000122 | UniProtAcc | Q9BSM1 |
Top |
Malignant transformation analysis |
| Identification of the aberrant gene expression in precancerous and cancerous lesions by comparing the gene expression of stem-like cells in diseased tissues with normal stem cells |
| Entrez ID | Symbol | Replicates | Species | Organ | Tissue | Adj P-value | Log2FC | Malignancy |
| 84759 | PCGF1 | LZE4T | Human | Esophagus | ESCC | 4.01e-11 | 3.72e-01 | 0.0811 |
| 84759 | PCGF1 | LZE7T | Human | Esophagus | ESCC | 5.52e-03 | 2.24e-01 | 0.0667 |
| 84759 | PCGF1 | LZE8T | Human | Esophagus | ESCC | 3.28e-03 | 1.49e-01 | 0.067 |
| 84759 | PCGF1 | LZE24T | Human | Esophagus | ESCC | 1.13e-08 | 2.34e-01 | 0.0596 |
| 84759 | PCGF1 | P2T-E | Human | Esophagus | ESCC | 1.07e-30 | 6.51e-01 | 0.1177 |
| 84759 | PCGF1 | P4T-E | Human | Esophagus | ESCC | 1.26e-23 | 5.41e-01 | 0.1323 |
| 84759 | PCGF1 | P5T-E | Human | Esophagus | ESCC | 1.62e-22 | 4.40e-01 | 0.1327 |
| 84759 | PCGF1 | P8T-E | Human | Esophagus | ESCC | 1.46e-19 | 2.94e-01 | 0.0889 |
| 84759 | PCGF1 | P9T-E | Human | Esophagus | ESCC | 7.86e-13 | 3.52e-01 | 0.1131 |
| 84759 | PCGF1 | P10T-E | Human | Esophagus | ESCC | 2.36e-35 | 5.62e-01 | 0.116 |
| 84759 | PCGF1 | P11T-E | Human | Esophagus | ESCC | 1.77e-15 | 7.38e-01 | 0.1426 |
| 84759 | PCGF1 | P12T-E | Human | Esophagus | ESCC | 2.74e-20 | 4.60e-01 | 0.1122 |
| 84759 | PCGF1 | P15T-E | Human | Esophagus | ESCC | 4.92e-31 | 6.92e-01 | 0.1149 |
| 84759 | PCGF1 | P16T-E | Human | Esophagus | ESCC | 5.40e-30 | 5.31e-01 | 0.1153 |
| 84759 | PCGF1 | P19T-E | Human | Esophagus | ESCC | 1.38e-04 | 5.22e-01 | 0.1662 |
| 84759 | PCGF1 | P20T-E | Human | Esophagus | ESCC | 3.27e-25 | 5.87e-01 | 0.1124 |
| 84759 | PCGF1 | P21T-E | Human | Esophagus | ESCC | 3.51e-44 | 8.34e-01 | 0.1617 |
| 84759 | PCGF1 | P22T-E | Human | Esophagus | ESCC | 2.18e-32 | 5.17e-01 | 0.1236 |
| 84759 | PCGF1 | P23T-E | Human | Esophagus | ESCC | 6.26e-25 | 5.97e-01 | 0.108 |
| 84759 | PCGF1 | P24T-E | Human | Esophagus | ESCC | 1.75e-24 | 4.33e-01 | 0.1287 |
| Page: 1 2 3 4 5 |
| Tissue | Expression Dynamics | Abbreviation |
| Esophagus | 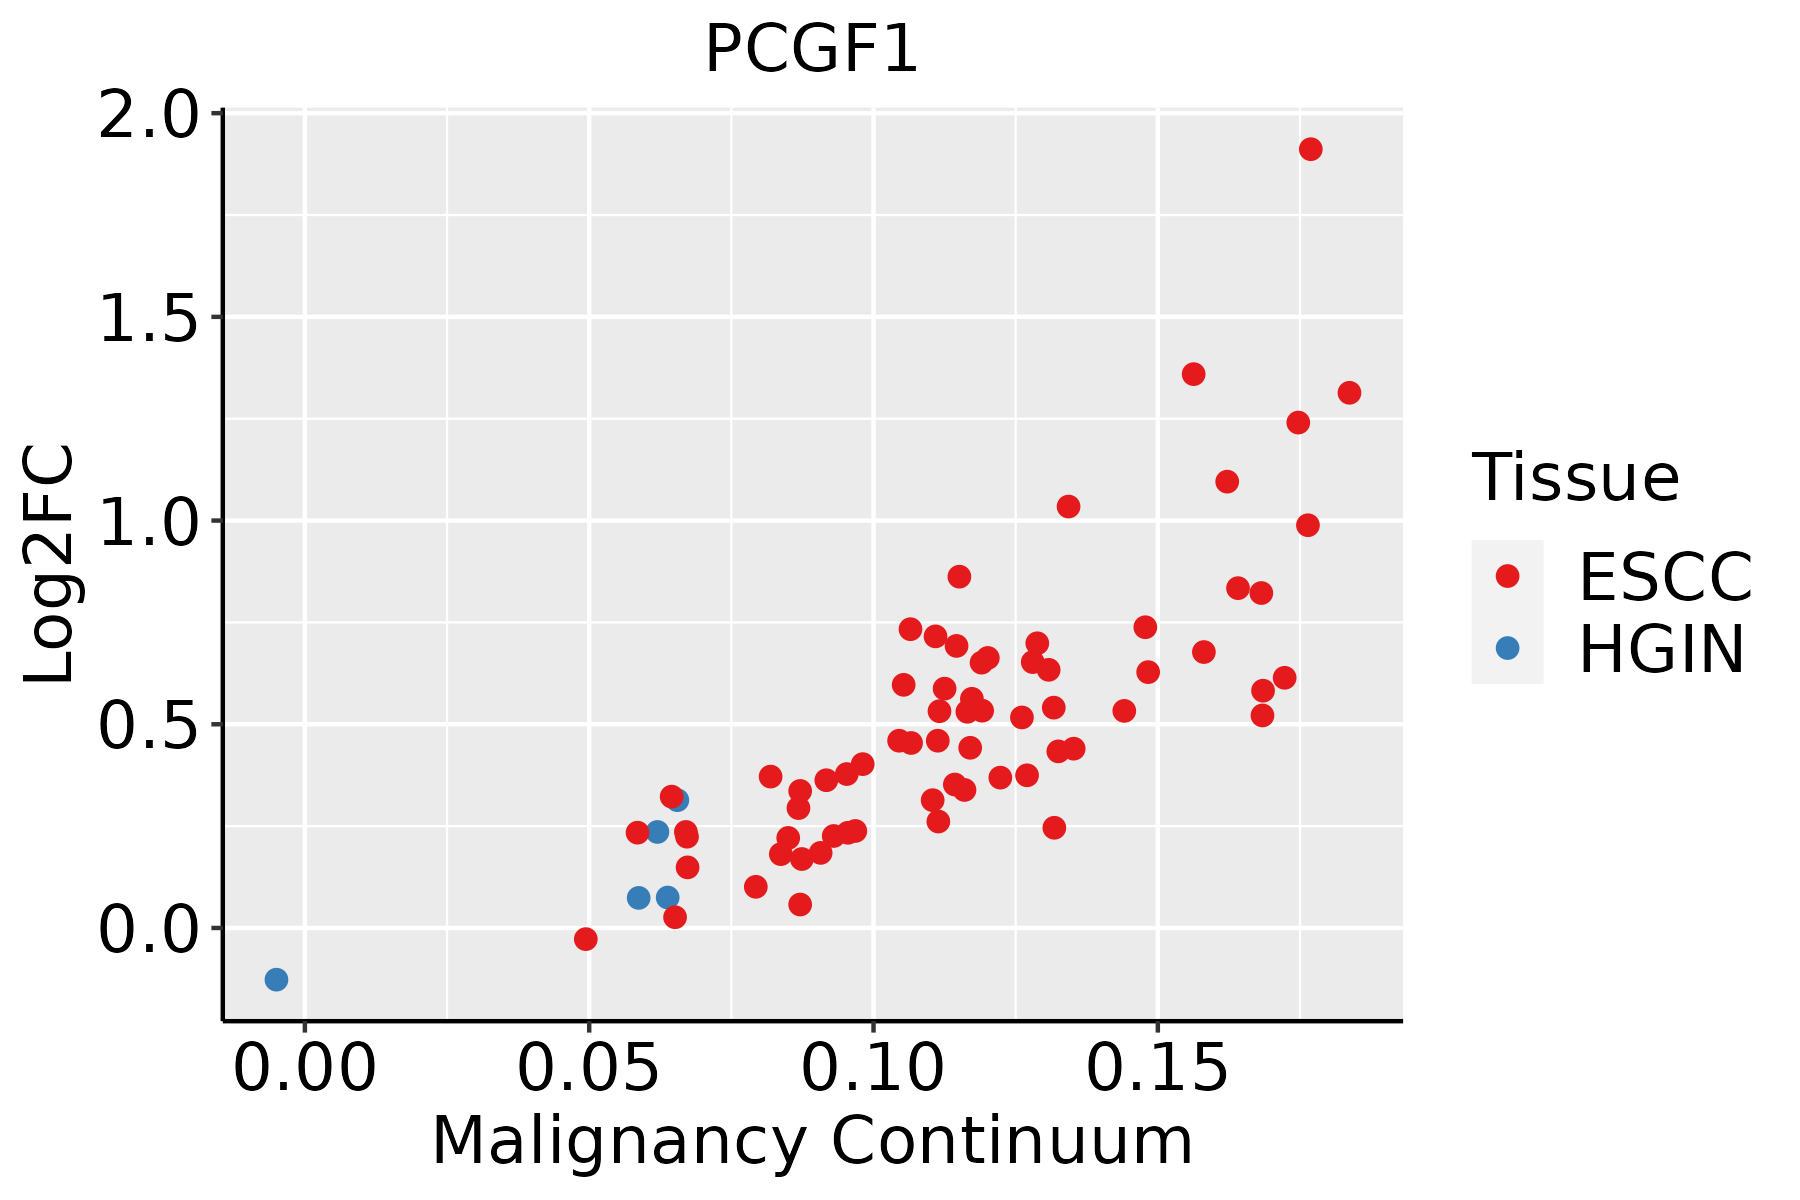 | ESCC: Esophageal squamous cell carcinoma |
| HGIN: High-grade intraepithelial neoplasias | ||
| LGIN: Low-grade intraepithelial neoplasias | ||
| Liver | 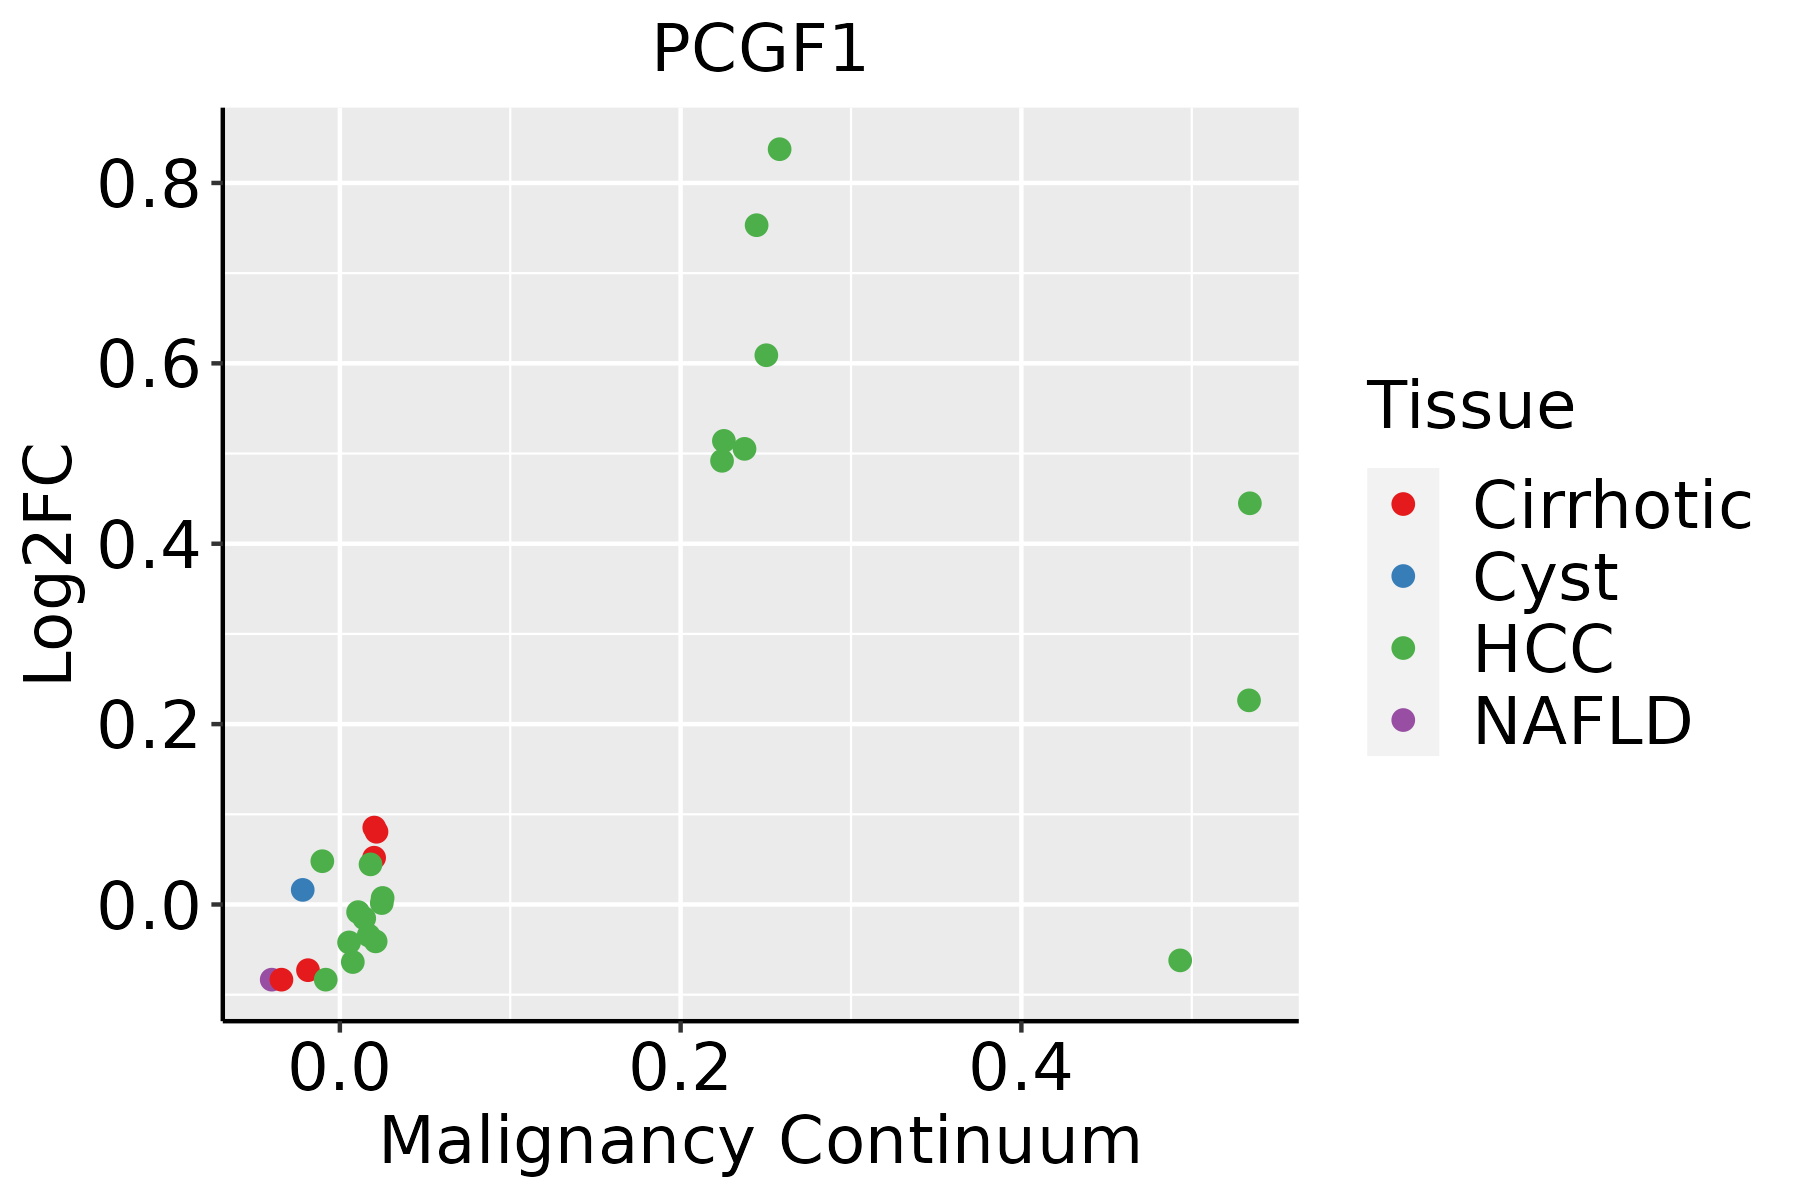 | HCC: Hepatocellular carcinoma |
| NAFLD: Non-alcoholic fatty liver disease | ||
| Oral Cavity | 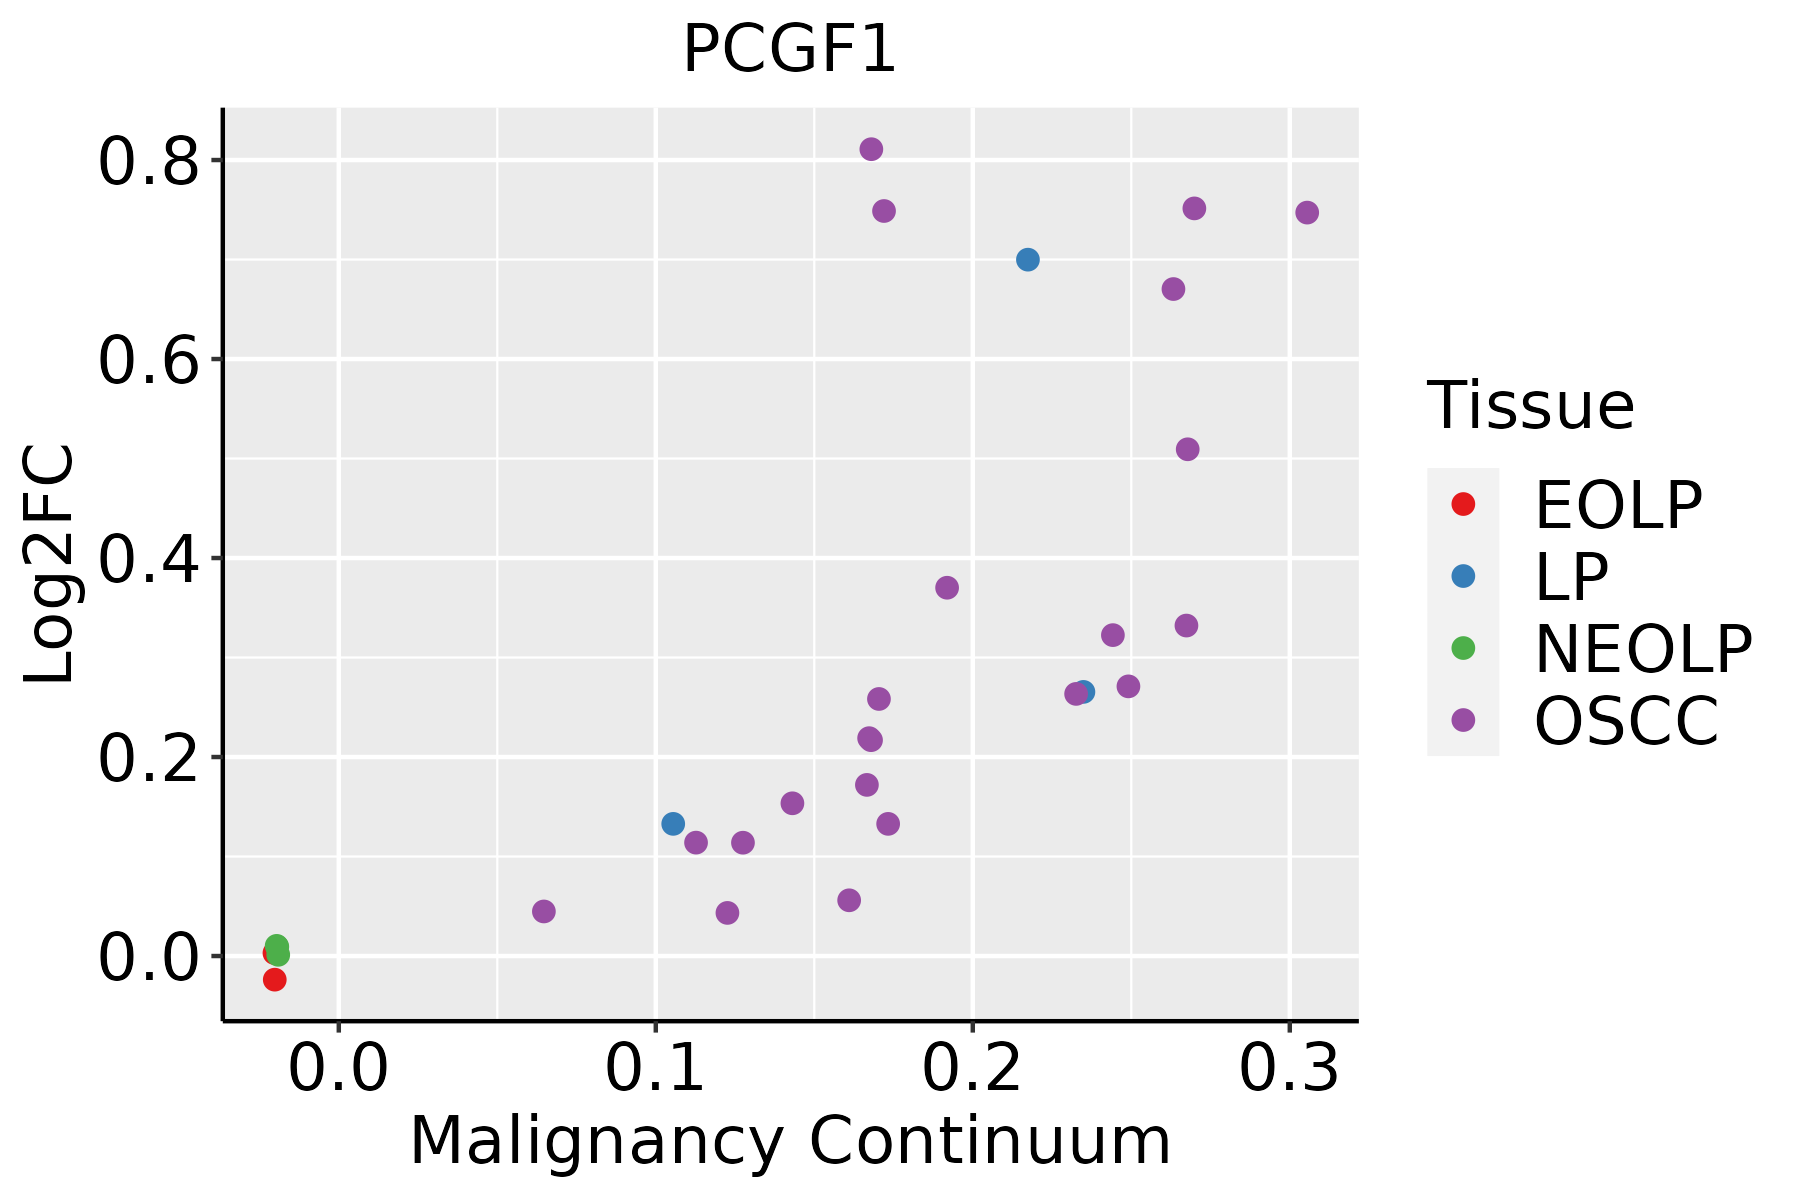 | EOLP: Erosive Oral lichen planus |
| LP: leukoplakia | ||
| NEOLP: Non-erosive oral lichen planus | ||
| OSCC: Oral squamous cell carcinoma |
| ∗log2FC in expression of this searched gene in stem-like cells from each diseased tissue sample relative to stem-like cells in normal samples in each tissue plotted against the malignancy continuum. Samples are colored based on if they are from different disease stage. |
Top |
Malignant transformation related pathway analysis |
| Find out the enriched GO biological processes and KEGG pathways involved in transition from healthy to precancer to cancer |
| Tissue | Disease Stage | Enriched GO biological Processes |
| Colorectum | AD |  |
| Colorectum | SER |  |
| Colorectum | MSS |  |
| Colorectum | MSI-H |  |
| Colorectum | FAP |  |
| ∗Top 15 enriched GO BP terms are showed in the bar plot of each disease state in each tissue. Each row represents a significant GO biological process which is colored according to the -log10(p.adjust). |
| Page: 1 2 3 4 5 6 7 8 9 |
| GO ID | Tissue | Disease Stage | Description | Gene Ratio | Bg Ratio | pvalue | p.adjust | Count |
| GO:001657015 | Esophagus | ESCC | histone modification | 323/8552 | 463/18723 | 2.61e-26 | 7.88e-24 | 323 |
| GO:00065136 | Esophagus | ESCC | protein monoubiquitination | 53/8552 | 67/18723 | 2.11e-08 | 4.03e-07 | 53 |
| GO:001657414 | Esophagus | ESCC | histone ubiquitination | 40/8552 | 47/18723 | 2.40e-08 | 4.55e-07 | 40 |
| GO:003352213 | Esophagus | ESCC | histone H2A ubiquitination | 23/8552 | 26/18723 | 6.82e-06 | 6.90e-05 | 23 |
| GO:00103904 | Esophagus | ESCC | histone monoubiquitination | 25/8552 | 29/18723 | 7.24e-06 | 7.20e-05 | 25 |
| GO:00355182 | Esophagus | ESCC | histone H2A monoubiquitination | 15/8552 | 17/18723 | 3.48e-04 | 2.03e-03 | 15 |
| GO:001657011 | Liver | Cirrhotic | histone modification | 154/4634 | 463/18723 | 1.92e-05 | 2.57e-04 | 154 |
| GO:001657411 | Liver | Cirrhotic | histone ubiquitination | 21/4634 | 47/18723 | 2.24e-03 | 1.36e-02 | 21 |
| GO:00335223 | Liver | Cirrhotic | histone H2A ubiquitination | 13/4634 | 26/18723 | 4.72e-03 | 2.48e-02 | 13 |
| GO:00065133 | Liver | Cirrhotic | protein monoubiquitination | 26/4634 | 67/18723 | 7.53e-03 | 3.57e-02 | 26 |
| GO:001657021 | Liver | HCC | histone modification | 283/7958 | 463/18723 | 2.68e-16 | 2.33e-14 | 283 |
| GO:00165742 | Liver | HCC | histone ubiquitination | 37/7958 | 47/18723 | 4.37e-07 | 7.23e-06 | 37 |
| GO:0010390 | Liver | HCC | histone monoubiquitination | 23/7958 | 29/18723 | 5.86e-05 | 5.38e-04 | 23 |
| GO:000651311 | Liver | HCC | protein monoubiquitination | 44/7958 | 67/18723 | 1.08e-04 | 9.22e-04 | 44 |
| GO:003352211 | Liver | HCC | histone H2A ubiquitination | 20/7958 | 26/18723 | 3.82e-04 | 2.61e-03 | 20 |
| GO:0035518 | Liver | HCC | histone H2A monoubiquitination | 13/7958 | 17/18723 | 4.77e-03 | 2.02e-02 | 13 |
| GO:00165707 | Oral cavity | OSCC | histone modification | 270/7305 | 463/18723 | 1.59e-17 | 1.50e-15 | 270 |
| GO:00165746 | Oral cavity | OSCC | histone ubiquitination | 38/7305 | 47/18723 | 5.22e-09 | 1.14e-07 | 38 |
| GO:00065135 | Oral cavity | OSCC | protein monoubiquitination | 47/7305 | 67/18723 | 2.32e-07 | 3.68e-06 | 47 |
| GO:00103903 | Oral cavity | OSCC | histone monoubiquitination | 24/7305 | 29/18723 | 1.74e-06 | 2.26e-05 | 24 |
| Page: 1 2 |
| Pathway ID | Tissue | Disease Stage | Description | Gene Ratio | Bg Ratio | pvalue | p.adjust | qvalue | Count |
| Page: 1 |
Top |
Cell-cell communication analysis |
| Identification of potential cell-cell interactions between two cell types and their ligand-receptor pairs for different disease states |
| Ligand | Receptor | LRpair | Pathway | Tissue | Disease Stage |
| Page: 1 |
Top |
Single-cell gene regulatory network inference analysis |
| Find out the significant the regulons (TFs) and the target genes of each regulon across cell types for different disease states |
| TF | Cell Type | Tissue | Disease Stage | Target Gene | RSS | Regulon Activity |
| ∗The dot plots of a searched regulon are shown for all cell subpopulations in each disease state of each tissue based on the regulon specific score inferred using pySCENIC and by calculating the average expression. |
| Page: 1 |
Top |
Somatic mutation of malignant transformation related genes |
| Annotation of somatic variants for genes involved in malignant transformation |
| Hugo Symbol | Variant Class | Variant Classification | dbSNP RS | HGVSc | HGVSp | HGVSp Short | SWISSPROT | BIOTYPE | SIFT | PolyPhen | Tumor Sample Barcode | Tissue | Histology | Sex | Age | Stage | Therapy Types | Drugs | Outcome |
| PCGF1 | deletion | Frame_Shift_Del | novel | c.599delT | p.Val200AspfsTer12 | p.V200Dfs*12 | Q9BSM1 | protein_coding | TCGA-D8-A27V-01 | Breast | breast invasive carcinoma | Female | <65 | I/II | Hormone Therapy | tamoxiphen | SD | ||
| PCGF1 | SNV | Missense_Mutation | c.595G>A | p.Glu199Lys | p.E199K | Q9BSM1 | protein_coding | tolerated(0.19) | benign(0.165) | TCGA-IR-A3LA-01 | Cervix | cervical & endocervical cancer | Female | <65 | I/II | Chemotherapy | cisplatin | CR | |
| PCGF1 | SNV | Missense_Mutation | novel | c.223T>C | p.Tyr75His | p.Y75H | Q9BSM1 | protein_coding | tolerated(0.44) | possibly_damaging(0.651) | TCGA-AA-3984-01 | Colorectum | colon adenocarcinoma | Female | <65 | I/II | Unknown | Unknown | SD |
| PCGF1 | SNV | Missense_Mutation | novel | c.337C>T | p.Pro113Ser | p.P113S | Q9BSM1 | protein_coding | deleterious(0) | possibly_damaging(0.569) | TCGA-AA-A00N-01 | Colorectum | colon adenocarcinoma | Male | >=65 | I/II | Unknown | Unknown | PD |
| PCGF1 | SNV | Missense_Mutation | c.428N>A | p.Pro143Gln | p.P143Q | Q9BSM1 | protein_coding | tolerated(0.32) | benign(0.073) | TCGA-AA-A01R-01 | Colorectum | colon adenocarcinoma | Male | <65 | III/IV | Chemotherapy | 5-fluorouracil | PD | |
| PCGF1 | SNV | Missense_Mutation | novel | c.485A>G | p.Tyr162Cys | p.Y162C | Q9BSM1 | protein_coding | tolerated(0.06) | possibly_damaging(0.706) | TCGA-AM-5821-01 | Colorectum | colon adenocarcinoma | Female | >=65 | I/II | Unknown | Unknown | SD |
| PCGF1 | SNV | Missense_Mutation | c.364N>T | p.Arg122Trp | p.R122W | Q9BSM1 | protein_coding | deleterious(0) | probably_damaging(0.977) | TCGA-CK-6746-01 | Colorectum | colon adenocarcinoma | Female | >=65 | I/II | Unknown | Unknown | SD | |
| PCGF1 | SNV | Missense_Mutation | c.130N>T | p.His44Tyr | p.H44Y | Q9BSM1 | protein_coding | deleterious(0.02) | benign(0.078) | TCGA-CM-6168-01 | Colorectum | colon adenocarcinoma | Female | >=65 | I/II | Unknown | Unknown | SD | |
| PCGF1 | SNV | Missense_Mutation | c.271G>A | p.Glu91Lys | p.E91K | Q9BSM1 | protein_coding | tolerated(0.07) | probably_damaging(0.959) | TCGA-D5-6530-01 | Colorectum | colon adenocarcinoma | Male | <65 | I/II | Unknown | Unknown | SD | |
| PCGF1 | SNV | Missense_Mutation | c.100N>T | p.Val34Phe | p.V34F | Q9BSM1 | protein_coding | tolerated(0.06) | benign(0.445) | TCGA-F4-6809-01 | Colorectum | colon adenocarcinoma | Female | <65 | I/II | Unknown | Unknown | PD |
| Page: 1 2 3 |
Top |
Related drugs of malignant transformation related genes |
| Identification of chemicals and drugs interact with genes involved in malignant transfromation |
| (DGIdb 4.0) |
| Entrez ID | Symbol | Category | Interaction Types | Drug Claim Name | Drug Name | PMIDs |
| Page: 1 |

Copyright 2023-Present -The University of Texas Health Science Center at Houston |