
|
|||||
|
 | |
| |
| |
| |
| |
| |
|
Gene: PCF11 |
Gene summary for PCF11 |
| Gene information | Species | Human | Gene symbol | PCF11 | Gene ID | 51585 |
| Gene name | PCF11 cleavage and polyadenylation factor subunit | |
| Gene Alias | PCF11 | |
| Cytomap | 11q14.1 | |
| Gene Type | protein-coding | GO ID | GO:0006139 | UniProtAcc | O94913 |
Top |
Malignant transformation analysis |
| Identification of the aberrant gene expression in precancerous and cancerous lesions by comparing the gene expression of stem-like cells in diseased tissues with normal stem cells |
| Entrez ID | Symbol | Replicates | Species | Organ | Tissue | Adj P-value | Log2FC | Malignancy |
| 51585 | PCF11 | LZE2T | Human | Esophagus | ESCC | 5.05e-04 | 4.76e-01 | 0.082 |
| 51585 | PCF11 | LZE4T | Human | Esophagus | ESCC | 2.12e-03 | 1.45e-01 | 0.0811 |
| 51585 | PCF11 | LZE5T | Human | Esophagus | ESCC | 7.49e-05 | 1.79e-01 | 0.0514 |
| 51585 | PCF11 | LZE8T | Human | Esophagus | ESCC | 1.07e-10 | 1.82e-01 | 0.067 |
| 51585 | PCF11 | LZE20T | Human | Esophagus | ESCC | 4.60e-07 | 1.57e-01 | 0.0662 |
| 51585 | PCF11 | LZE22T | Human | Esophagus | ESCC | 1.27e-04 | 1.54e-01 | 0.068 |
| 51585 | PCF11 | LZE24T | Human | Esophagus | ESCC | 1.33e-13 | 2.78e-01 | 0.0596 |
| 51585 | PCF11 | P1T-E | Human | Esophagus | ESCC | 3.26e-03 | 3.81e-01 | 0.0875 |
| 51585 | PCF11 | P2T-E | Human | Esophagus | ESCC | 2.14e-15 | 7.43e-02 | 0.1177 |
| 51585 | PCF11 | P4T-E | Human | Esophagus | ESCC | 2.99e-13 | 1.93e-01 | 0.1323 |
| 51585 | PCF11 | P5T-E | Human | Esophagus | ESCC | 1.82e-13 | 1.53e-01 | 0.1327 |
| 51585 | PCF11 | P8T-E | Human | Esophagus | ESCC | 3.35e-10 | 1.27e-01 | 0.0889 |
| 51585 | PCF11 | P9T-E | Human | Esophagus | ESCC | 2.37e-10 | 2.18e-01 | 0.1131 |
| 51585 | PCF11 | P10T-E | Human | Esophagus | ESCC | 1.26e-18 | 4.94e-01 | 0.116 |
| 51585 | PCF11 | P11T-E | Human | Esophagus | ESCC | 4.38e-12 | 3.01e-01 | 0.1426 |
| 51585 | PCF11 | P12T-E | Human | Esophagus | ESCC | 6.08e-30 | 6.81e-01 | 0.1122 |
| 51585 | PCF11 | P15T-E | Human | Esophagus | ESCC | 1.93e-14 | 2.06e-01 | 0.1149 |
| 51585 | PCF11 | P16T-E | Human | Esophagus | ESCC | 7.61e-18 | 2.30e-01 | 0.1153 |
| 51585 | PCF11 | P20T-E | Human | Esophagus | ESCC | 1.41e-09 | 6.34e-02 | 0.1124 |
| 51585 | PCF11 | P21T-E | Human | Esophagus | ESCC | 6.10e-20 | 3.17e-01 | 0.1617 |
| Page: 1 2 3 4 5 6 7 |
| Tissue | Expression Dynamics | Abbreviation |
| Esophagus | 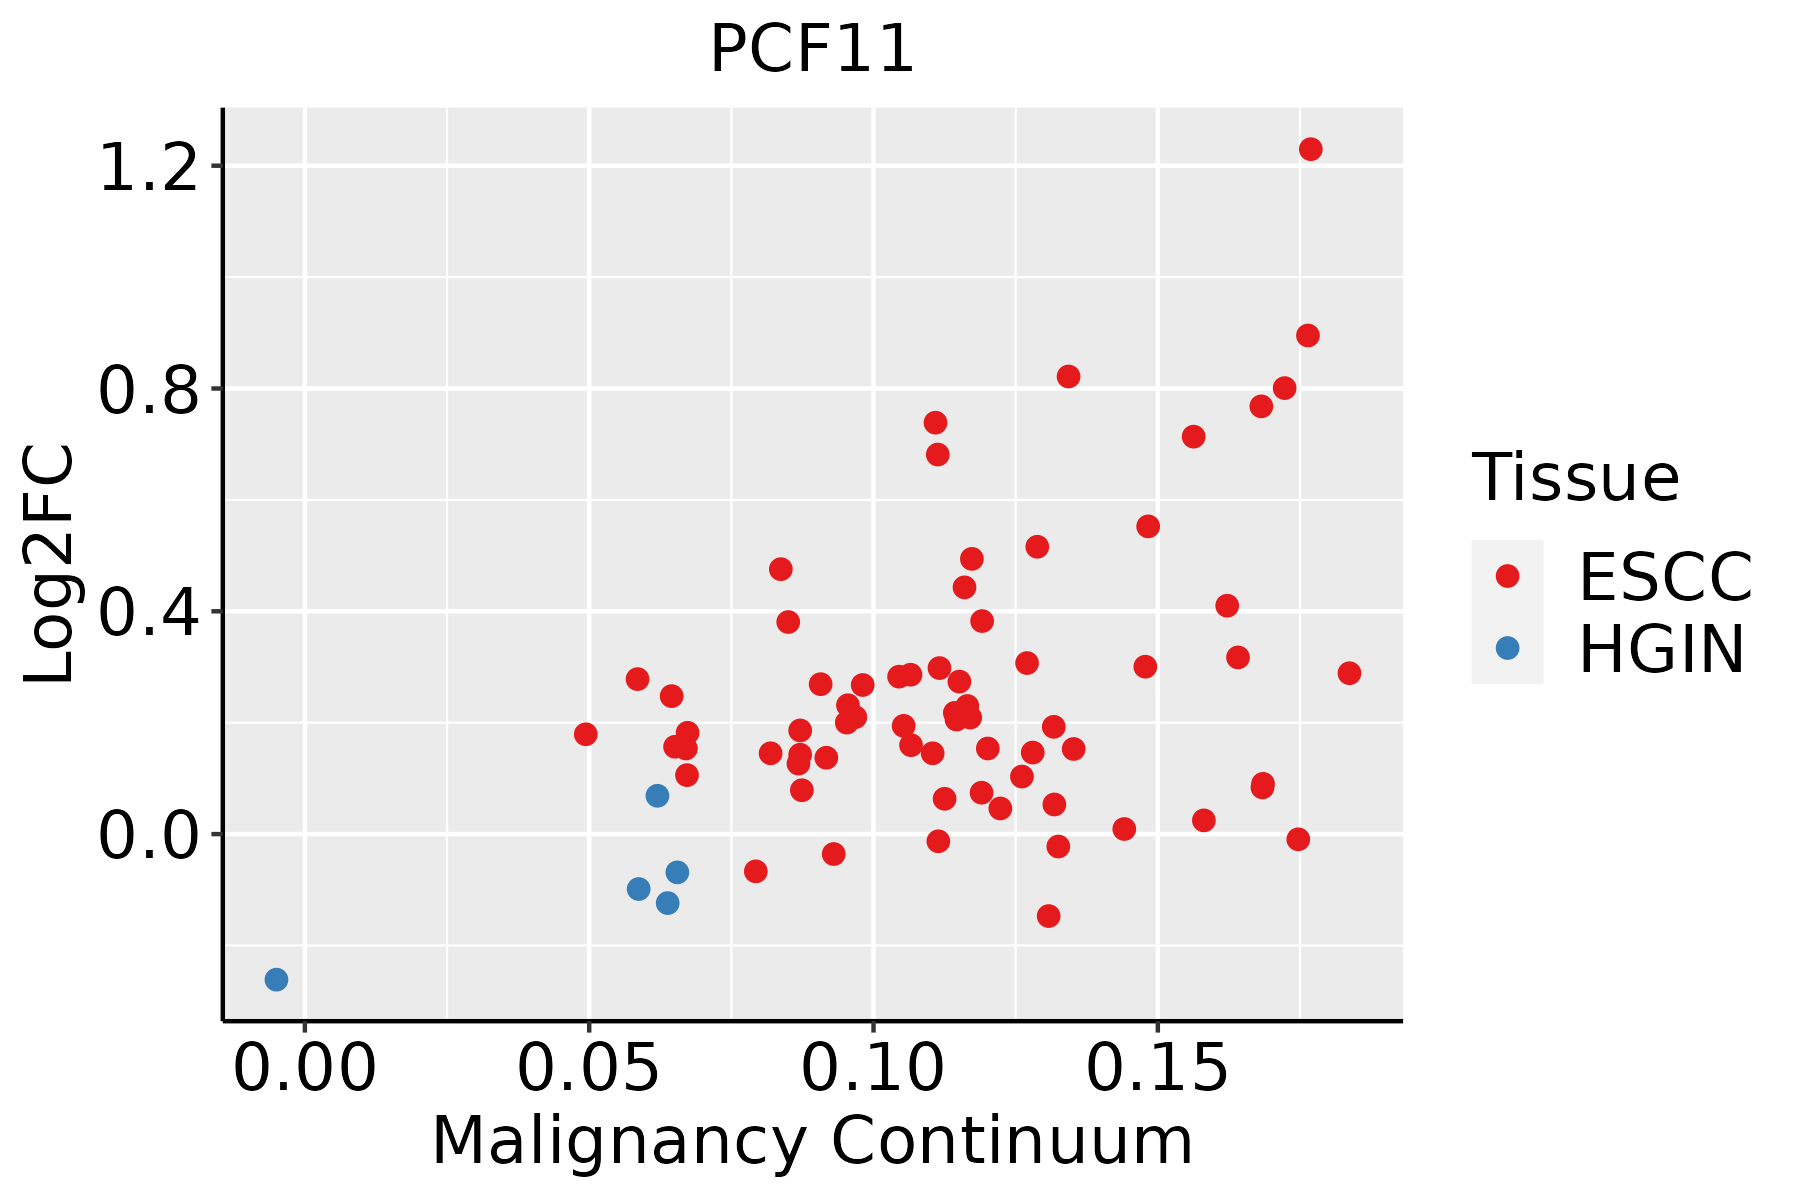 | ESCC: Esophageal squamous cell carcinoma |
| HGIN: High-grade intraepithelial neoplasias | ||
| LGIN: Low-grade intraepithelial neoplasias | ||
| Oral Cavity | 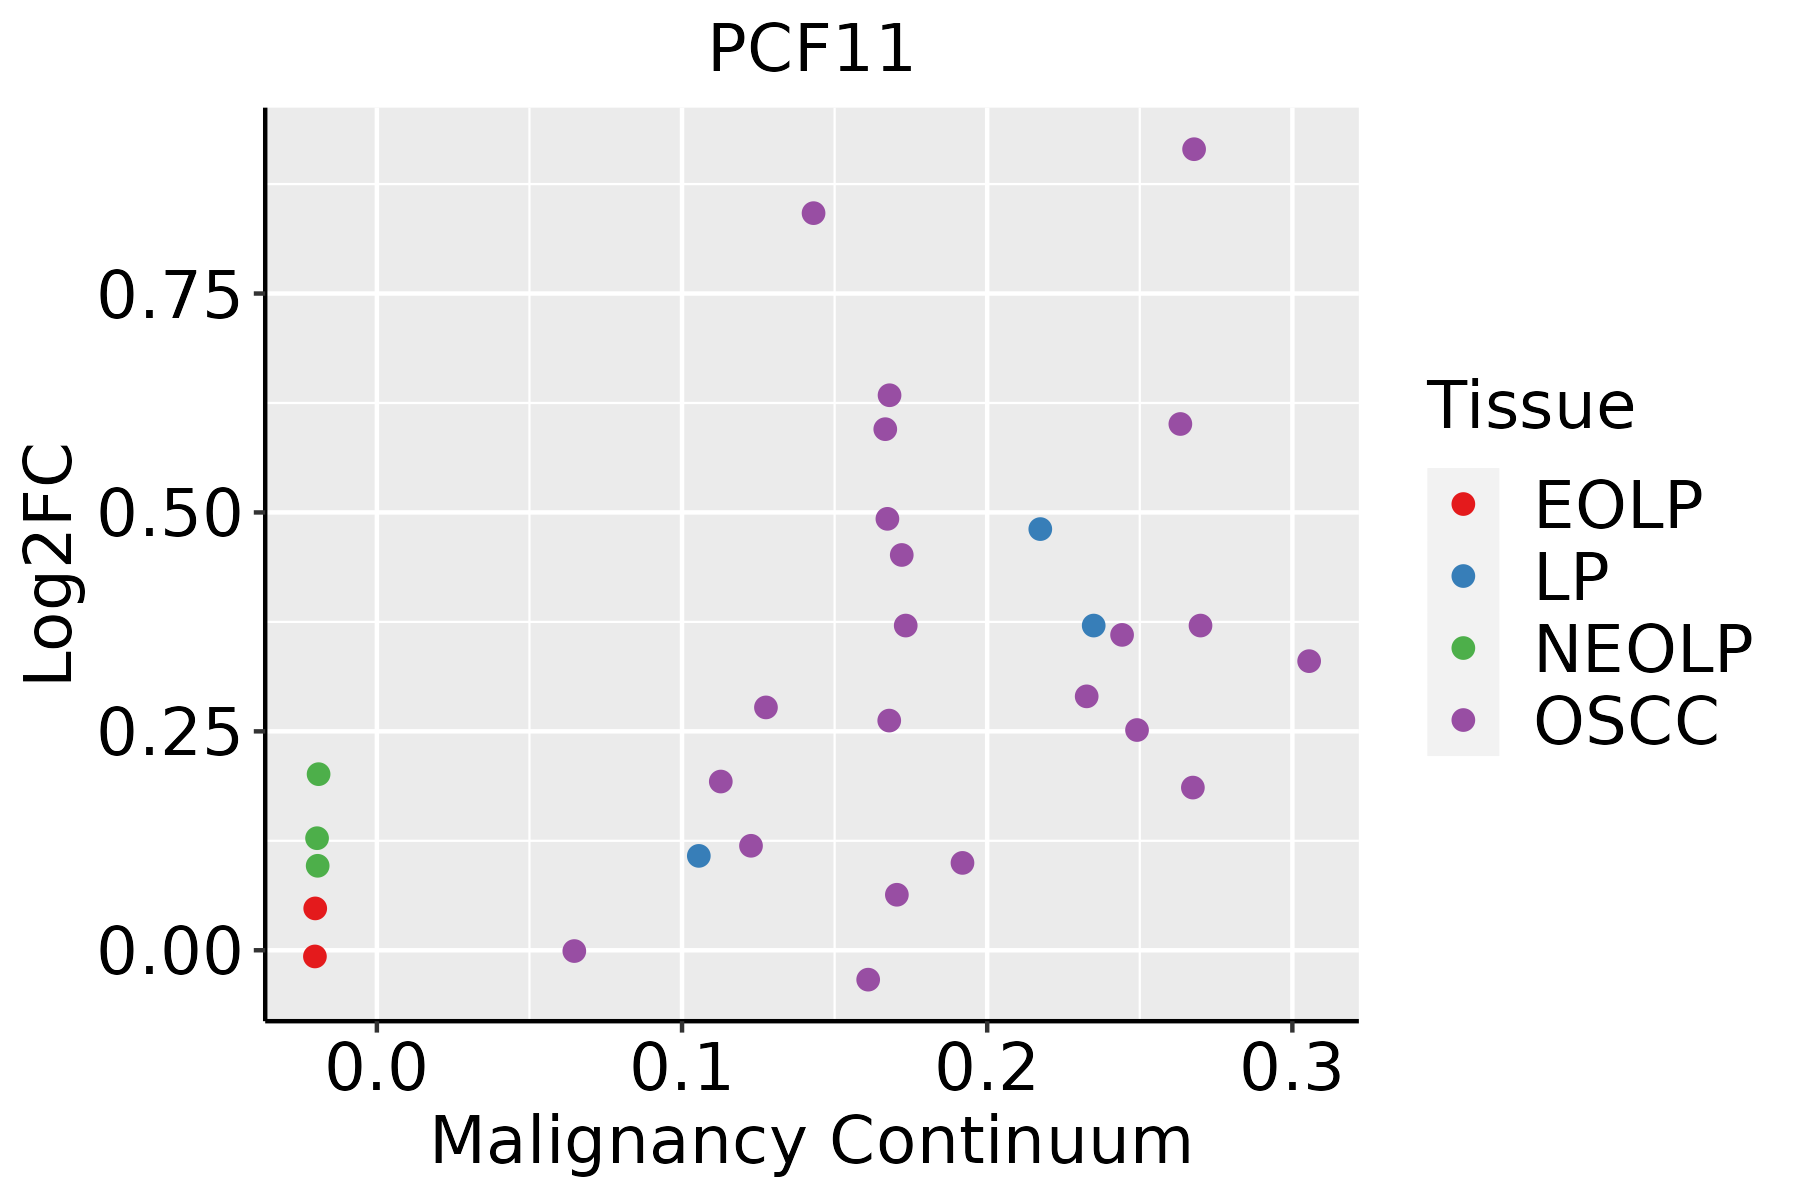 | EOLP: Erosive Oral lichen planus |
| LP: leukoplakia | ||
| NEOLP: Non-erosive oral lichen planus | ||
| OSCC: Oral squamous cell carcinoma | ||
| Prostate | 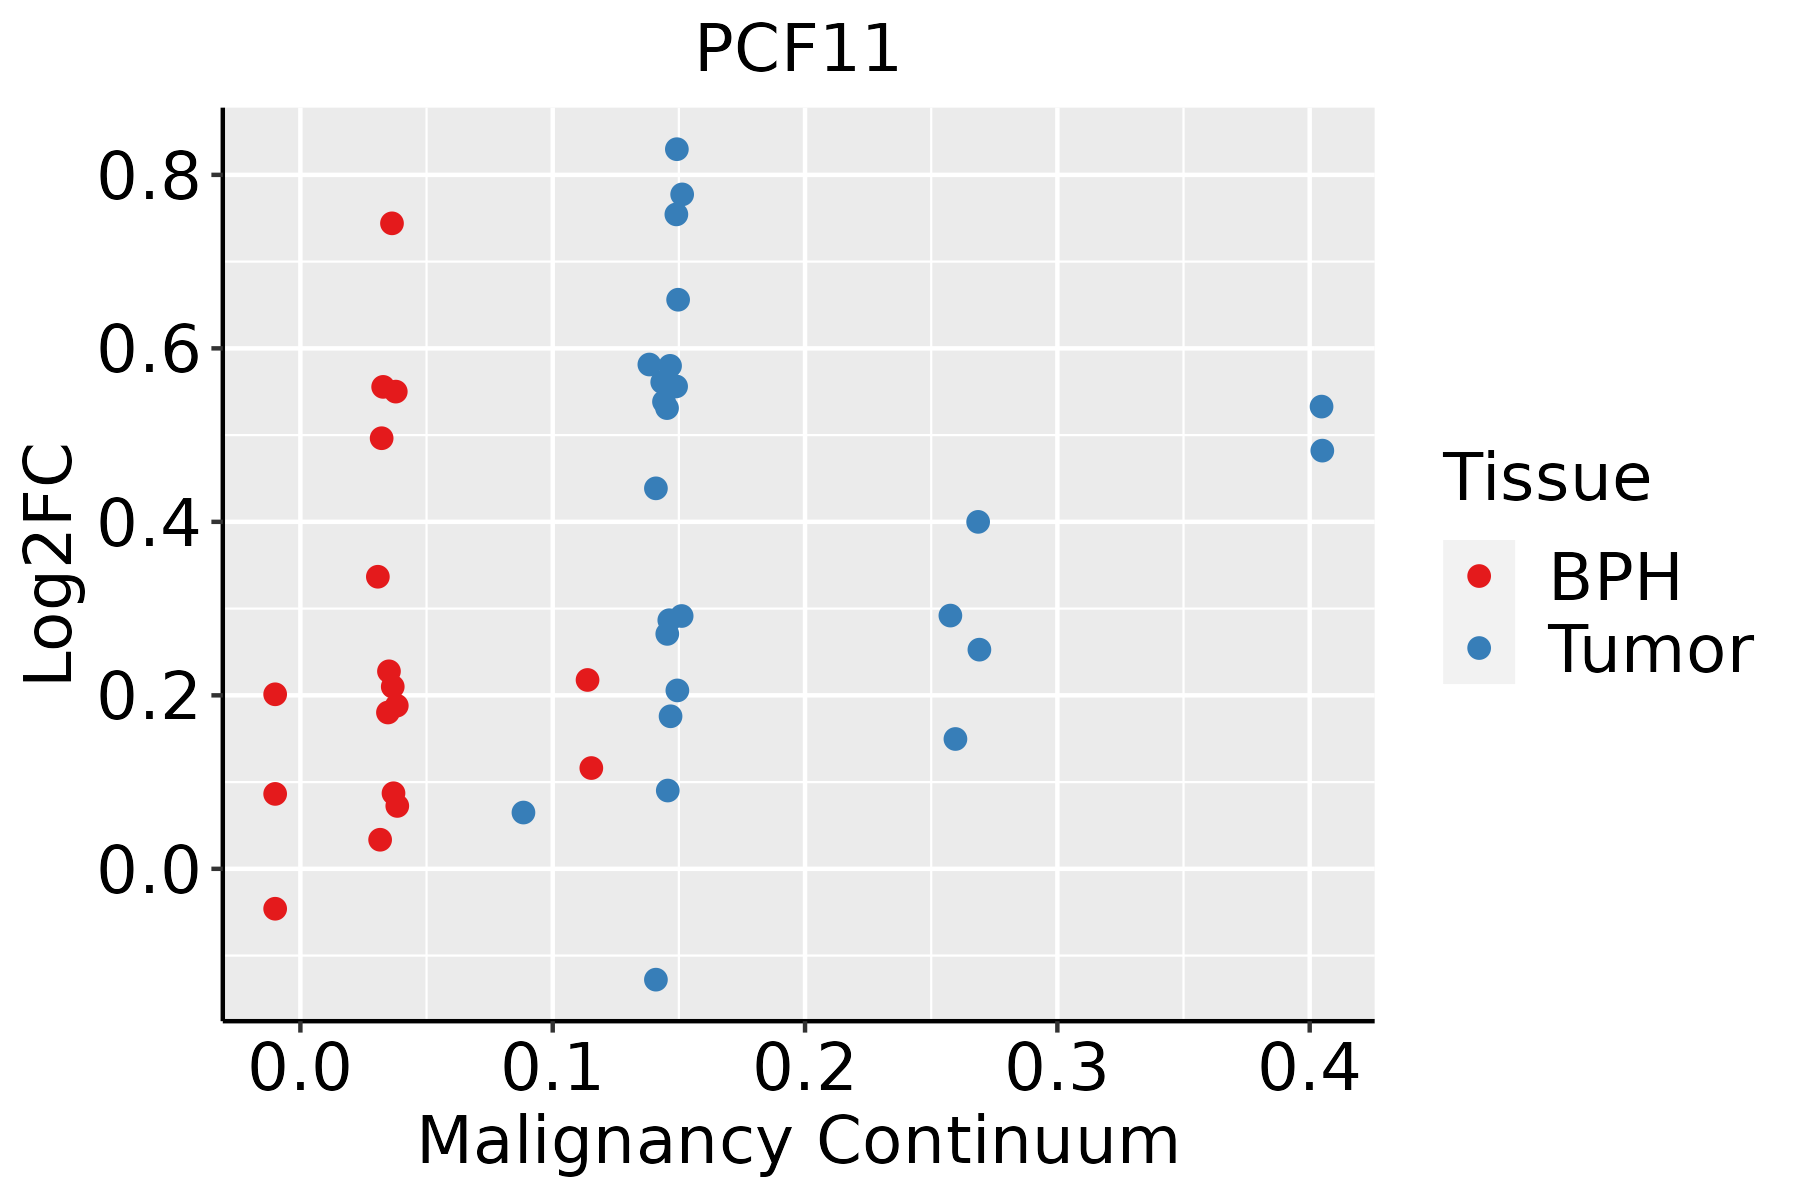 | BPH: Benign Prostatic Hyperplasia |
| Skin | 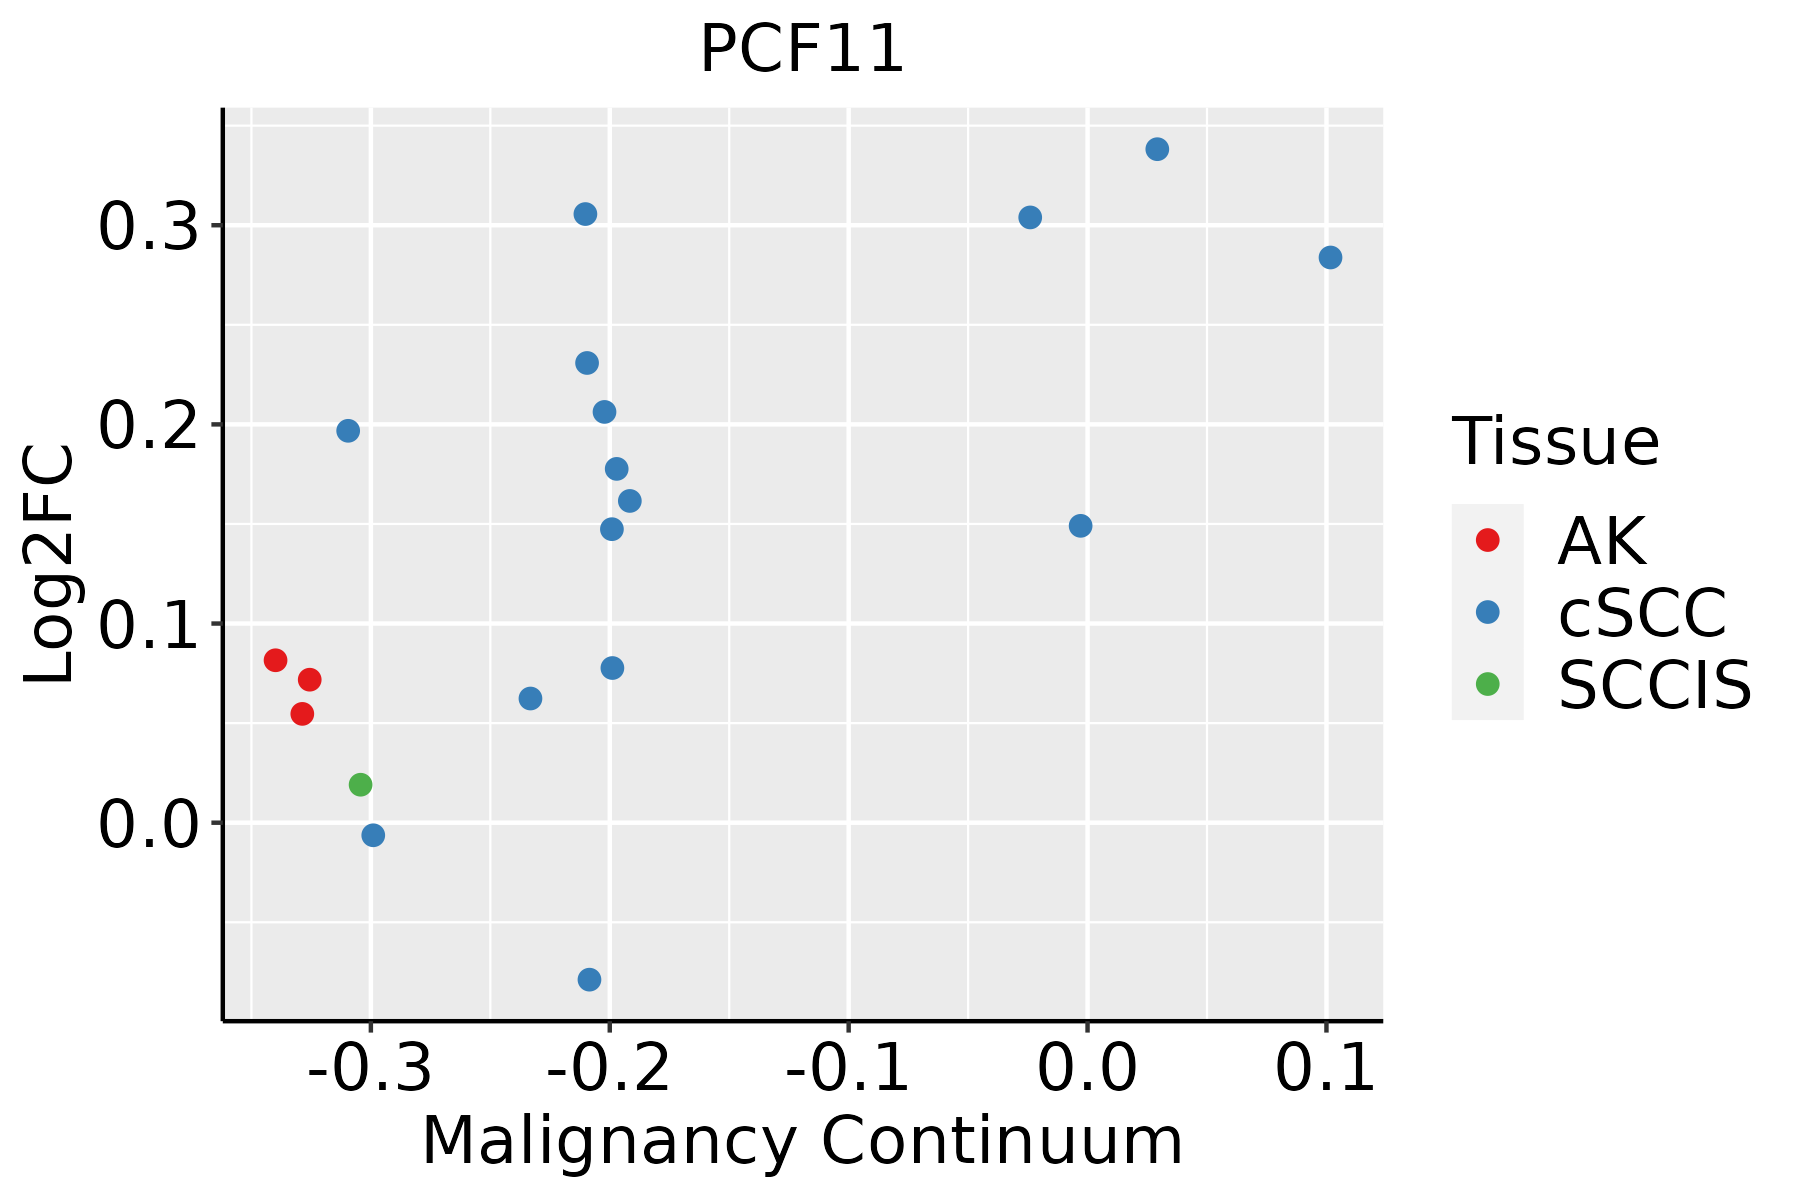 | AK: Actinic keratosis |
| cSCC: Cutaneous squamous cell carcinoma | ||
| SCCIS:squamous cell carcinoma in situ | ||
| Thyroid | 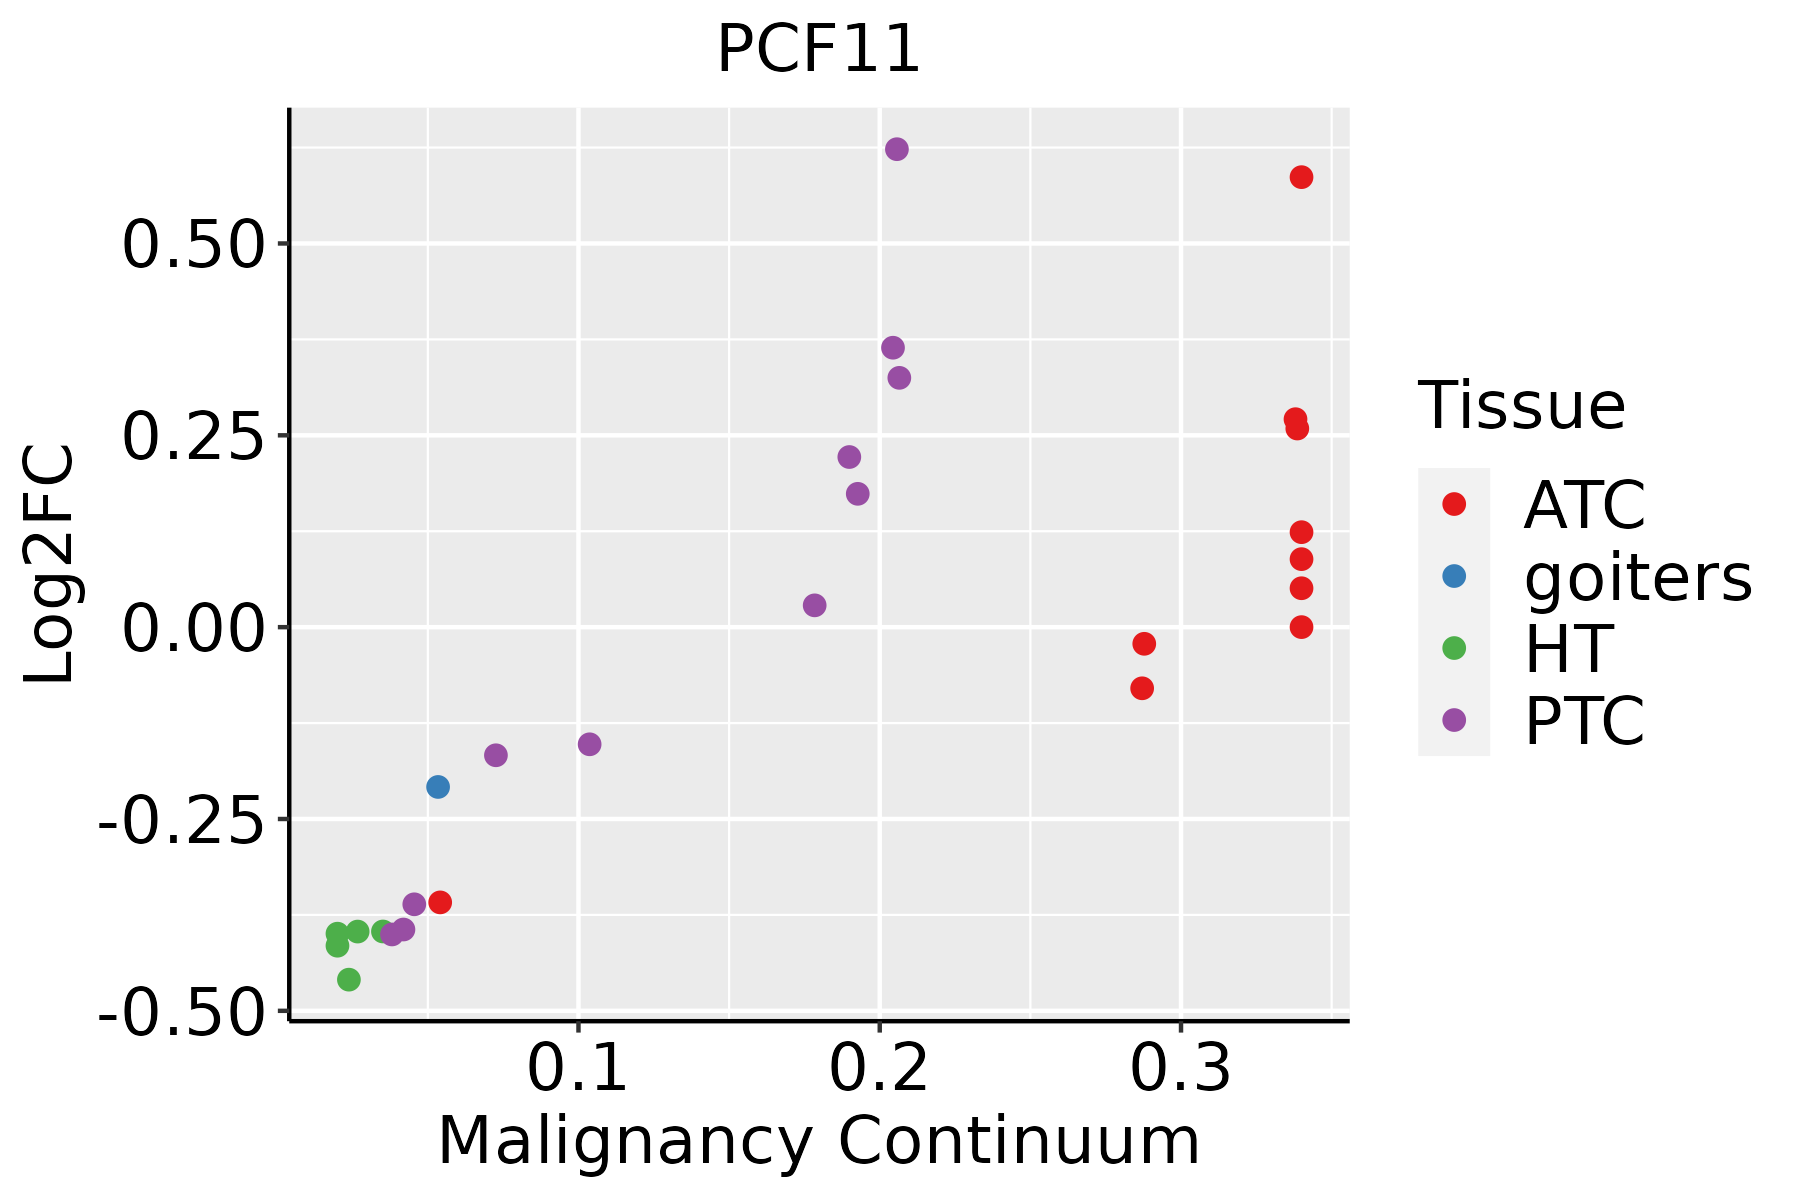 | ATC: Anaplastic thyroid cancer |
| HT: Hashimoto's thyroiditis | ||
| PTC: Papillary thyroid cancer |
| ∗log2FC in expression of this searched gene in stem-like cells from each diseased tissue sample relative to stem-like cells in normal samples in each tissue plotted against the malignancy continuum. Samples are colored based on if they are from different disease stage. |
Top |
Malignant transformation related pathway analysis |
| Find out the enriched GO biological processes and KEGG pathways involved in transition from healthy to precancer to cancer |
| Tissue | Disease Stage | Enriched GO biological Processes |
| Colorectum | AD |  |
| Colorectum | SER |  |
| Colorectum | MSS |  |
| Colorectum | MSI-H |  |
| Colorectum | FAP |  |
| ∗Top 15 enriched GO BP terms are showed in the bar plot of each disease state in each tissue. Each row represents a significant GO biological process which is colored according to the -log10(p.adjust). |
| Page: 1 2 3 4 5 6 7 8 9 |
| GO ID | Tissue | Disease Stage | Description | Gene Ratio | Bg Ratio | pvalue | p.adjust | Count |
| GO:00905013 | Esophagus | ESCC | RNA phosphodiester bond hydrolysis | 110/8552 | 152/18723 | 1.95e-11 | 6.81e-10 | 110 |
| GO:00903053 | Esophagus | ESCC | nucleic acid phosphodiester bond hydrolysis | 163/8552 | 261/18723 | 3.07e-08 | 5.73e-07 | 163 |
| GO:003112412 | Esophagus | ESCC | mRNA 3'-end processing | 47/8552 | 62/18723 | 1.29e-06 | 1.58e-05 | 47 |
| GO:00311233 | Esophagus | ESCC | RNA 3'-end processing | 76/8552 | 116/18723 | 1.25e-05 | 1.15e-04 | 76 |
| GO:00063783 | Esophagus | ESCC | mRNA polyadenylation | 33/8552 | 44/18723 | 7.30e-05 | 5.49e-04 | 33 |
| GO:00436313 | Esophagus | ESCC | RNA polyadenylation | 33/8552 | 45/18723 | 1.54e-04 | 1.02e-03 | 33 |
| GO:00063793 | Esophagus | ESCC | mRNA cleavage | 17/8552 | 22/18723 | 2.60e-03 | 1.11e-02 | 17 |
| GO:00063532 | Esophagus | ESCC | DNA-templated transcription, termination | 15/8552 | 21/18723 | 1.54e-02 | 4.96e-02 | 15 |
| GO:00311242 | Oral cavity | OSCC | mRNA 3'-end processing | 49/7305 | 62/18723 | 1.40e-10 | 4.14e-09 | 49 |
| GO:00905012 | Oral cavity | OSCC | RNA phosphodiester bond hydrolysis | 95/7305 | 152/18723 | 3.65e-09 | 8.22e-08 | 95 |
| GO:00311232 | Oral cavity | OSCC | RNA 3'-end processing | 75/7305 | 116/18723 | 1.93e-08 | 3.79e-07 | 75 |
| GO:00063782 | Oral cavity | OSCC | mRNA polyadenylation | 34/7305 | 44/18723 | 2.63e-07 | 4.10e-06 | 34 |
| GO:00903052 | Oral cavity | OSCC | nucleic acid phosphodiester bond hydrolysis | 142/7305 | 261/18723 | 2.90e-07 | 4.43e-06 | 142 |
| GO:00436312 | Oral cavity | OSCC | RNA polyadenylation | 34/7305 | 45/18723 | 6.73e-07 | 9.53e-06 | 34 |
| GO:00063792 | Oral cavity | OSCC | mRNA cleavage | 18/7305 | 22/18723 | 5.05e-05 | 4.23e-04 | 18 |
| GO:0006353 | Prostate | BPH | DNA-templated transcription, termination | 9/3107 | 21/18723 | 4.10e-03 | 2.03e-02 | 9 |
| GO:00063781 | Prostate | BPH | mRNA polyadenylation | 14/3107 | 44/18723 | 9.52e-03 | 4.03e-02 | 14 |
| GO:00436311 | Prostate | BPH | RNA polyadenylation | 14/3107 | 45/18723 | 1.18e-02 | 4.76e-02 | 14 |
| GO:00063531 | Prostate | Tumor | DNA-templated transcription, termination | 9/3246 | 21/18723 | 5.54e-03 | 2.61e-02 | 9 |
| GO:00311234 | Skin | cSCC | RNA 3'-end processing | 58/4864 | 116/18723 | 2.47e-08 | 6.89e-07 | 58 |
| Page: 1 2 |
| Pathway ID | Tissue | Disease Stage | Description | Gene Ratio | Bg Ratio | pvalue | p.adjust | qvalue | Count |
| hsa0301524 | Esophagus | ESCC | mRNA surveillance pathway | 72/4205 | 97/8465 | 6.12e-07 | 4.10e-06 | 2.10e-06 | 72 |
| hsa0301534 | Esophagus | ESCC | mRNA surveillance pathway | 72/4205 | 97/8465 | 6.12e-07 | 4.10e-06 | 2.10e-06 | 72 |
| hsa030158 | Oral cavity | OSCC | mRNA surveillance pathway | 75/3704 | 97/8465 | 1.30e-11 | 2.01e-10 | 1.02e-10 | 75 |
| hsa0301513 | Oral cavity | OSCC | mRNA surveillance pathway | 75/3704 | 97/8465 | 1.30e-11 | 2.01e-10 | 1.02e-10 | 75 |
| hsa030155 | Prostate | BPH | mRNA surveillance pathway | 32/1718 | 97/8465 | 2.20e-03 | 8.63e-03 | 5.34e-03 | 32 |
| hsa0301512 | Prostate | BPH | mRNA surveillance pathway | 32/1718 | 97/8465 | 2.20e-03 | 8.63e-03 | 5.34e-03 | 32 |
| hsa0301522 | Prostate | Tumor | mRNA surveillance pathway | 33/1791 | 97/8465 | 2.18e-03 | 8.60e-03 | 5.33e-03 | 33 |
| hsa0301532 | Prostate | Tumor | mRNA surveillance pathway | 33/1791 | 97/8465 | 2.18e-03 | 8.60e-03 | 5.33e-03 | 33 |
| Page: 1 |
Top |
Cell-cell communication analysis |
| Identification of potential cell-cell interactions between two cell types and their ligand-receptor pairs for different disease states |
| Ligand | Receptor | LRpair | Pathway | Tissue | Disease Stage |
| Page: 1 |
Top |
Single-cell gene regulatory network inference analysis |
| Find out the significant the regulons (TFs) and the target genes of each regulon across cell types for different disease states |
| TF | Cell Type | Tissue | Disease Stage | Target Gene | RSS | Regulon Activity |
| ∗The dot plots of a searched regulon are shown for all cell subpopulations in each disease state of each tissue based on the regulon specific score inferred using pySCENIC and by calculating the average expression. |
| Page: 1 |
Top |
Somatic mutation of malignant transformation related genes |
| Annotation of somatic variants for genes involved in malignant transformation |
| Hugo Symbol | Variant Class | Variant Classification | dbSNP RS | HGVSc | HGVSp | HGVSp Short | SWISSPROT | BIOTYPE | SIFT | PolyPhen | Tumor Sample Barcode | Tissue | Histology | Sex | Age | Stage | Therapy Types | Drugs | Outcome |
| PCF11 | SNV | Missense_Mutation | c.712N>T | p.Leu238Phe | p.L238F | O94913 | protein_coding | tolerated(0.36) | probably_damaging(0.994) | TCGA-A2-A0EY-01 | Breast | breast invasive carcinoma | Female | <65 | I/II | Chemotherapy | adriamycin | SD | |
| PCF11 | SNV | Missense_Mutation | c.3118N>C | p.Asp1040His | p.D1040H | O94913 | protein_coding | deleterious(0) | benign(0.224) | TCGA-A2-A0EY-01 | Breast | breast invasive carcinoma | Female | <65 | I/II | Chemotherapy | adriamycin | SD | |
| PCF11 | SNV | Missense_Mutation | c.1382C>G | p.Thr461Arg | p.T461R | O94913 | protein_coding | tolerated(0.13) | benign(0.069) | TCGA-A8-A076-01 | Breast | breast invasive carcinoma | Female | >=65 | I/II | Hormone Therapy | anastrozole | SD | |
| PCF11 | SNV | Missense_Mutation | c.1571C>T | p.Ser524Phe | p.S524F | O94913 | protein_coding | tolerated(0.18) | benign(0.212) | TCGA-A8-A0A7-01 | Breast | breast invasive carcinoma | Female | <65 | I/II | Unknown | Unknown | SD | |
| PCF11 | SNV | Missense_Mutation | c.712C>G | p.Leu238Val | p.L238V | O94913 | protein_coding | tolerated(0.2) | probably_damaging(0.978) | TCGA-AC-A2B8-01 | Breast | breast invasive carcinoma | Female | >=65 | I/II | Chemotherapy | chemo | PD | |
| PCF11 | SNV | Missense_Mutation | c.4539N>T | p.Glu1513Asp | p.E1513D | O94913 | protein_coding | deleterious(0.02) | probably_damaging(0.956) | TCGA-D8-A1XQ-01 | Breast | breast invasive carcinoma | Female | >=65 | I/II | Unknown | Unknown | SD | |
| PCF11 | SNV | Missense_Mutation | novel | c.2291G>A | p.Gly764Asp | p.G764D | O94913 | protein_coding | deleterious(0.04) | probably_damaging(0.998) | TCGA-EA-A410-01 | Cervix | cervical & endocervical cancer | Female | <65 | I/II | Unknown | Unknown | SD |
| PCF11 | SNV | Missense_Mutation | c.1756G>A | p.Glu586Lys | p.E586K | O94913 | protein_coding | tolerated(0.13) | benign(0.129) | TCGA-EK-A2RJ-01 | Cervix | cervical & endocervical cancer | Female | <65 | I/II | Unknown | Unknown | SD | |
| PCF11 | SNV | Missense_Mutation | c.1571C>G | p.Ser524Cys | p.S524C | O94913 | protein_coding | tolerated(0.13) | possibly_damaging(0.527) | TCGA-VS-A950-01 | Cervix | cervical & endocervical cancer | Female | <65 | III/IV | Unknown | Unknown | SD | |
| PCF11 | insertion | Frame_Shift_Ins | novel | c.4613_4614insTT | p.Ile1539SerfsTer2 | p.I1539Sfs*2 | O94913 | protein_coding | TCGA-DS-A1OB-01 | Cervix | cervical & endocervical cancer | Female | <65 | I/II | Chemotherapy | carboplatin | PD |
| Page: 1 2 3 4 5 6 7 8 9 10 11 12 13 14 15 16 |
Top |
Related drugs of malignant transformation related genes |
| Identification of chemicals and drugs interact with genes involved in malignant transfromation |
| (DGIdb 4.0) |
| Entrez ID | Symbol | Category | Interaction Types | Drug Claim Name | Drug Name | PMIDs |
| Page: 1 |

Copyright 2023-Present -The University of Texas Health Science Center at Houston |