
|
|||||
|
 | |
| |
| |
| |
| |
| |
|
Gene: PCED1B |
Gene summary for PCED1B |
| Gene information | Species | Human | Gene symbol | PCED1B | Gene ID | 91523 |
| Gene name | PC-esterase domain containing 1B | |
| Gene Alias | FAM113B | |
| Cytomap | 12q13.11 | |
| Gene Type | protein-coding | GO ID | GO:0003674 | UniProtAcc | A0A024R115 |
Top |
Malignant transformation analysis |
| Identification of the aberrant gene expression in precancerous and cancerous lesions by comparing the gene expression of stem-like cells in diseased tissues with normal stem cells |
| Entrez ID | Symbol | Replicates | Species | Organ | Tissue | Adj P-value | Log2FC | Malignancy |
| 91523 | PCED1B | CCI_1 | Human | Cervix | CC | 2.19e-05 | 5.13e-01 | 0.528 |
| 91523 | PCED1B | CCI_2 | Human | Cervix | CC | 2.26e-04 | 7.15e-01 | 0.5249 |
| 91523 | PCED1B | HTA11_1938_2000001011 | Human | Colorectum | AD | 2.42e-06 | 3.91e-01 | -0.0811 |
| 91523 | PCED1B | HTA11_78_2000001011 | Human | Colorectum | AD | 2.04e-14 | 5.56e-01 | -0.1088 |
| 91523 | PCED1B | HTA11_866_2000001011 | Human | Colorectum | AD | 1.89e-04 | 2.93e-01 | -0.1001 |
| 91523 | PCED1B | HTA11_6818_2000001021 | Human | Colorectum | AD | 6.97e-18 | 6.94e-01 | 0.0588 |
| 91523 | PCED1B | HTA11_99999965104_69814 | Human | Colorectum | MSS | 6.30e-09 | 4.61e-01 | 0.281 |
| 91523 | PCED1B | HTA11_99999973899_84307 | Human | Colorectum | MSS | 7.82e-03 | 1.73e-01 | 0.2585 |
| 91523 | PCED1B | HTA11_99999974143_84620 | Human | Colorectum | MSS | 7.38e-13 | 3.83e-01 | 0.3005 |
| 91523 | PCED1B | CRC-1-8810 | Human | Colorectum | CRC | 1.39e-13 | 4.90e-01 | 0.6257 |
| 91523 | PCED1B | RNA-P17T-P17T-4 | Human | Lung | IAC | 3.43e-02 | 5.35e-01 | 0.343 |
| 91523 | PCED1B | RNA-P17T-P17T-8 | Human | Lung | IAC | 4.11e-02 | 3.30e-01 | 0.3329 |
| 91523 | PCED1B | RNA-P3T-P3T-1 | Human | Lung | IAC | 1.02e-04 | 5.47e-01 | 0.1829 |
| 91523 | PCED1B | RNA-P3T-P3T-2 | Human | Lung | IAC | 1.95e-04 | 5.11e-01 | 0.1835 |
| 91523 | PCED1B | RNA-P3T-P3T-4 | Human | Lung | IAC | 5.97e-07 | 6.00e-01 | 0.1859 |
| 91523 | PCED1B | RNA-P6T1-P6T1-2 | Human | Lung | MIAC | 3.27e-04 | 9.05e-01 | -0.0186 |
| 91523 | PCED1B | RNA-P6T1-P6T1-4 | Human | Lung | MIAC | 1.56e-05 | 8.74e-01 | -0.0263 |
| 91523 | PCED1B | RNA-P6T2-P6T2-1 | Human | Lung | IAC | 8.04e-18 | 6.19e-01 | -0.0166 |
| 91523 | PCED1B | RNA-P6T2-P6T2-2 | Human | Lung | IAC | 1.76e-19 | 5.96e-01 | -0.0132 |
| 91523 | PCED1B | RNA-P6T2-P6T2-3 | Human | Lung | IAC | 9.23e-21 | 6.08e-01 | -0.013 |
| Page: 1 2 |
| Tissue | Expression Dynamics | Abbreviation |
| Cervix |  | CC: Cervix cancer |
| HSIL_HPV: HPV-infected high-grade squamous intraepithelial lesions | ||
| N_HPV: HPV-infected normal cervix | ||
| Colorectum (GSE201348) |  | FAP: Familial adenomatous polyposis |
| CRC: Colorectal cancer | ||
| Colorectum (HTA11) |  | AD: Adenomas |
| SER: Sessile serrated lesions | ||
| MSI-H: Microsatellite-high colorectal cancer | ||
| MSS: Microsatellite stable colorectal cancer | ||
| Lung | 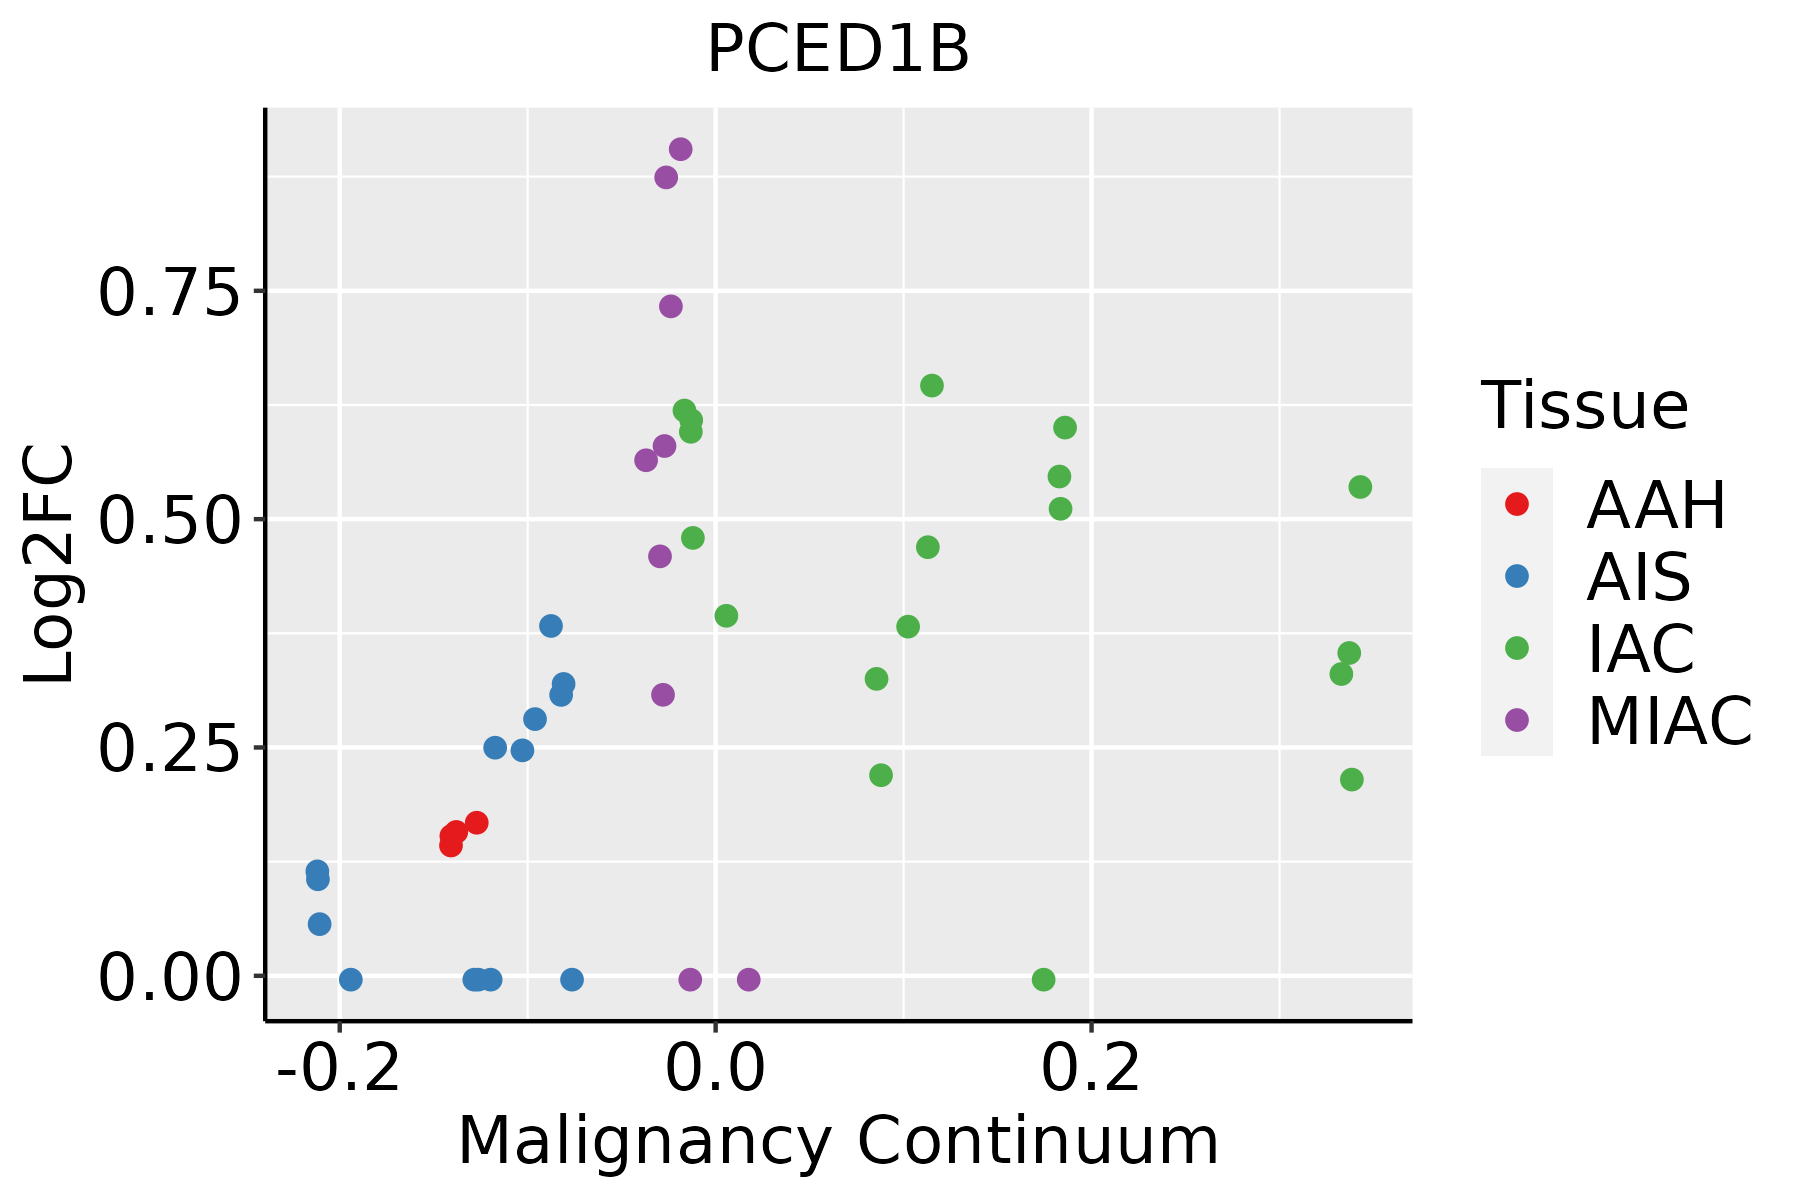 | AAH: Atypical adenomatous hyperplasia |
| AIS: Adenocarcinoma in situ | ||
| IAC: Invasive lung adenocarcinoma | ||
| MIA: Minimally invasive adenocarcinoma |
| ∗log2FC in expression of this searched gene in stem-like cells from each diseased tissue sample relative to stem-like cells in normal samples in each tissue plotted against the malignancy continuum. Samples are colored based on if they are from different disease stage. |
Top |
Malignant transformation related pathway analysis |
| Find out the enriched GO biological processes and KEGG pathways involved in transition from healthy to precancer to cancer |
| Tissue | Disease Stage | Enriched GO biological Processes |
| Colorectum | AD |  |
| Colorectum | SER |  |
| Colorectum | MSS |  |
| Colorectum | MSI-H |  |
| Colorectum | FAP |  |
| ∗Top 15 enriched GO BP terms are showed in the bar plot of each disease state in each tissue. Each row represents a significant GO biological process which is colored according to the -log10(p.adjust). |
| Page: 1 2 3 4 5 6 7 8 9 |
| GO ID | Tissue | Disease Stage | Description | Gene Ratio | Bg Ratio | pvalue | p.adjust | Count |
| Page: 1 |
| Pathway ID | Tissue | Disease Stage | Description | Gene Ratio | Bg Ratio | pvalue | p.adjust | qvalue | Count |
| Page: 1 |
Top |
Cell-cell communication analysis |
| Identification of potential cell-cell interactions between two cell types and their ligand-receptor pairs for different disease states |
| Ligand | Receptor | LRpair | Pathway | Tissue | Disease Stage |
| Page: 1 |
Top |
Single-cell gene regulatory network inference analysis |
| Find out the significant the regulons (TFs) and the target genes of each regulon across cell types for different disease states |
| TF | Cell Type | Tissue | Disease Stage | Target Gene | RSS | Regulon Activity |
| ∗The dot plots of a searched regulon are shown for all cell subpopulations in each disease state of each tissue based on the regulon specific score inferred using pySCENIC and by calculating the average expression. |
| Page: 1 |
Top |
Somatic mutation of malignant transformation related genes |
| Annotation of somatic variants for genes involved in malignant transformation |
| Hugo Symbol | Variant Class | Variant Classification | dbSNP RS | HGVSc | HGVSp | HGVSp Short | SWISSPROT | BIOTYPE | SIFT | PolyPhen | Tumor Sample Barcode | Tissue | Histology | Sex | Age | Stage | Therapy Types | Drugs | Outcome |
| PCED1B | SNV | Missense_Mutation | novel | c.284N>A | p.Thr95Asn | p.T95N | Q96HM7 | protein_coding | deleterious(0) | probably_damaging(1) | TCGA-A8-A08H-01 | Breast | breast invasive carcinoma | Female | >=65 | I/II | Unknown | Unknown | SD |
| PCED1B | SNV | Missense_Mutation | c.770N>T | p.Pro257Leu | p.P257L | Q96HM7 | protein_coding | deleterious(0) | probably_damaging(0.995) | TCGA-A8-A09Z-01 | Breast | breast invasive carcinoma | Female | >=65 | I/II | Unknown | Unknown | SD | |
| PCED1B | SNV | Missense_Mutation | rs267603480 | c.1108N>A | p.Glu370Lys | p.E370K | Q96HM7 | protein_coding | tolerated(0.08) | benign(0.033) | TCGA-AN-A046-01 | Breast | breast invasive carcinoma | Female | >=65 | I/II | Unknown | Unknown | SD |
| PCED1B | SNV | Missense_Mutation | rs770009860 | c.1229N>T | p.Thr410Met | p.T410M | Q96HM7 | protein_coding | tolerated(0.15) | benign(0) | TCGA-AN-A0FY-01 | Breast | breast invasive carcinoma | Female | <65 | I/II | Unknown | Unknown | SD |
| PCED1B | SNV | Missense_Mutation | c.902N>A | p.Pro301His | p.P301H | Q96HM7 | protein_coding | tolerated(0.11) | possibly_damaging(0.525) | TCGA-B6-A0IJ-01 | Breast | breast invasive carcinoma | Female | <65 | I/II | Unknown | Unknown | SD | |
| PCED1B | SNV | Missense_Mutation | c.1117N>A | p.Phe373Ile | p.F373I | Q96HM7 | protein_coding | deleterious(0.01) | possibly_damaging(0.497) | TCGA-B6-A0RO-01 | Breast | breast invasive carcinoma | Female | >=65 | III/IV | Unknown | Unknown | SD | |
| PCED1B | SNV | Missense_Mutation | rs776179854 | c.826N>A | p.Glu276Lys | p.E276K | Q96HM7 | protein_coding | tolerated(0.22) | benign(0.001) | TCGA-B6-A0RU-01 | Breast | breast invasive carcinoma | Female | <65 | I/II | Unknown | Unknown | PD |
| PCED1B | SNV | Missense_Mutation | novel | c.1126N>T | p.Gly376Cys | p.G376C | Q96HM7 | protein_coding | deleterious(0.01) | benign(0.007) | TCGA-EW-A3U0-01 | Breast | breast invasive carcinoma | Female | <65 | III/IV | Chemotherapy | cisplatin | CR |
| PCED1B | SNV | Missense_Mutation | novel | c.748G>A | p.Asp250Asn | p.D250N | Q96HM7 | protein_coding | deleterious(0.03) | benign(0.298) | TCGA-PE-A5DE-01 | Breast | breast invasive carcinoma | Female | <65 | I/II | Chemotherapy | taxotere | CR |
| PCED1B | insertion | Nonsense_Mutation | novel | c.286_287insATAATTTTATTTTATGAAGATATGTTTTTACATATTTCCTTTCAAT | p.Arg96HisfsTer6 | p.R96Hfs*6 | Q96HM7 | protein_coding | TCGA-A8-A08H-01 | Breast | breast invasive carcinoma | Female | >=65 | I/II | Unknown | Unknown | SD |
| Page: 1 2 3 4 5 6 7 8 |
Top |
Related drugs of malignant transformation related genes |
| Identification of chemicals and drugs interact with genes involved in malignant transfromation |
| (DGIdb 4.0) |
| Entrez ID | Symbol | Category | Interaction Types | Drug Claim Name | Drug Name | PMIDs |
| Page: 1 |

Copyright 2023-Present -The University of Texas Health Science Center at Houston |