
|
|||||
|
 | |
| |
| |
| |
| |
| |
|
Gene: PCDHB2 |
Gene summary for PCDHB2 |
| Gene information | Species | Human | Gene symbol | PCDHB2 | Gene ID | 56133 |
| Gene name | protocadherin beta 2 | |
| Gene Alias | PCDH-BETA2 | |
| Cytomap | 5q31.3 | |
| Gene Type | protein-coding | GO ID | GO:0007154 | UniProtAcc | Q4KMG6 |
Top |
Malignant transformation analysis |
| Identification of the aberrant gene expression in precancerous and cancerous lesions by comparing the gene expression of stem-like cells in diseased tissues with normal stem cells |
| Entrez ID | Symbol | Replicates | Species | Organ | Tissue | Adj P-value | Log2FC | Malignancy |
| 56133 | PCDHB2 | male-WTA | Human | Thyroid | PTC | 4.82e-02 | 4.69e-02 | 0.1037 |
| 56133 | PCDHB2 | PTC06 | Human | Thyroid | PTC | 1.69e-04 | 1.69e-01 | 0.2057 |
| 56133 | PCDHB2 | PTC07 | Human | Thyroid | PTC | 1.12e-09 | 1.73e-01 | 0.2044 |
| 56133 | PCDHB2 | ATC09 | Human | Thyroid | ATC | 2.26e-06 | 2.24e-01 | 0.2871 |
| 56133 | PCDHB2 | ATC11 | Human | Thyroid | ATC | 7.49e-03 | 3.98e-01 | 0.3386 |
| 56133 | PCDHB2 | ATC1 | Human | Thyroid | ATC | 1.52e-06 | 2.46e-01 | 0.2878 |
| 56133 | PCDHB2 | ATC2 | Human | Thyroid | ATC | 9.94e-09 | 7.41e-01 | 0.34 |
| 56133 | PCDHB2 | ATC3 | Human | Thyroid | ATC | 6.48e-06 | 3.93e-01 | 0.338 |
| Page: 1 |
| Tissue | Expression Dynamics | Abbreviation |
| Thyroid | 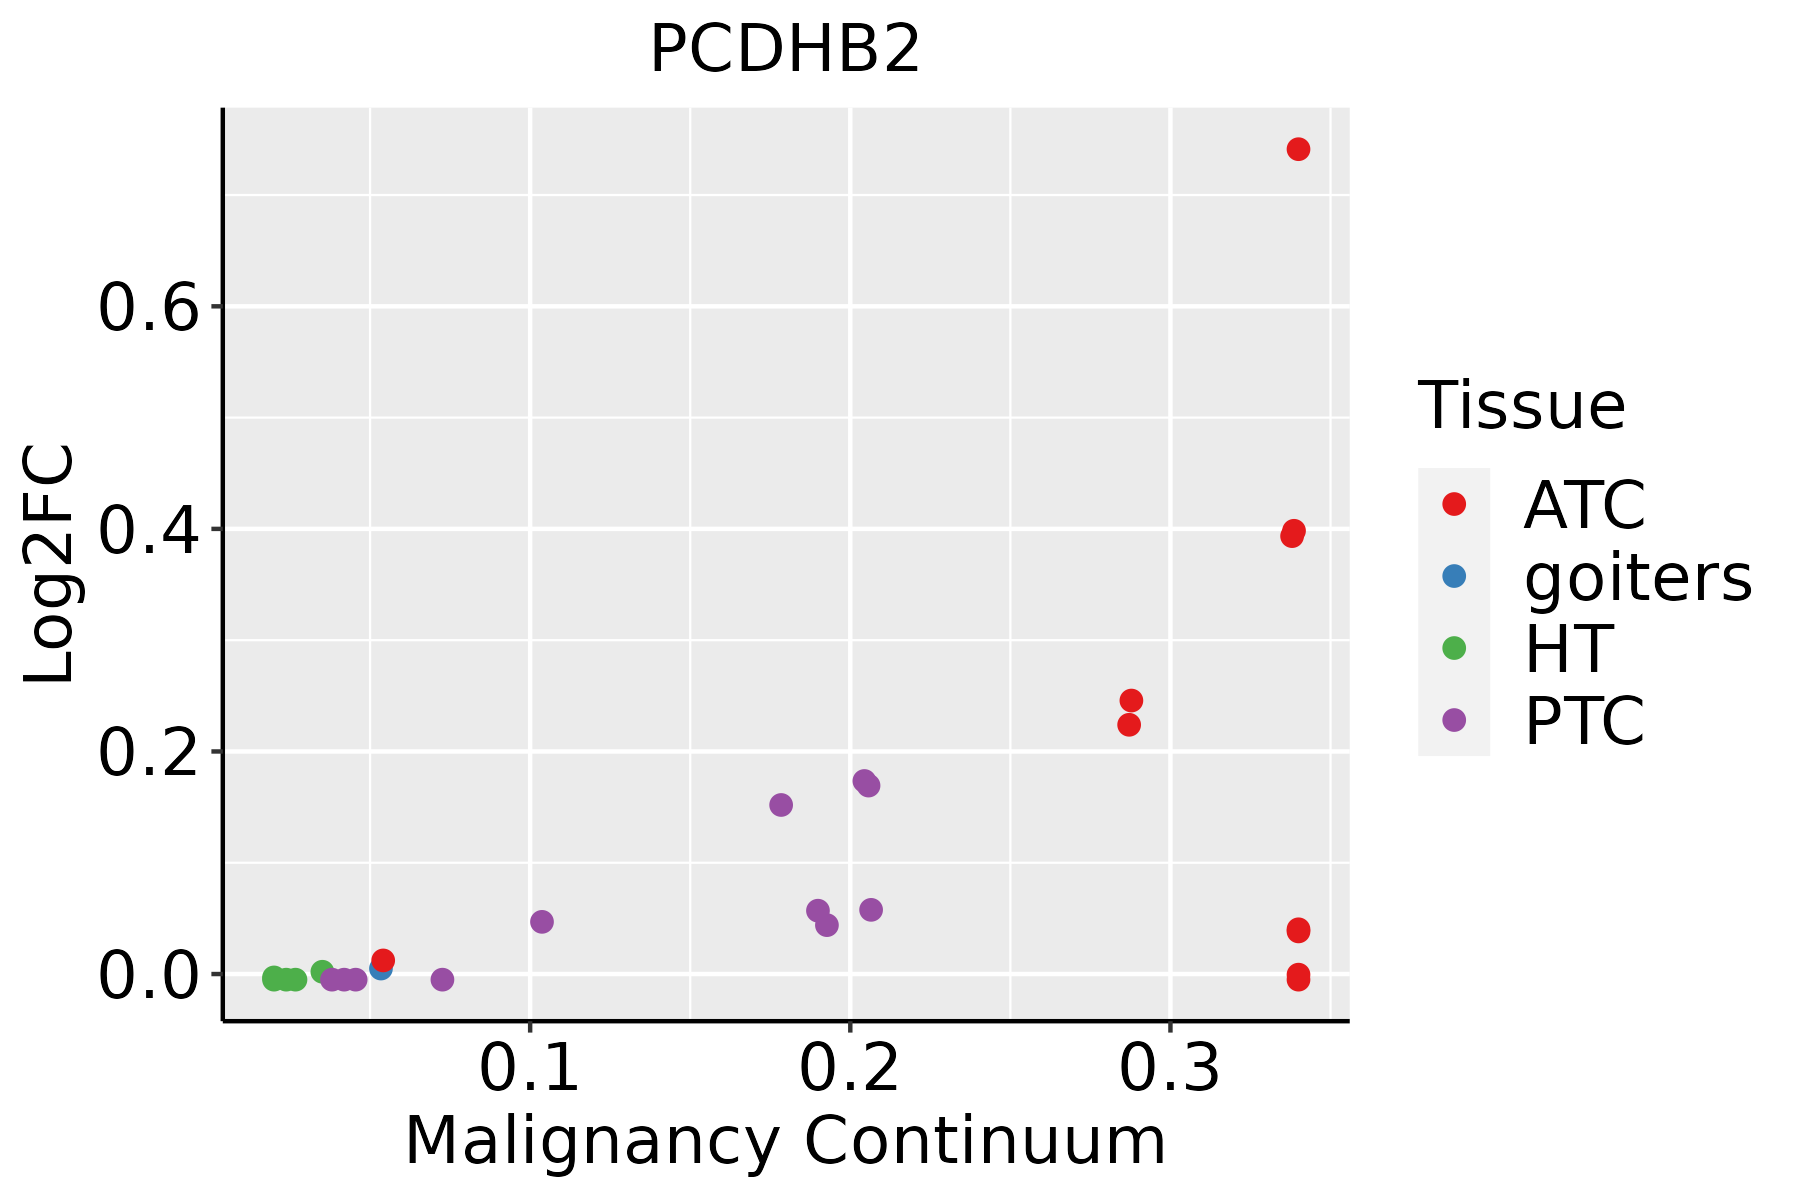 | ATC: Anaplastic thyroid cancer |
| HT: Hashimoto's thyroiditis | ||
| PTC: Papillary thyroid cancer |
| ∗log2FC in expression of this searched gene in stem-like cells from each diseased tissue sample relative to stem-like cells in normal samples in each tissue plotted against the malignancy continuum. Samples are colored based on if they are from different disease stage. |
Top |
Malignant transformation related pathway analysis |
| Find out the enriched GO biological processes and KEGG pathways involved in transition from healthy to precancer to cancer |
| Tissue | Disease Stage | Enriched GO biological Processes |
| Colorectum | AD |  |
| Colorectum | SER |  |
| Colorectum | MSS |  |
| Colorectum | MSI-H |  |
| Colorectum | FAP |  |
| ∗Top 15 enriched GO BP terms are showed in the bar plot of each disease state in each tissue. Each row represents a significant GO biological process which is colored according to the -log10(p.adjust). |
| Page: 1 2 3 4 5 6 7 8 9 |
| GO ID | Tissue | Disease Stage | Description | Gene Ratio | Bg Ratio | pvalue | p.adjust | Count |
| GO:0034329111 | Thyroid | PTC | cell junction assembly | 180/5968 | 420/18723 | 1.17e-06 | 1.69e-05 | 180 |
| GO:00508089 | Thyroid | PTC | synapse organization | 161/5968 | 426/18723 | 5.11e-03 | 2.36e-02 | 161 |
| GO:003432924 | Thyroid | ATC | cell junction assembly | 187/6293 | 420/18723 | 1.71e-06 | 2.08e-05 | 187 |
| Page: 1 |
| Pathway ID | Tissue | Disease Stage | Description | Gene Ratio | Bg Ratio | pvalue | p.adjust | qvalue | Count |
| Page: 1 |
Top |
Cell-cell communication analysis |
| Identification of potential cell-cell interactions between two cell types and their ligand-receptor pairs for different disease states |
| Ligand | Receptor | LRpair | Pathway | Tissue | Disease Stage |
| Page: 1 |
Top |
Single-cell gene regulatory network inference analysis |
| Find out the significant the regulons (TFs) and the target genes of each regulon across cell types for different disease states |
| TF | Cell Type | Tissue | Disease Stage | Target Gene | RSS | Regulon Activity |
| ∗The dot plots of a searched regulon are shown for all cell subpopulations in each disease state of each tissue based on the regulon specific score inferred using pySCENIC and by calculating the average expression. |
| Page: 1 |
Top |
Somatic mutation of malignant transformation related genes |
| Annotation of somatic variants for genes involved in malignant transformation |
| Hugo Symbol | Variant Class | Variant Classification | dbSNP RS | HGVSc | HGVSp | HGVSp Short | SWISSPROT | BIOTYPE | SIFT | PolyPhen | Tumor Sample Barcode | Tissue | Histology | Sex | Age | Stage | Therapy Types | Drugs | Outcome |
| PCDHB2 | SNV | Missense_Mutation | novel | c.715N>A | p.Asp239Asn | p.D239N | Q9Y5E7 | protein_coding | deleterious_low_confidence(0) | probably_damaging(0.991) | TCGA-5L-AAT1-01 | Breast | breast invasive carcinoma | Female | <65 | III/IV | Hormone Therapy | letrozol | SD |
| PCDHB2 | SNV | Missense_Mutation | c.370N>T | p.Arg124Trp | p.R124W | Q9Y5E7 | protein_coding | tolerated_low_confidence(0.19) | benign(0.001) | TCGA-A2-A4S2-01 | Breast | breast invasive carcinoma | Female | <65 | III/IV | Chemotherapy | adriamycin | CR | |
| PCDHB2 | SNV | Missense_Mutation | rs782217826 | c.1252G>A | p.Glu418Lys | p.E418K | Q9Y5E7 | protein_coding | deleterious_low_confidence(0.03) | benign(0.192) | TCGA-AC-A5EH-01 | Breast | breast invasive carcinoma | Female | >=65 | I/II | Unknown | Unknown | SD |
| PCDHB2 | SNV | Missense_Mutation | c.512A>T | p.Asn171Ile | p.N171I | Q9Y5E7 | protein_coding | deleterious_low_confidence(0) | possibly_damaging(0.595) | TCGA-AN-A04D-01 | Breast | breast invasive carcinoma | Female | <65 | I/II | Unknown | Unknown | SD | |
| PCDHB2 | SNV | Missense_Mutation | rs531551073 | c.2386N>A | p.Glu796Lys | p.E796K | Q9Y5E7 | protein_coding | tolerated_low_confidence(0.35) | benign(0.028) | TCGA-AR-A2LE-01 | Breast | breast invasive carcinoma | Female | >=65 | I/II | Hormone Therapy | tamoxiphen | PD |
| PCDHB2 | SNV | Missense_Mutation | rs267600411 | c.2260N>A | p.Glu754Lys | p.E754K | Q9Y5E7 | protein_coding | deleterious_low_confidence(0.02) | benign(0.176) | TCGA-AR-A2LH-01 | Breast | breast invasive carcinoma | Female | <65 | III/IV | Chemotherapy | adriamycin | PD |
| PCDHB2 | SNV | Missense_Mutation | novel | c.433C>G | p.Pro145Ala | p.P145A | Q9Y5E7 | protein_coding | tolerated_low_confidence(0.08) | benign(0.091) | TCGA-BH-A2L8-01 | Breast | breast invasive carcinoma | Female | <65 | I/II | Chemotherapy | cytoxan | CR |
| PCDHB2 | SNV | Missense_Mutation | c.871N>T | p.Arg291Cys | p.R291C | Q9Y5E7 | protein_coding | tolerated_low_confidence(0.11) | benign(0.052) | TCGA-EW-A1IZ-01 | Breast | breast invasive carcinoma | Female | <65 | III/IV | Chemotherapy | taxotere | SD | |
| PCDHB2 | SNV | Missense_Mutation | novel | c.61G>T | p.Val21Phe | p.V21F | Q9Y5E7 | protein_coding | tolerated_low_confidence(0.24) | benign(0.013) | TCGA-LL-A7SZ-01 | Breast | breast invasive carcinoma | Female | <65 | I/II | Chemotherapy | adriamycin | CR |
| PCDHB2 | insertion | Frame_Shift_Ins | novel | c.983_984insAG | p.Leu329AlafsTer12 | p.L329Afs*12 | Q9Y5E7 | protein_coding | TCGA-AN-A0AS-01 | Breast | breast invasive carcinoma | Female | >=65 | III/IV | Unknown | Unknown | SD |
| Page: 1 2 3 4 5 6 7 8 9 10 11 12 13 14 15 16 17 18 19 |
Top |
Related drugs of malignant transformation related genes |
| Identification of chemicals and drugs interact with genes involved in malignant transfromation |
| (DGIdb 4.0) |
| Entrez ID | Symbol | Category | Interaction Types | Drug Claim Name | Drug Name | PMIDs |
| Page: 1 |

Copyright 2023-Present -The University of Texas Health Science Center at Houston |