
|
|||||
|
 | |
| |
| |
| |
| |
| |
|
Gene: PCDH9 |
Gene summary for PCDH9 |
| Gene information | Species | Human | Gene symbol | PCDH9 | Gene ID | 5101 |
| Gene name | protocadherin 9 | |
| Gene Alias | PCDH9 | |
| Cytomap | 13q21.32 | |
| Gene Type | protein-coding | GO ID | GO:0007155 | UniProtAcc | B7ZM79 |
Top |
Malignant transformation analysis |
| Identification of the aberrant gene expression in precancerous and cancerous lesions by comparing the gene expression of stem-like cells in diseased tissues with normal stem cells |
| Entrez ID | Symbol | Replicates | Species | Organ | Tissue | Adj P-value | Log2FC | Malignancy |
| 5101 | PCDH9 | HTA12-23-1 | Human | Pancreas | PDAC | 1.55e-03 | 9.10e-01 | 0.3405 |
| 5101 | PCDH9 | HTA12-29-1 | Human | Pancreas | PDAC | 1.10e-08 | 5.46e-01 | 0.3722 |
| 5101 | PCDH9 | male-WTA | Human | Thyroid | PTC | 8.05e-15 | 7.50e-02 | 0.1037 |
| 5101 | PCDH9 | PTC06 | Human | Thyroid | PTC | 5.27e-09 | 4.15e-01 | 0.2057 |
| 5101 | PCDH9 | PTC07 | Human | Thyroid | PTC | 3.25e-25 | 6.34e-01 | 0.2044 |
| 5101 | PCDH9 | ATC11 | Human | Thyroid | ATC | 4.59e-05 | 6.90e-01 | 0.3386 |
| 5101 | PCDH9 | ATC2 | Human | Thyroid | ATC | 2.83e-13 | 1.13e+00 | 0.34 |
| 5101 | PCDH9 | ATC3 | Human | Thyroid | ATC | 1.08e-11 | 8.83e-01 | 0.338 |
| 5101 | PCDH9 | ATC5 | Human | Thyroid | ATC | 8.59e-03 | -1.39e-02 | 0.34 |
| Page: 1 |
| Tissue | Expression Dynamics | Abbreviation |
| Thyroid | 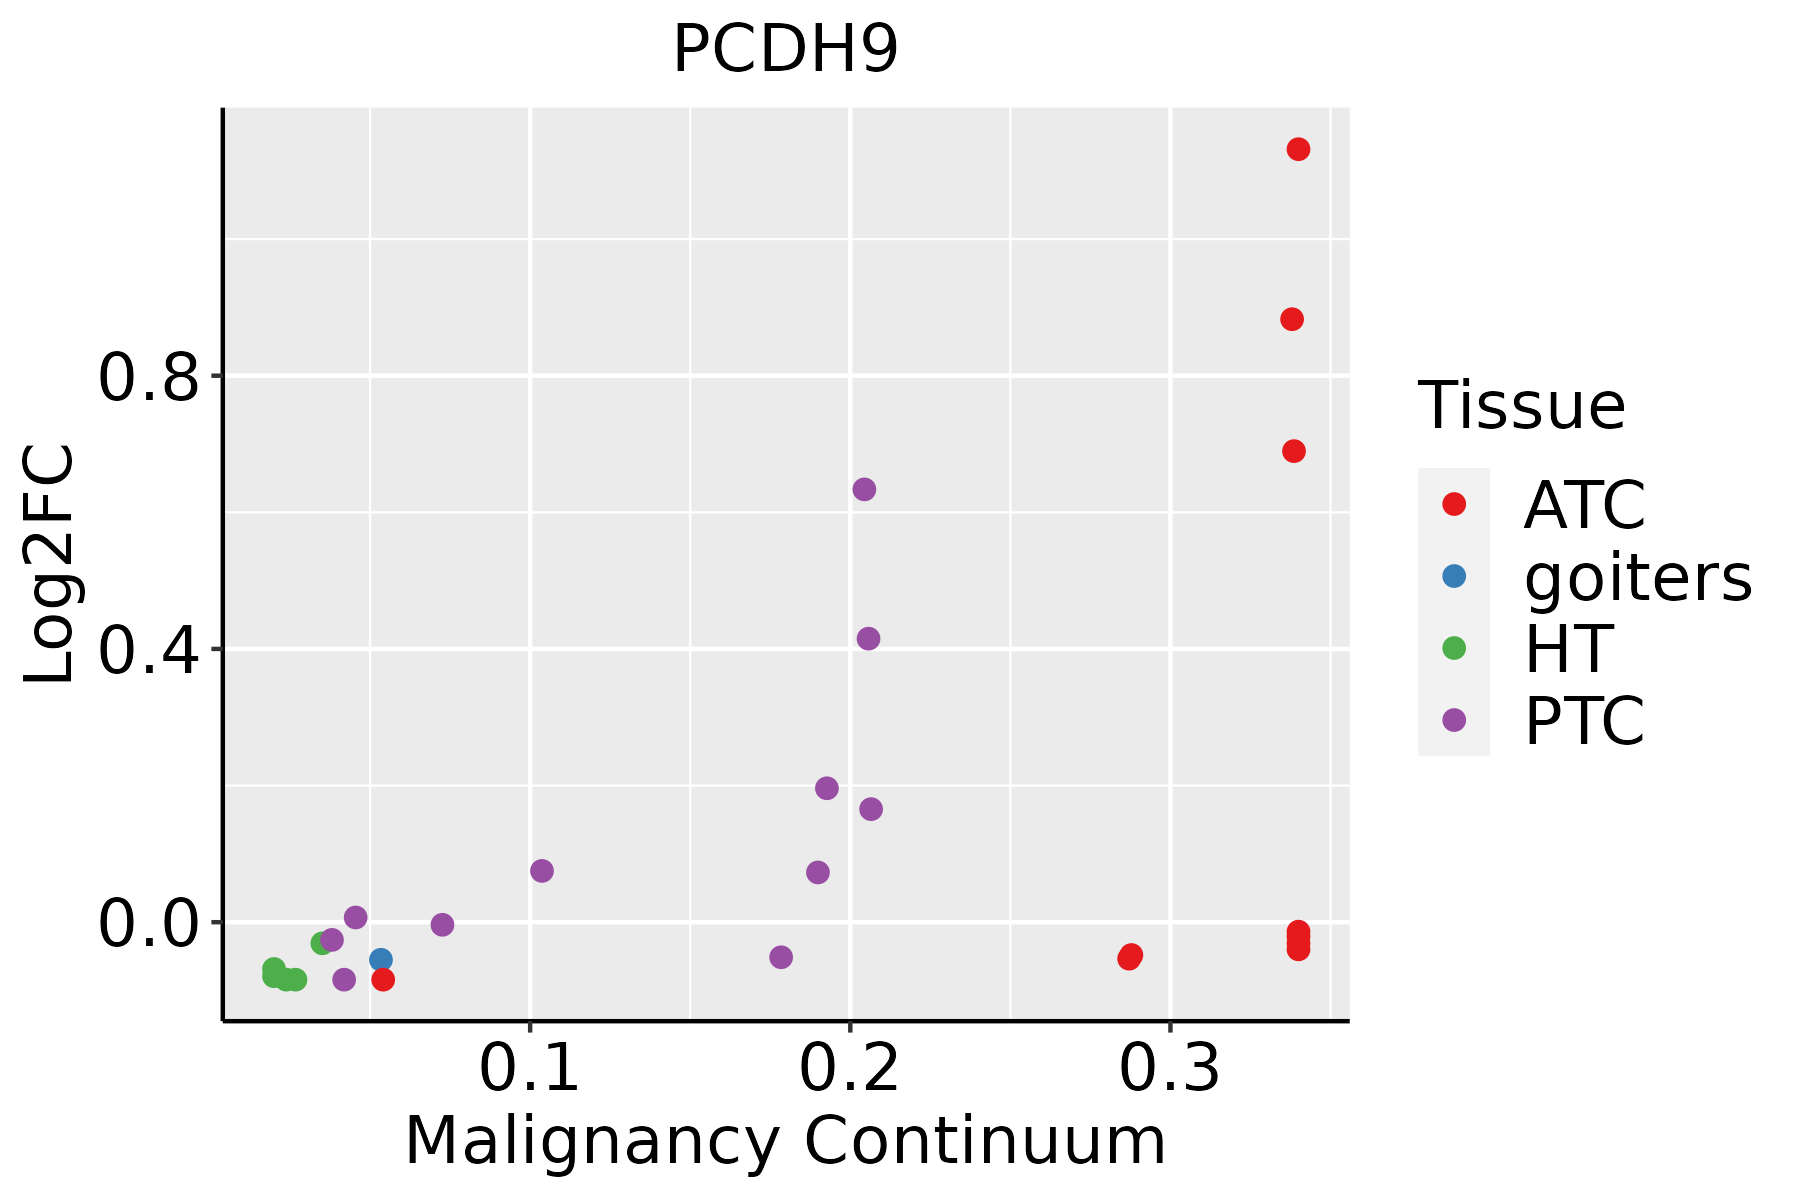 | ATC: Anaplastic thyroid cancer |
| HT: Hashimoto's thyroiditis | ||
| PTC: Papillary thyroid cancer |
| ∗log2FC in expression of this searched gene in stem-like cells from each diseased tissue sample relative to stem-like cells in normal samples in each tissue plotted against the malignancy continuum. Samples are colored based on if they are from different disease stage. |
Top |
Malignant transformation related pathway analysis |
| Find out the enriched GO biological processes and KEGG pathways involved in transition from healthy to precancer to cancer |
| Tissue | Disease Stage | Enriched GO biological Processes |
| Colorectum | AD |  |
| Colorectum | SER |  |
| Colorectum | MSS |  |
| Colorectum | MSI-H |  |
| Colorectum | FAP |  |
| ∗Top 15 enriched GO BP terms are showed in the bar plot of each disease state in each tissue. Each row represents a significant GO biological process which is colored according to the -log10(p.adjust). |
| Page: 1 2 3 4 5 6 7 8 9 |
| GO ID | Tissue | Disease Stage | Description | Gene Ratio | Bg Ratio | pvalue | p.adjust | Count |
| GO:00309007 | Thyroid | PTC | forebrain development | 143/5968 | 379/18723 | 8.47e-03 | 3.56e-02 | 143 |
| GO:003090015 | Thyroid | ATC | forebrain development | 164/6293 | 379/18723 | 4.85e-05 | 3.87e-04 | 164 |
| Page: 1 |
| Pathway ID | Tissue | Disease Stage | Description | Gene Ratio | Bg Ratio | pvalue | p.adjust | qvalue | Count |
| Page: 1 |
Top |
Cell-cell communication analysis |
| Identification of potential cell-cell interactions between two cell types and their ligand-receptor pairs for different disease states |
| Ligand | Receptor | LRpair | Pathway | Tissue | Disease Stage |
| Page: 1 |
Top |
Single-cell gene regulatory network inference analysis |
| Find out the significant the regulons (TFs) and the target genes of each regulon across cell types for different disease states |
| TF | Cell Type | Tissue | Disease Stage | Target Gene | RSS | Regulon Activity |
| ∗The dot plots of a searched regulon are shown for all cell subpopulations in each disease state of each tissue based on the regulon specific score inferred using pySCENIC and by calculating the average expression. |
| Page: 1 |
Top |
Somatic mutation of malignant transformation related genes |
| Annotation of somatic variants for genes involved in malignant transformation |
| Hugo Symbol | Variant Class | Variant Classification | dbSNP RS | HGVSc | HGVSp | HGVSp Short | SWISSPROT | BIOTYPE | SIFT | PolyPhen | Tumor Sample Barcode | Tissue | Histology | Sex | Age | Stage | Therapy Types | Drugs | Outcome |
| PCDH9 | SNV | Missense_Mutation | c.103C>G | p.Pro35Ala | p.P35A | Q9HC56 | protein_coding | deleterious(0) | possibly_damaging(0.816) | TCGA-A8-A07J-01 | Breast | breast invasive carcinoma | Female | <65 | I/II | Chemotherapy | 5-fluorouracil | CR | |
| PCDH9 | SNV | Missense_Mutation | c.3324C>A | p.Asn1108Lys | p.N1108K | Q9HC56 | protein_coding | tolerated(0.07) | probably_damaging(0.997) | TCGA-A8-A0AD-01 | Breast | breast invasive carcinoma | Female | >=65 | I/II | Hormone Therapy | tamoxiphen | SD | |
| PCDH9 | SNV | Missense_Mutation | novel | c.3293N>T | p.Ser1098Phe | p.S1098F | Q9HC56 | protein_coding | deleterious(0) | probably_damaging(0.931) | TCGA-AC-A5XS-01 | Breast | breast invasive carcinoma | Female | >=65 | I/II | Hormone Therapy | femara | SD |
| PCDH9 | SNV | Missense_Mutation | rs147427572 | c.2662N>A | p.Glu888Lys | p.E888K | Q9HC56 | protein_coding | tolerated(0.05) | probably_damaging(0.936) | TCGA-AN-A046-01 | Breast | breast invasive carcinoma | Female | >=65 | I/II | Unknown | Unknown | SD |
| PCDH9 | SNV | Missense_Mutation | novel | c.161N>T | p.Ala54Val | p.A54V | Q9HC56 | protein_coding | tolerated(0.28) | benign(0.216) | TCGA-AN-A046-01 | Breast | breast invasive carcinoma | Female | >=65 | I/II | Unknown | Unknown | SD |
| PCDH9 | SNV | Missense_Mutation | c.2731N>C | p.Glu911Gln | p.E911Q | Q9HC56 | protein_coding | deleterious(0.04) | probably_damaging(0.996) | TCGA-B6-A0WZ-01 | Breast | breast invasive carcinoma | Female | <65 | I/II | Unknown | Unknown | PD | |
| PCDH9 | SNV | Missense_Mutation | novel | c.3151G>T | p.Val1051Phe | p.V1051F | Q9HC56 | protein_coding | deleterious(0) | possibly_damaging(0.584) | TCGA-BH-A0B6-01 | Breast | breast invasive carcinoma | Female | <65 | I/II | Unknown | Unknown | SD |
| PCDH9 | SNV | Missense_Mutation | rs749305576 | c.1984N>C | p.Thr662Pro | p.T662P | Q9HC56 | protein_coding | deleterious(0) | probably_damaging(1) | TCGA-C8-A12O-01 | Breast | breast invasive carcinoma | Female | <65 | I/II | Unknown | Unknown | SD |
| PCDH9 | SNV | Missense_Mutation | novel | c.2249N>A | p.Arg750His | p.R750H | Q9HC56 | protein_coding | deleterious(0) | probably_damaging(0.993) | TCGA-C8-A1HI-01 | Breast | breast invasive carcinoma | Female | <65 | III/IV | Unknown | Unknown | SD |
| PCDH9 | SNV | Missense_Mutation | rs868294906 | c.61N>A | p.Ala21Thr | p.A21T | Q9HC56 | protein_coding | tolerated(0.1) | benign(0.006) | TCGA-D8-A27T-01 | Breast | breast invasive carcinoma | Female | <65 | III/IV | Chemotherapy | doxorubicine+cyclophosphamide | SD |
| Page: 1 2 3 4 5 6 7 8 9 10 11 12 13 14 15 16 17 18 19 20 21 22 23 24 25 26 27 28 |
Top |
Related drugs of malignant transformation related genes |
| Identification of chemicals and drugs interact with genes involved in malignant transfromation |
| (DGIdb 4.0) |
| Entrez ID | Symbol | Category | Interaction Types | Drug Claim Name | Drug Name | PMIDs |
| Page: 1 |

Copyright 2023-Present -The University of Texas Health Science Center at Houston |