
|
|||||
|
 | |
| |
| |
| |
| |
| |
|
Gene: PCDH1 |
Gene summary for PCDH1 |
| Gene information | Species | Human | Gene symbol | PCDH1 | Gene ID | 5097 |
| Gene name | protocadherin 1 | |
| Gene Alias | PC42 | |
| Cytomap | 5q31.3 | |
| Gene Type | protein-coding | GO ID | GO:0007154 | UniProtAcc | B4DUA8 |
Top |
Malignant transformation analysis |
| Identification of the aberrant gene expression in precancerous and cancerous lesions by comparing the gene expression of stem-like cells in diseased tissues with normal stem cells |
| Entrez ID | Symbol | Replicates | Species | Organ | Tissue | Adj P-value | Log2FC | Malignancy |
| 5097 | PCDH1 | HTA11_3410_2000001011 | Human | Colorectum | AD | 1.13e-05 | 8.33e-02 | 0.0155 |
| 5097 | PCDH1 | HTA11_1938_2000001011 | Human | Colorectum | AD | 1.39e-02 | 3.22e-01 | -0.0811 |
| 5097 | PCDH1 | HTA11_78_2000001011 | Human | Colorectum | AD | 1.02e-02 | 2.17e-01 | -0.1088 |
| 5097 | PCDH1 | HTA11_347_2000001011 | Human | Colorectum | AD | 1.00e-10 | 4.21e-01 | -0.1954 |
| 5097 | PCDH1 | HTA11_411_2000001011 | Human | Colorectum | SER | 1.31e-05 | 1.05e+00 | -0.2602 |
| 5097 | PCDH1 | HTA11_2112_2000001011 | Human | Colorectum | SER | 3.83e-04 | 6.72e-01 | -0.2196 |
| 5097 | PCDH1 | HTA11_83_2000001011 | Human | Colorectum | SER | 5.51e-08 | 4.38e-01 | -0.1526 |
| 5097 | PCDH1 | HTA11_696_2000001011 | Human | Colorectum | AD | 1.13e-11 | 3.40e-01 | -0.1464 |
| 5097 | PCDH1 | HTA11_866_2000001011 | Human | Colorectum | AD | 8.51e-07 | 2.68e-01 | -0.1001 |
| 5097 | PCDH1 | HTA11_866_3004761011 | Human | Colorectum | AD | 6.06e-04 | 2.62e-01 | 0.096 |
| 5097 | PCDH1 | HTA11_10711_2000001011 | Human | Colorectum | AD | 2.09e-03 | 3.32e-01 | 0.0338 |
| 5097 | PCDH1 | HTA11_7696_3000711011 | Human | Colorectum | AD | 6.03e-09 | 3.24e-01 | 0.0674 |
| 5097 | PCDH1 | HTA11_6818_2000001011 | Human | Colorectum | AD | 9.01e-03 | 4.67e-01 | 0.0112 |
| 5097 | PCDH1 | HTA11_7469_2000001011 | Human | Colorectum | AD | 7.82e-03 | 5.04e-01 | -0.0124 |
| 5097 | PCDH1 | HTA11_99999971662_82457 | Human | Colorectum | MSS | 6.87e-13 | 4.57e-01 | 0.3859 |
| 5097 | PCDH1 | HCC1_Meng | Human | Liver | HCC | 2.23e-17 | 1.09e-02 | 0.0246 |
| 5097 | PCDH1 | HCC2_Meng | Human | Liver | HCC | 3.72e-46 | 4.80e-01 | 0.0107 |
| 5097 | PCDH1 | HCC1 | Human | Liver | HCC | 1.30e-05 | 2.06e+00 | 0.5336 |
| 5097 | PCDH1 | HCC2 | Human | Liver | HCC | 1.62e-09 | 1.97e+00 | 0.5341 |
| 5097 | PCDH1 | S027 | Human | Liver | HCC | 4.25e-08 | 4.87e-01 | 0.2446 |
| Page: 1 2 |
| Tissue | Expression Dynamics | Abbreviation |
| Colorectum (GSE201348) |  | FAP: Familial adenomatous polyposis |
| CRC: Colorectal cancer | ||
| Colorectum (HTA11) |  | AD: Adenomas |
| SER: Sessile serrated lesions | ||
| MSI-H: Microsatellite-high colorectal cancer | ||
| MSS: Microsatellite stable colorectal cancer | ||
| Liver | 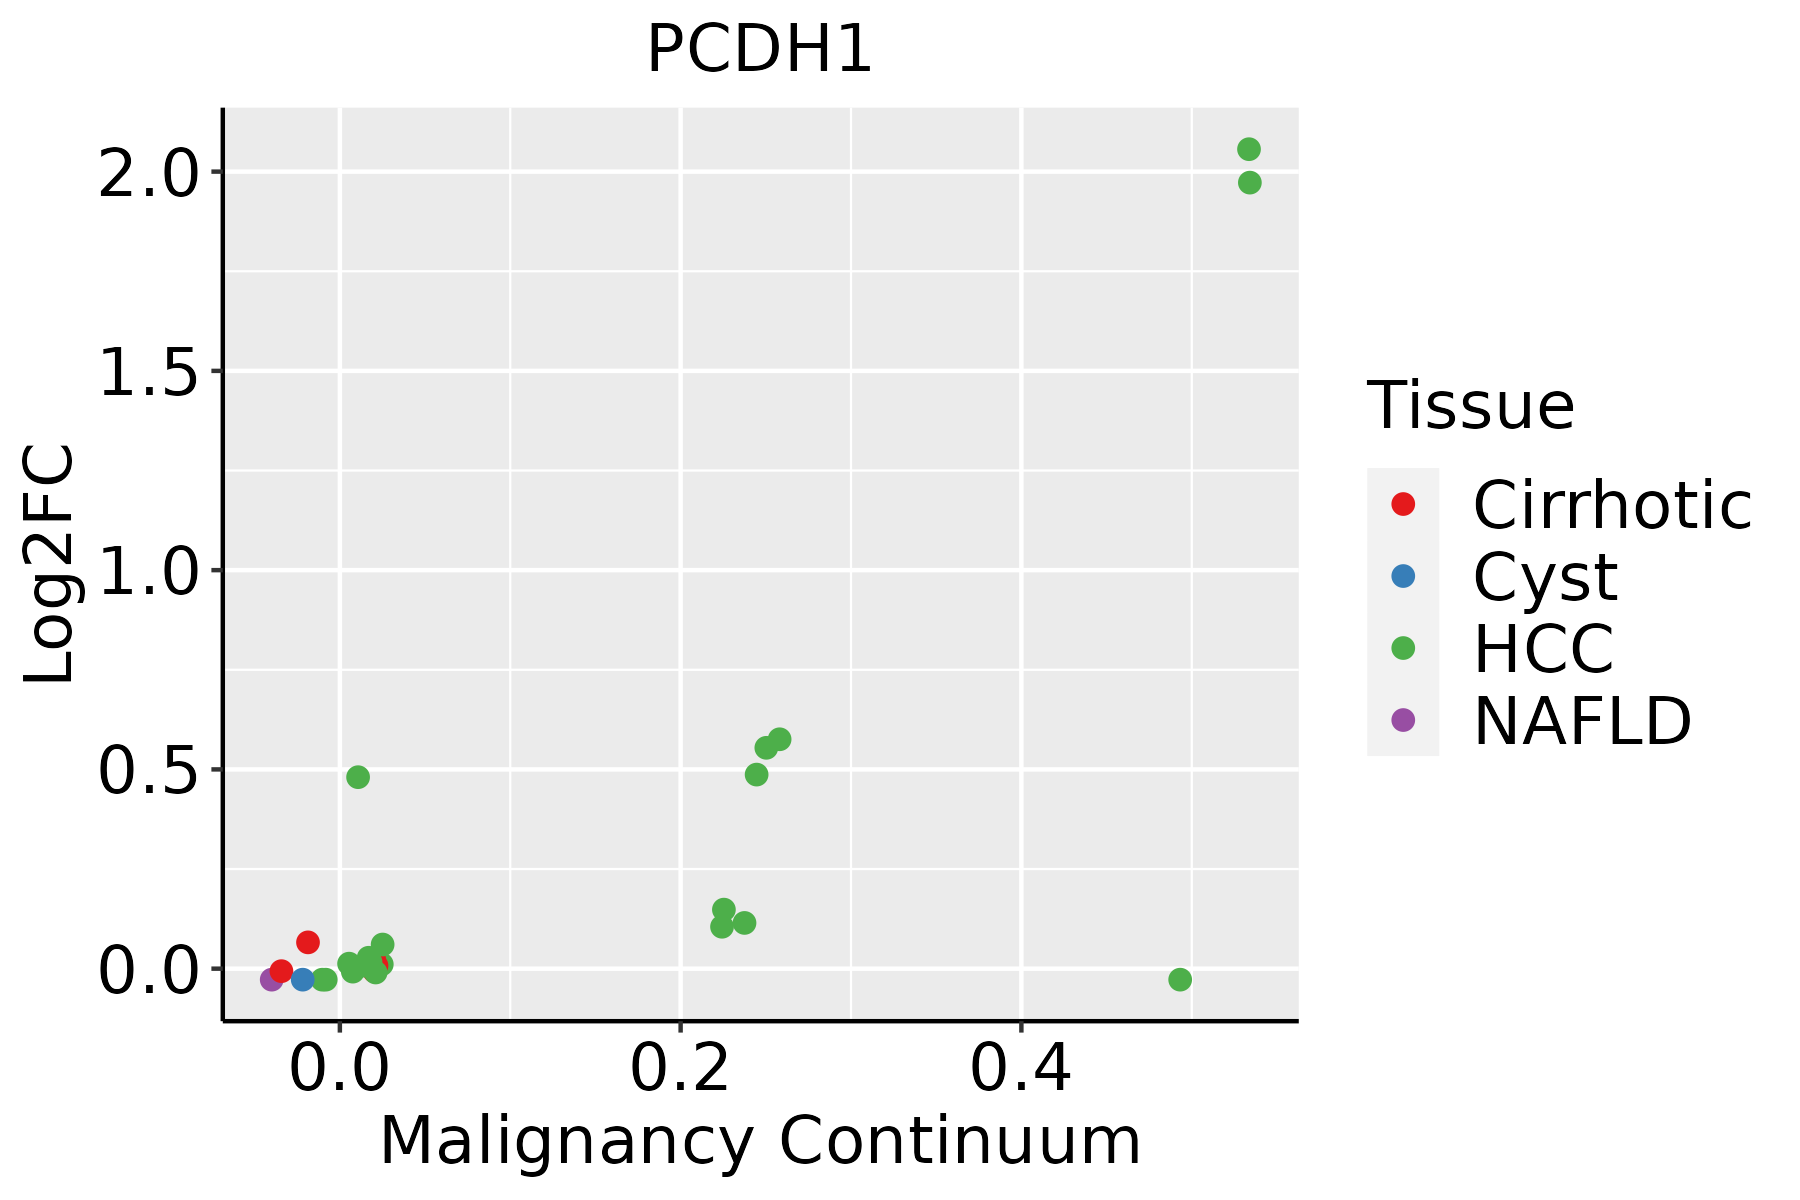 | HCC: Hepatocellular carcinoma |
| NAFLD: Non-alcoholic fatty liver disease |
| ∗log2FC in expression of this searched gene in stem-like cells from each diseased tissue sample relative to stem-like cells in normal samples in each tissue plotted against the malignancy continuum. Samples are colored based on if they are from different disease stage. |
Top |
Malignant transformation related pathway analysis |
| Find out the enriched GO biological processes and KEGG pathways involved in transition from healthy to precancer to cancer |
| Tissue | Disease Stage | Enriched GO biological Processes |
| Colorectum | AD |  |
| Colorectum | SER |  |
| Colorectum | MSS |  |
| Colorectum | MSI-H |  |
| Colorectum | FAP |  |
| ∗Top 15 enriched GO BP terms are showed in the bar plot of each disease state in each tissue. Each row represents a significant GO biological process which is colored according to the -log10(p.adjust). |
| Page: 1 2 3 4 5 6 7 8 9 |
| GO ID | Tissue | Disease Stage | Description | Gene Ratio | Bg Ratio | pvalue | p.adjust | Count |
| GO:0060249 | Colorectum | AD | anatomical structure homeostasis | 94/3918 | 314/18723 | 9.37e-05 | 1.42e-03 | 94 |
| GO:0001894 | Colorectum | AD | tissue homeostasis | 81/3918 | 268/18723 | 1.96e-04 | 2.62e-03 | 81 |
| GO:00018941 | Colorectum | SER | tissue homeostasis | 66/2897 | 268/18723 | 5.87e-05 | 1.37e-03 | 66 |
| GO:00602491 | Colorectum | SER | anatomical structure homeostasis | 74/2897 | 314/18723 | 1.01e-04 | 2.13e-03 | 74 |
| GO:00602492 | Colorectum | MSS | anatomical structure homeostasis | 84/3467 | 314/18723 | 1.87e-04 | 2.64e-03 | 84 |
| GO:00018942 | Colorectum | MSS | tissue homeostasis | 72/3467 | 268/18723 | 4.53e-04 | 5.40e-03 | 72 |
| Page: 1 |
| Pathway ID | Tissue | Disease Stage | Description | Gene Ratio | Bg Ratio | pvalue | p.adjust | qvalue | Count |
| Page: 1 |
Top |
Cell-cell communication analysis |
| Identification of potential cell-cell interactions between two cell types and their ligand-receptor pairs for different disease states |
| Ligand | Receptor | LRpair | Pathway | Tissue | Disease Stage |
| Page: 1 |
Top |
Single-cell gene regulatory network inference analysis |
| Find out the significant the regulons (TFs) and the target genes of each regulon across cell types for different disease states |
| TF | Cell Type | Tissue | Disease Stage | Target Gene | RSS | Regulon Activity |
| ∗The dot plots of a searched regulon are shown for all cell subpopulations in each disease state of each tissue based on the regulon specific score inferred using pySCENIC and by calculating the average expression. |
| Page: 1 |
Top |
Somatic mutation of malignant transformation related genes |
| Annotation of somatic variants for genes involved in malignant transformation |
| Hugo Symbol | Variant Class | Variant Classification | dbSNP RS | HGVSc | HGVSp | HGVSp Short | SWISSPROT | BIOTYPE | SIFT | PolyPhen | Tumor Sample Barcode | Tissue | Histology | Sex | Age | Stage | Therapy Types | Drugs | Outcome |
| PCDH1 | SNV | Missense_Mutation | c.1820N>G | p.Asp607Gly | p.D607G | Q08174 | protein_coding | deleterious(0) | probably_damaging(0.999) | TCGA-A2-A25A-01 | Breast | breast invasive carcinoma | Female | <65 | I/II | Unspecific | Cytoxan | SD | |
| PCDH1 | SNV | Missense_Mutation | c.721N>A | p.Glu241Lys | p.E241K | Q08174 | protein_coding | deleterious(0) | probably_damaging(0.999) | TCGA-AC-A23H-01 | Breast | breast invasive carcinoma | Female | >=65 | I/II | Unknown | Unknown | PD | |
| PCDH1 | SNV | Missense_Mutation | novel | c.1276N>C | p.Glu426Gln | p.E426Q | Q08174 | protein_coding | tolerated(0.15) | benign(0.343) | TCGA-AC-A5XS-01 | Breast | breast invasive carcinoma | Female | >=65 | I/II | Hormone Therapy | femara | SD |
| PCDH1 | SNV | Missense_Mutation | rs201168116 | c.844C>T | p.Arg282Trp | p.R282W | Q08174 | protein_coding | deleterious(0) | probably_damaging(0.946) | TCGA-B6-A0RS-01 | Breast | breast invasive carcinoma | Female | <65 | I/II | Unknown | Unknown | PD |
| PCDH1 | SNV | Missense_Mutation | novel | c.1172N>T | p.Gly391Val | p.G391V | Q08174 | protein_coding | tolerated(0.09) | probably_damaging(0.948) | TCGA-S3-A6ZF-01 | Breast | breast invasive carcinoma | Female | <65 | I/II | Chemotherapy | taxotere | CR |
| PCDH1 | deletion | Frame_Shift_Del | c.2185delC | p.Gln729ArgfsTer24 | p.Q729Rfs*24 | Q08174 | protein_coding | TCGA-BH-A18G-01 | Breast | breast invasive carcinoma | Female | >=65 | I/II | Unknown | Unknown | SD | |||
| PCDH1 | deletion | Frame_Shift_Del | novel | c.1643delN | p.Glu548GlyfsTer19 | p.E548Gfs*19 | Q08174 | protein_coding | TCGA-EW-A2FV-01 | Breast | breast invasive carcinoma | Female | <65 | III/IV | Chemotherapy | docetaxel | SD | ||
| PCDH1 | SNV | Missense_Mutation | novel | c.790N>T | p.Ala264Ser | p.A264S | Q08174 | protein_coding | deleterious(0.04) | possibly_damaging(0.82) | TCGA-DS-A1OC-01 | Cervix | cervical & endocervical cancer | Female | <65 | I/II | Chemotherapy | gemcitabine | SD |
| PCDH1 | SNV | Missense_Mutation | c.2122N>A | p.Glu708Lys | p.E708K | Q08174 | protein_coding | deleterious(0.04) | probably_damaging(0.986) | TCGA-EA-A43B-01 | Cervix | cervical & endocervical cancer | Female | <65 | I/II | Chemotherapy | cisplatin | CR | |
| PCDH1 | SNV | Missense_Mutation | c.3702N>C | p.Glu1234Asp | p.E1234D | Q08174 | protein_coding | deleterious_low_confidence(0) | benign(0.09) | TCGA-JX-A3Q0-01 | Cervix | cervical & endocervical cancer | Female | <65 | III/IV | Unknown | Unknown | SD |
| Page: 1 2 3 4 5 6 7 8 9 10 11 |
Top |
Related drugs of malignant transformation related genes |
| Identification of chemicals and drugs interact with genes involved in malignant transfromation |
| (DGIdb 4.0) |
| Entrez ID | Symbol | Category | Interaction Types | Drug Claim Name | Drug Name | PMIDs |
| Page: 1 |

Copyright 2023-Present -The University of Texas Health Science Center at Houston |