| Tissue | Expression Dynamics | Abbreviation |
| Colorectum (GSE201348) |  | FAP: Familial adenomatous polyposis |
| CRC: Colorectal cancer |
| Colorectum (HTA11) |  | AD: Adenomas |
| SER: Sessile serrated lesions |
| MSI-H: Microsatellite-high colorectal cancer |
| MSS: Microsatellite stable colorectal cancer |
| Esophagus | 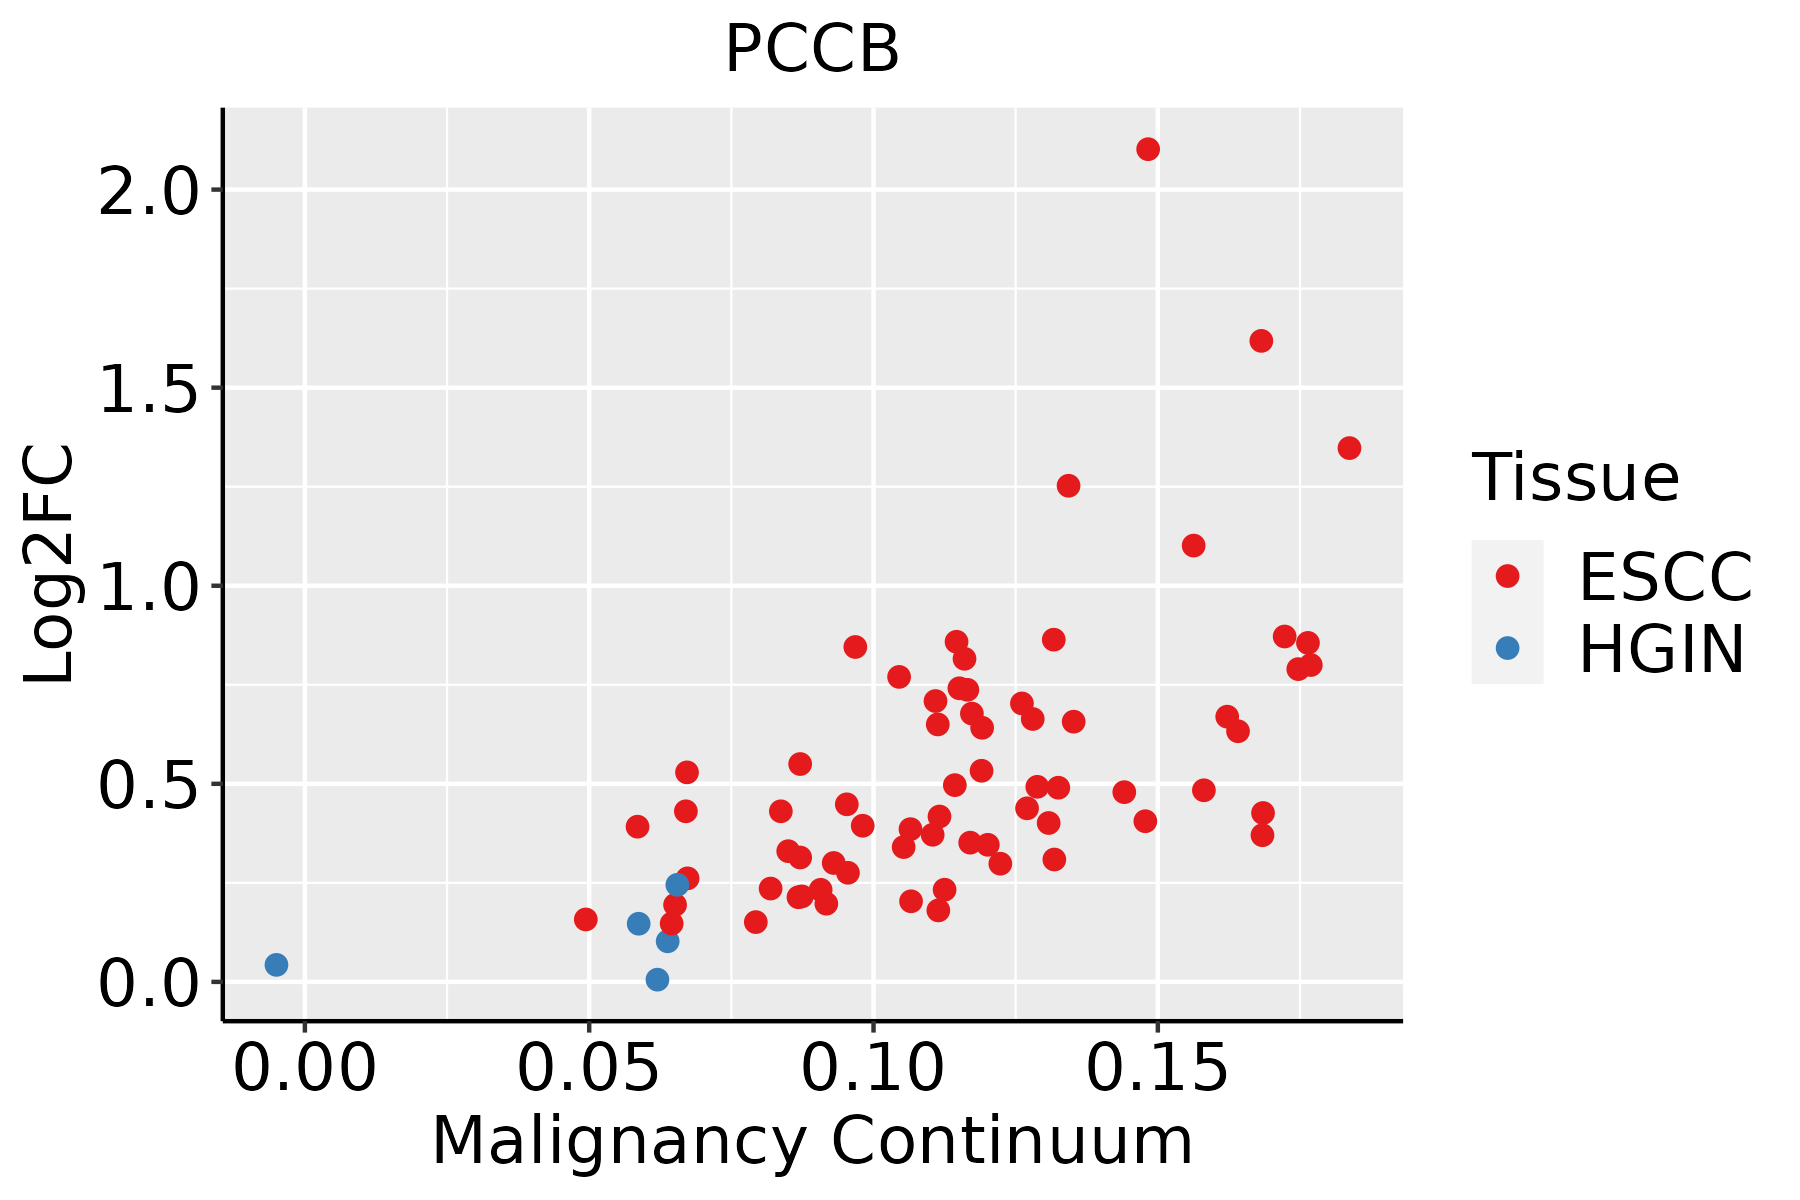 | ESCC: Esophageal squamous cell carcinoma |
| HGIN: High-grade intraepithelial neoplasias |
| LGIN: Low-grade intraepithelial neoplasias |
| Liver |  | HCC: Hepatocellular carcinoma |
| NAFLD: Non-alcoholic fatty liver disease |
| Oral Cavity | 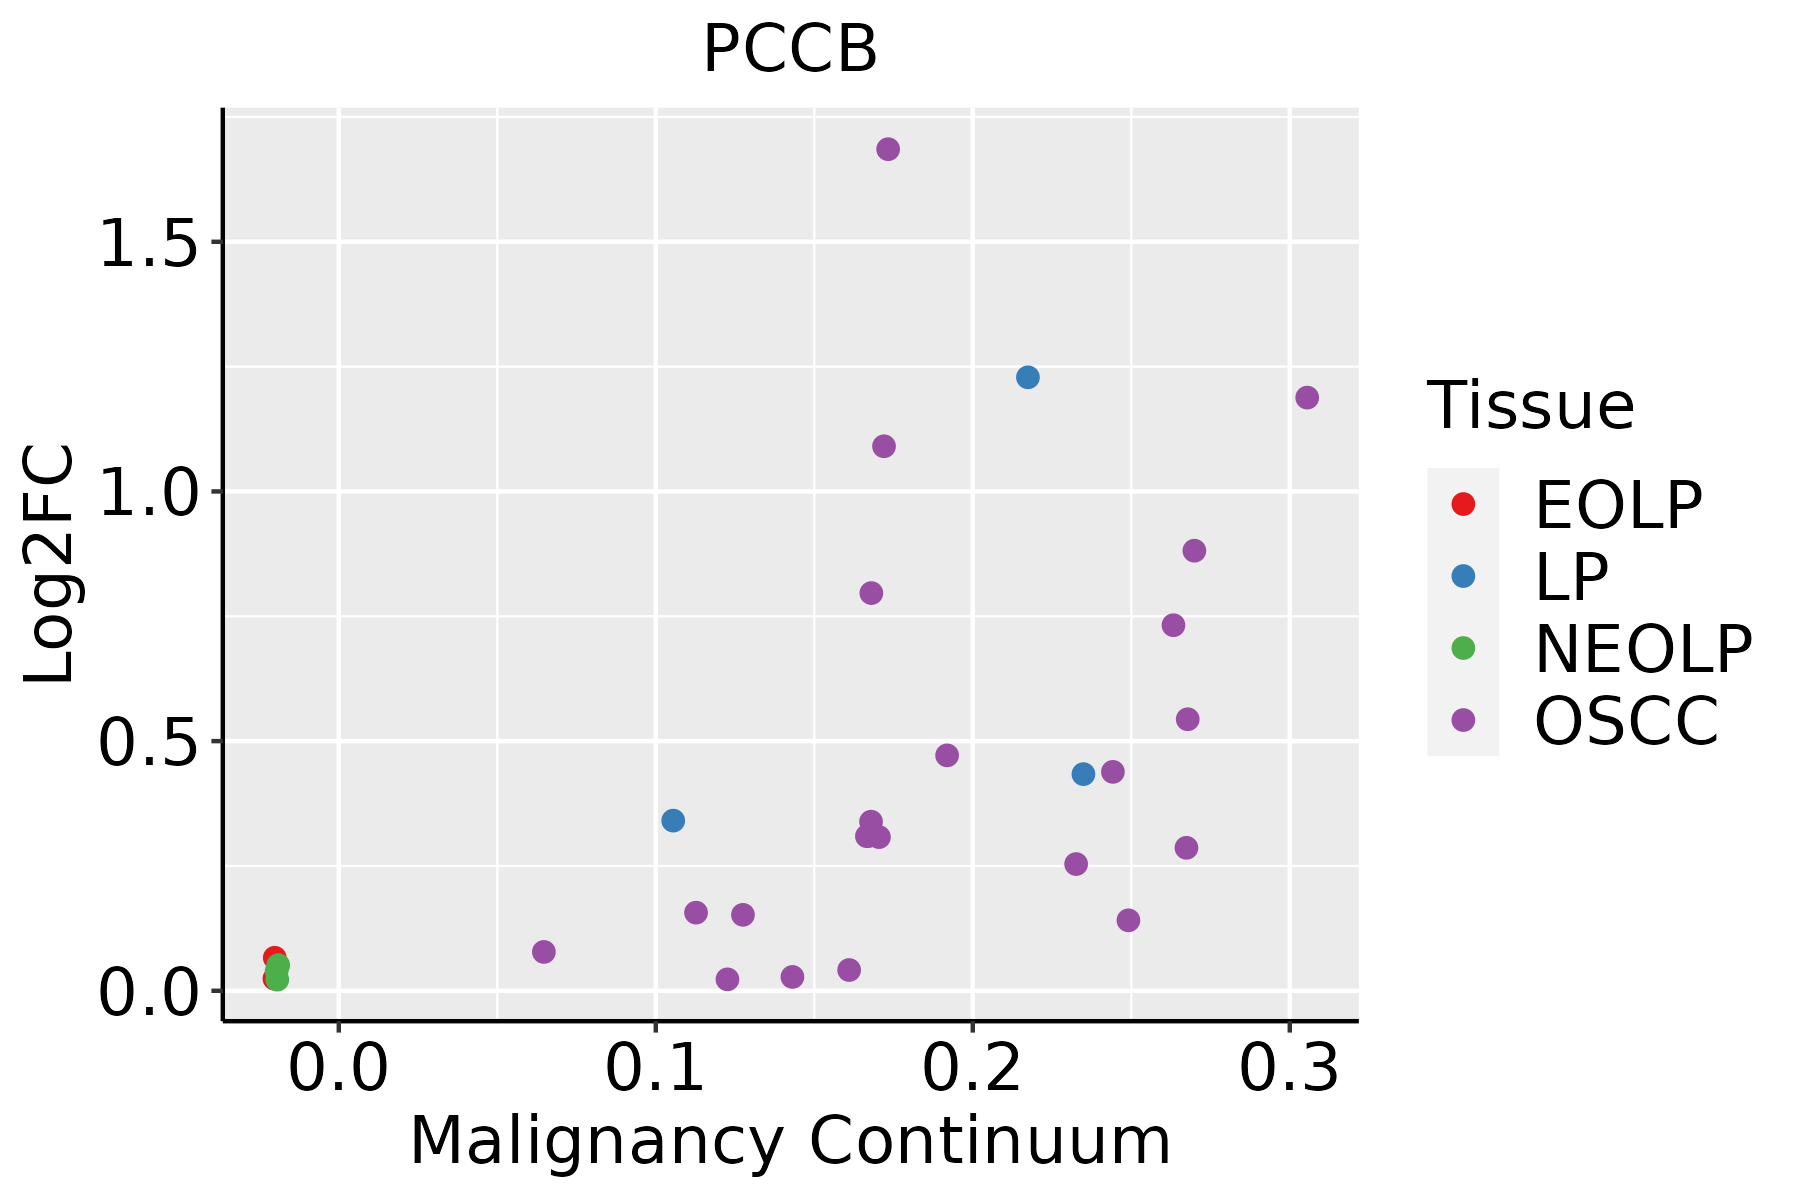 | EOLP: Erosive Oral lichen planus |
| LP: leukoplakia |
| NEOLP: Non-erosive oral lichen planus |
| OSCC: Oral squamous cell carcinoma |
| Skin | 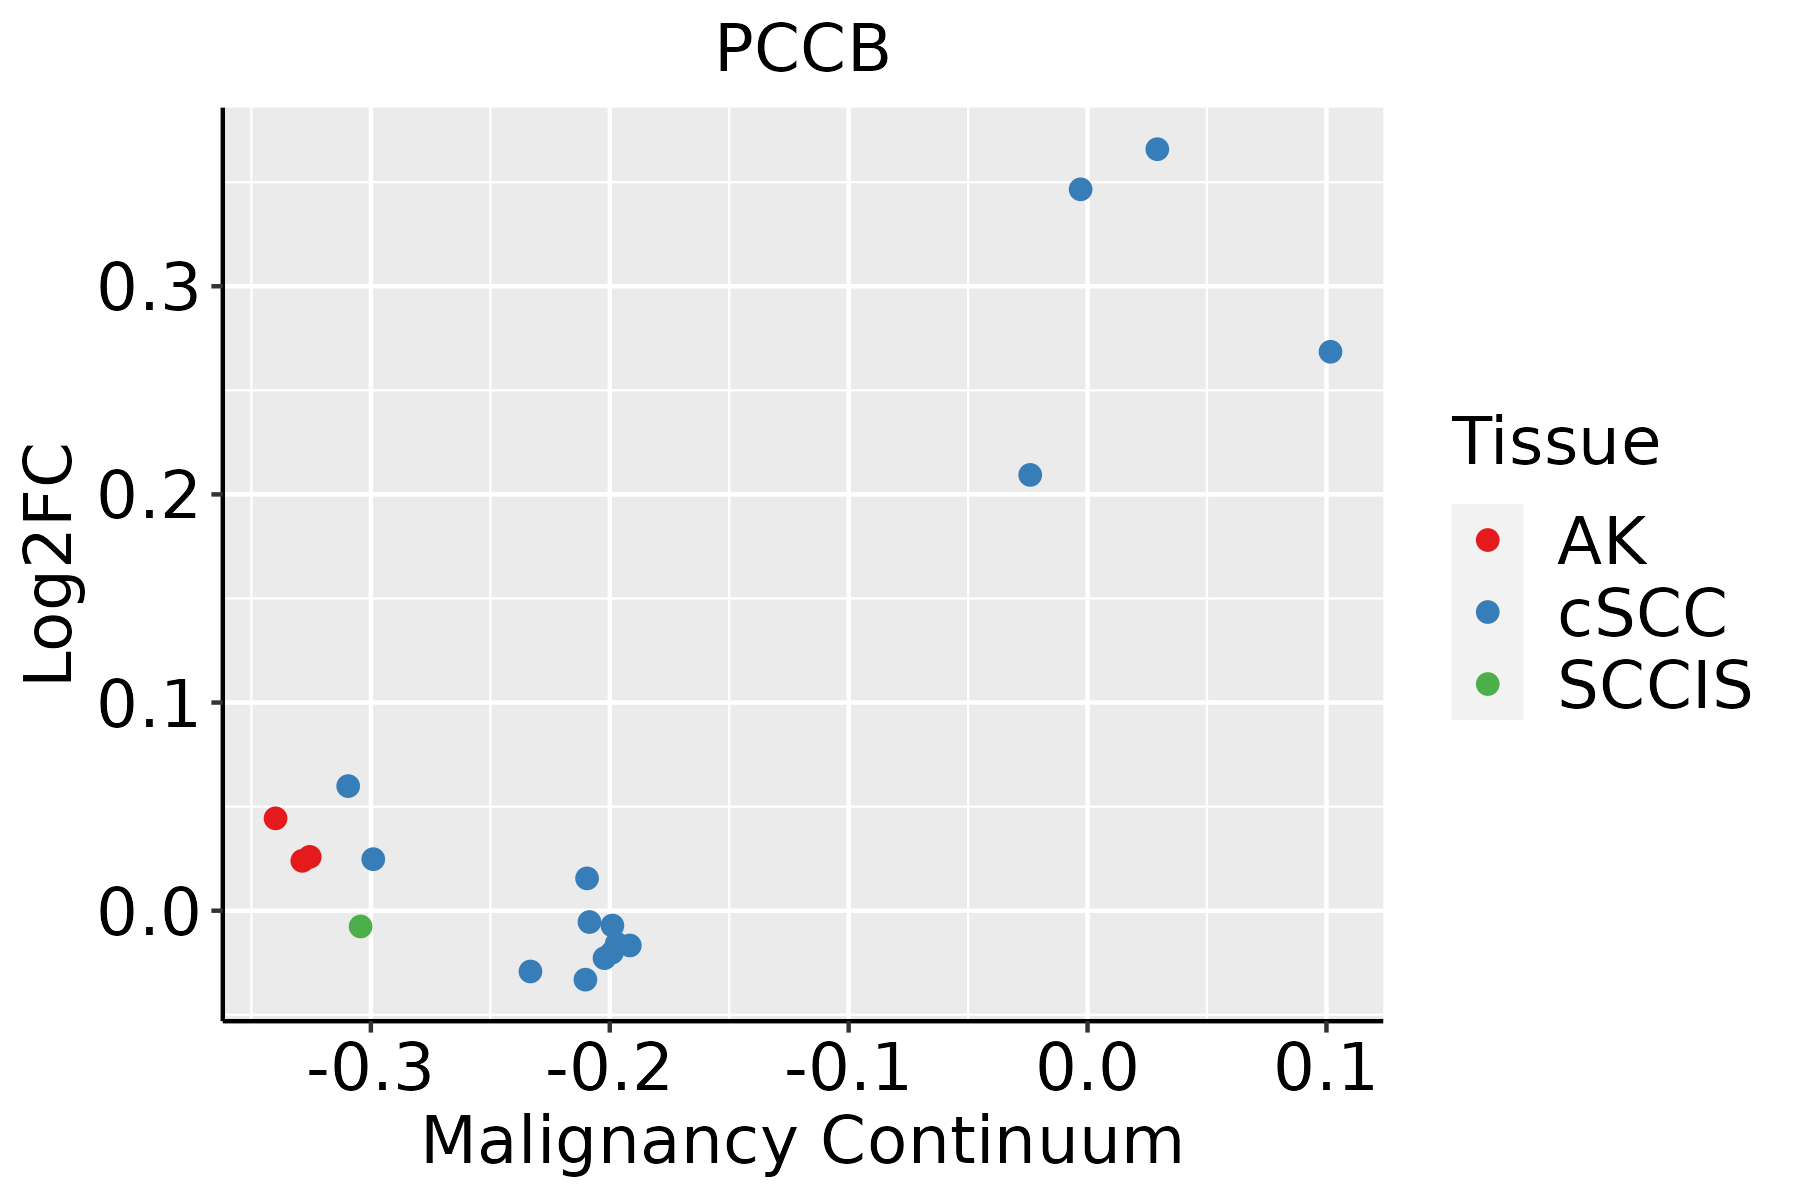 | AK: Actinic keratosis |
| cSCC: Cutaneous squamous cell carcinoma |
| SCCIS:squamous cell carcinoma in situ |
| GO ID | Tissue | Disease Stage | Description | Gene Ratio | Bg Ratio | pvalue | p.adjust | Count |
| GO:0044282 | Colorectum | AD | small molecule catabolic process | 118/3918 | 376/18723 | 1.05e-06 | 3.55e-05 | 118 |
| GO:0009062 | Colorectum | AD | fatty acid catabolic process | 41/3918 | 100/18723 | 4.02e-06 | 1.09e-04 | 41 |
| GO:0016042 | Colorectum | AD | lipid catabolic process | 97/3918 | 320/18723 | 4.31e-05 | 7.56e-04 | 97 |
| GO:0006631 | Colorectum | AD | fatty acid metabolic process | 114/3918 | 390/18723 | 5.58e-05 | 9.44e-04 | 114 |
| GO:0072329 | Colorectum | AD | monocarboxylic acid catabolic process | 44/3918 | 122/18723 | 8.05e-05 | 1.28e-03 | 44 |
| GO:0016054 | Colorectum | AD | organic acid catabolic process | 73/3918 | 240/18723 | 3.20e-04 | 3.81e-03 | 73 |
| GO:0044242 | Colorectum | AD | cellular lipid catabolic process | 66/3918 | 214/18723 | 3.96e-04 | 4.50e-03 | 66 |
| GO:0046395 | Colorectum | AD | carboxylic acid catabolic process | 70/3918 | 236/18723 | 9.06e-04 | 8.71e-03 | 70 |
| GO:0046459 | Colorectum | AD | short-chain fatty acid metabolic process | 8/3918 | 15/18723 | 5.67e-03 | 3.64e-02 | 8 |
| GO:00090623 | Colorectum | FAP | fatty acid catabolic process | 31/2622 | 100/18723 | 9.77e-06 | 2.85e-04 | 31 |
| GO:00066313 | Colorectum | FAP | fatty acid metabolic process | 81/2622 | 390/18723 | 1.43e-04 | 2.24e-03 | 81 |
| GO:00723293 | Colorectum | FAP | monocarboxylic acid catabolic process | 32/2622 | 122/18723 | 2.57e-04 | 3.53e-03 | 32 |
| GO:00442422 | Colorectum | FAP | cellular lipid catabolic process | 49/2622 | 214/18723 | 2.87e-04 | 3.77e-03 | 49 |
| GO:00442823 | Colorectum | FAP | small molecule catabolic process | 77/2622 | 376/18723 | 3.25e-04 | 4.16e-03 | 77 |
| GO:00160423 | Colorectum | FAP | lipid catabolic process | 65/2622 | 320/18723 | 1.13e-03 | 1.08e-02 | 65 |
| GO:00160543 | Colorectum | FAP | organic acid catabolic process | 50/2622 | 240/18723 | 2.30e-03 | 1.85e-02 | 50 |
| GO:00463951 | Colorectum | FAP | carboxylic acid catabolic process | 48/2622 | 236/18723 | 4.53e-03 | 3.08e-02 | 48 |
| GO:00090628 | Esophagus | ESCC | fatty acid catabolic process | 66/8552 | 100/18723 | 3.21e-05 | 2.66e-04 | 66 |
| GO:00066318 | Esophagus | ESCC | fatty acid metabolic process | 217/8552 | 390/18723 | 4.21e-05 | 3.39e-04 | 217 |
| GO:00723297 | Esophagus | ESCC | monocarboxylic acid catabolic process | 74/8552 | 122/18723 | 6.03e-04 | 3.27e-03 | 74 |
| Pathway ID | Tissue | Disease Stage | Description | Gene Ratio | Bg Ratio | pvalue | p.adjust | qvalue | Count |
| hsa01200 | Colorectum | AD | Carbon metabolism | 55/2092 | 115/8465 | 5.53e-08 | 8.42e-07 | 5.37e-07 | 55 |
| hsa00640 | Colorectum | AD | Propanoate metabolism | 18/2092 | 32/8465 | 1.33e-04 | 1.11e-03 | 7.08e-04 | 18 |
| hsa00630 | Colorectum | AD | Glyoxylate and dicarboxylate metabolism | 14/2092 | 30/8465 | 7.25e-03 | 2.97e-02 | 1.89e-02 | 14 |
| hsa012001 | Colorectum | AD | Carbon metabolism | 55/2092 | 115/8465 | 5.53e-08 | 8.42e-07 | 5.37e-07 | 55 |
| hsa006401 | Colorectum | AD | Propanoate metabolism | 18/2092 | 32/8465 | 1.33e-04 | 1.11e-03 | 7.08e-04 | 18 |
| hsa006301 | Colorectum | AD | Glyoxylate and dicarboxylate metabolism | 14/2092 | 30/8465 | 7.25e-03 | 2.97e-02 | 1.89e-02 | 14 |
| hsa006302 | Colorectum | MSI-H | Glyoxylate and dicarboxylate metabolism | 8/797 | 30/8465 | 5.34e-03 | 4.94e-02 | 4.14e-02 | 8 |
| hsa006303 | Colorectum | MSI-H | Glyoxylate and dicarboxylate metabolism | 8/797 | 30/8465 | 5.34e-03 | 4.94e-02 | 4.14e-02 | 8 |
| hsa012006 | Colorectum | FAP | Carbon metabolism | 38/1404 | 115/8465 | 1.04e-05 | 1.44e-04 | 8.76e-05 | 38 |
| hsa012007 | Colorectum | FAP | Carbon metabolism | 38/1404 | 115/8465 | 1.04e-05 | 1.44e-04 | 8.76e-05 | 38 |
| hsa0120016 | Esophagus | HGIN | Carbon metabolism | 31/1383 | 115/8465 | 2.51e-03 | 2.10e-02 | 1.67e-02 | 31 |
| hsa0120017 | Esophagus | HGIN | Carbon metabolism | 31/1383 | 115/8465 | 2.51e-03 | 2.10e-02 | 1.67e-02 | 31 |
| hsa0120023 | Esophagus | ESCC | Carbon metabolism | 79/4205 | 115/8465 | 2.50e-05 | 1.21e-04 | 6.22e-05 | 79 |
| hsa002809 | Esophagus | ESCC | Valine, leucine and isoleucine degradation | 34/4205 | 48/8465 | 2.34e-03 | 6.54e-03 | 3.35e-03 | 34 |
| hsa006306 | Esophagus | ESCC | Glyoxylate and dicarboxylate metabolism | 21/4205 | 30/8465 | 1.95e-02 | 4.35e-02 | 2.23e-02 | 21 |
| hsa0120033 | Esophagus | ESCC | Carbon metabolism | 79/4205 | 115/8465 | 2.50e-05 | 1.21e-04 | 6.22e-05 | 79 |
| hsa0028014 | Esophagus | ESCC | Valine, leucine and isoleucine degradation | 34/4205 | 48/8465 | 2.34e-03 | 6.54e-03 | 3.35e-03 | 34 |
| hsa0063013 | Esophagus | ESCC | Glyoxylate and dicarboxylate metabolism | 21/4205 | 30/8465 | 1.95e-02 | 4.35e-02 | 2.23e-02 | 21 |
| hsa0064010 | Liver | NAFLD | Propanoate metabolism | 12/1043 | 32/8465 | 2.44e-04 | 4.45e-03 | 3.58e-03 | 12 |
| hsa0120010 | Liver | NAFLD | Carbon metabolism | 26/1043 | 115/8465 | 1.39e-03 | 1.71e-02 | 1.38e-02 | 26 |
| Hugo Symbol | Variant Class | Variant Classification | dbSNP RS | HGVSc | HGVSp | HGVSp Short | SWISSPROT | BIOTYPE | SIFT | PolyPhen | Tumor Sample Barcode | Tissue | Histology | Sex | Age | Stage | Therapy Types | Drugs | Outcome |
| PCCB | SNV | Missense_Mutation | | c.1156N>G | p.Leu386Val | p.L386V | P05166 | protein_coding | deleterious_low_confidence(0.01) | probably_damaging(0.999) | TCGA-AN-A0AT-01 | Breast | breast invasive carcinoma | Female | <65 | I/II | Unknown | Unknown | SD |
| PCCB | insertion | Frame_Shift_Ins | novel | c.1341_1342insCCTCAAGTGGTCTGCCTGCCCG | p.Thr448ProfsTer20 | p.T448Pfs*20 | P05166 | protein_coding | | | TCGA-A8-A07J-01 | Breast | breast invasive carcinoma | Female | <65 | I/II | Chemotherapy | 5-fluorouracil | CR |
| PCCB | insertion | Frame_Shift_Ins | novel | c.1343_1344insCTCCCAA | p.Val449SerfsTer14 | p.V449Sfs*14 | P05166 | protein_coding | | | TCGA-A8-A07J-01 | Breast | breast invasive carcinoma | Female | <65 | I/II | Chemotherapy | 5-fluorouracil | CR |
| PCCB | SNV | Missense_Mutation | | c.979N>A | p.Pro327Thr | p.P327T | P05166 | protein_coding | deleterious_low_confidence(0) | probably_damaging(1) | TCGA-AA-3710-01 | Colorectum | colon adenocarcinoma | Female | >=65 | I/II | Unknown | Unknown | SD |
| PCCB | SNV | Missense_Mutation | | c.166N>A | p.Asp56Asn | p.D56N | P05166 | protein_coding | deleterious_low_confidence(0.03) | benign(0.007) | TCGA-D5-6532-01 | Colorectum | colon adenocarcinoma | Male | <65 | I/II | Unknown | Unknown | SD |
| PCCB | SNV | Missense_Mutation | novel | c.1250N>G | p.Phe417Cys | p.F417C | P05166 | protein_coding | deleterious_low_confidence(0) | probably_damaging(1) | TCGA-AG-A00Y-01 | Colorectum | rectum adenocarcinoma | Male | >=65 | I/II | Unknown | Unknown | PD |
| PCCB | SNV | Missense_Mutation | novel | c.245N>A | p.Ser82Asn | p.S82N | P05166 | protein_coding | deleterious_low_confidence(0.04) | benign(0.21) | TCGA-F5-6814-01 | Colorectum | rectum adenocarcinoma | Male | <65 | I/II | Unknown | Unknown | SD |
| PCCB | SNV | Missense_Mutation | novel | c.714N>T | p.Lys238Asn | p.K238N | P05166 | protein_coding | deleterious_low_confidence(0.01) | possibly_damaging(0.589) | TCGA-A5-A1OF-01 | Endometrium | uterine corpus endometrioid carcinoma | Female | <65 | I/II | Unknown | Unknown | SD |
| PCCB | SNV | Missense_Mutation | rs764697873 | c.1595N>A | p.Arg532His | p.R532H | P05166 | protein_coding | deleterious_low_confidence(0) | probably_damaging(1) | TCGA-A5-A1OF-01 | Endometrium | uterine corpus endometrioid carcinoma | Female | <65 | I/II | Unknown | Unknown | SD |
| PCCB | SNV | Missense_Mutation | novel | c.415N>A | p.Ala139Thr | p.A139T | P05166 | protein_coding | tolerated_low_confidence(0.38) | unknown(0) | TCGA-AJ-A23O-01 | Endometrium | uterine corpus endometrioid carcinoma | Female | >=65 | I/II | Unknown | Unknown | SD |


