
|
|||||
|
 | |
| |
| |
| |
| |
| |
|
Gene: PCCA |
Gene summary for PCCA |
| Gene information | Species | Human | Gene symbol | PCCA | Gene ID | 5095 |
| Gene name | propionyl-CoA carboxylase subunit alpha | |
| Gene Alias | PCCA | |
| Cytomap | 13q32.3 | |
| Gene Type | protein-coding | GO ID | GO:0006082 | UniProtAcc | P05165 |
Top |
Malignant transformation analysis |
| Identification of the aberrant gene expression in precancerous and cancerous lesions by comparing the gene expression of stem-like cells in diseased tissues with normal stem cells |
| Entrez ID | Symbol | Replicates | Species | Organ | Tissue | Adj P-value | Log2FC | Malignancy |
| 5095 | PCCA | CCI_1 | Human | Cervix | CC | 1.42e-09 | 1.09e+00 | 0.528 |
| 5095 | PCCA | CCI_2 | Human | Cervix | CC | 8.04e-18 | 1.50e+00 | 0.5249 |
| 5095 | PCCA | CCI_3 | Human | Cervix | CC | 1.45e-15 | 1.05e+00 | 0.516 |
| 5095 | PCCA | HTA11_3410_2000001011 | Human | Colorectum | AD | 2.10e-73 | -1.02e+00 | 0.0155 |
| 5095 | PCCA | HTA11_2487_2000001011 | Human | Colorectum | SER | 2.79e-07 | -6.06e-01 | -0.1808 |
| 5095 | PCCA | HTA11_2951_2000001011 | Human | Colorectum | AD | 4.97e-11 | -8.69e-01 | 0.0216 |
| 5095 | PCCA | HTA11_347_2000001011 | Human | Colorectum | AD | 1.02e-03 | 3.39e-01 | -0.1954 |
| 5095 | PCCA | HTA11_411_2000001011 | Human | Colorectum | SER | 2.15e-11 | -7.53e-01 | -0.2602 |
| 5095 | PCCA | HTA11_2112_2000001011 | Human | Colorectum | SER | 3.35e-09 | -9.23e-01 | -0.2196 |
| 5095 | PCCA | HTA11_3361_2000001011 | Human | Colorectum | AD | 4.33e-25 | -9.18e-01 | -0.1207 |
| 5095 | PCCA | HTA11_696_2000001011 | Human | Colorectum | AD | 1.43e-14 | -5.08e-01 | -0.1464 |
| 5095 | PCCA | HTA11_866_2000001011 | Human | Colorectum | AD | 1.29e-07 | -4.13e-01 | -0.1001 |
| 5095 | PCCA | HTA11_2992_2000001011 | Human | Colorectum | SER | 1.99e-02 | -4.81e-01 | -0.1706 |
| 5095 | PCCA | HTA11_5212_2000001011 | Human | Colorectum | AD | 1.55e-17 | -9.37e-01 | -0.2061 |
| 5095 | PCCA | HTA11_5216_2000001011 | Human | Colorectum | SER | 3.32e-05 | -6.41e-01 | -0.1462 |
| 5095 | PCCA | HTA11_7862_2000001011 | Human | Colorectum | AD | 6.44e-07 | -5.85e-01 | -0.0179 |
| 5095 | PCCA | HTA11_866_3004761011 | Human | Colorectum | AD | 5.46e-49 | -1.06e+00 | 0.096 |
| 5095 | PCCA | HTA11_4255_2000001011 | Human | Colorectum | SER | 9.40e-06 | -6.94e-01 | 0.0446 |
| 5095 | PCCA | HTA11_9408_2000001011 | Human | Colorectum | AD | 7.00e-12 | -9.38e-01 | 0.0451 |
| 5095 | PCCA | HTA11_8622_2000001021 | Human | Colorectum | SER | 2.30e-13 | -7.60e-01 | 0.0528 |
| Page: 1 2 3 4 5 6 |
| Tissue | Expression Dynamics | Abbreviation |
| Cervix | 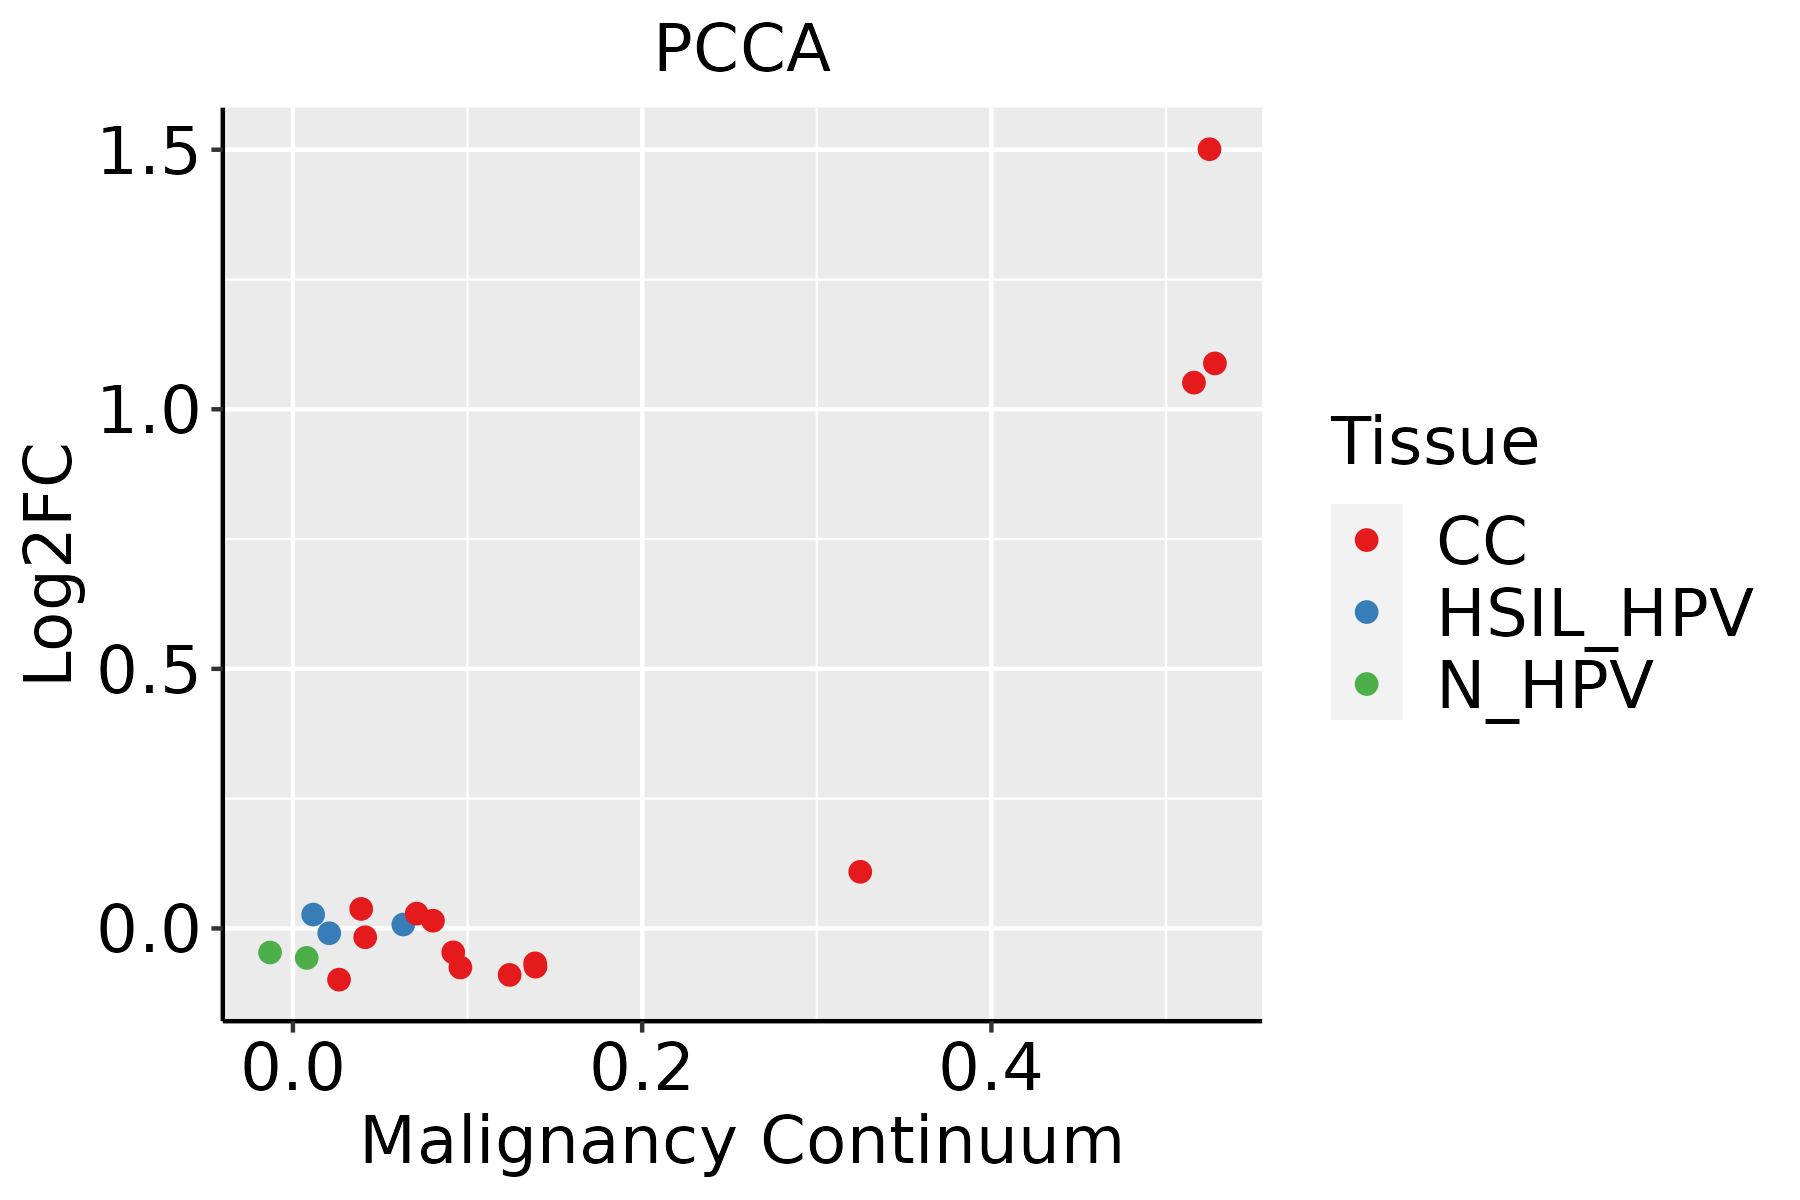 | CC: Cervix cancer |
| HSIL_HPV: HPV-infected high-grade squamous intraepithelial lesions | ||
| N_HPV: HPV-infected normal cervix | ||
| Colorectum (GSE201348) | 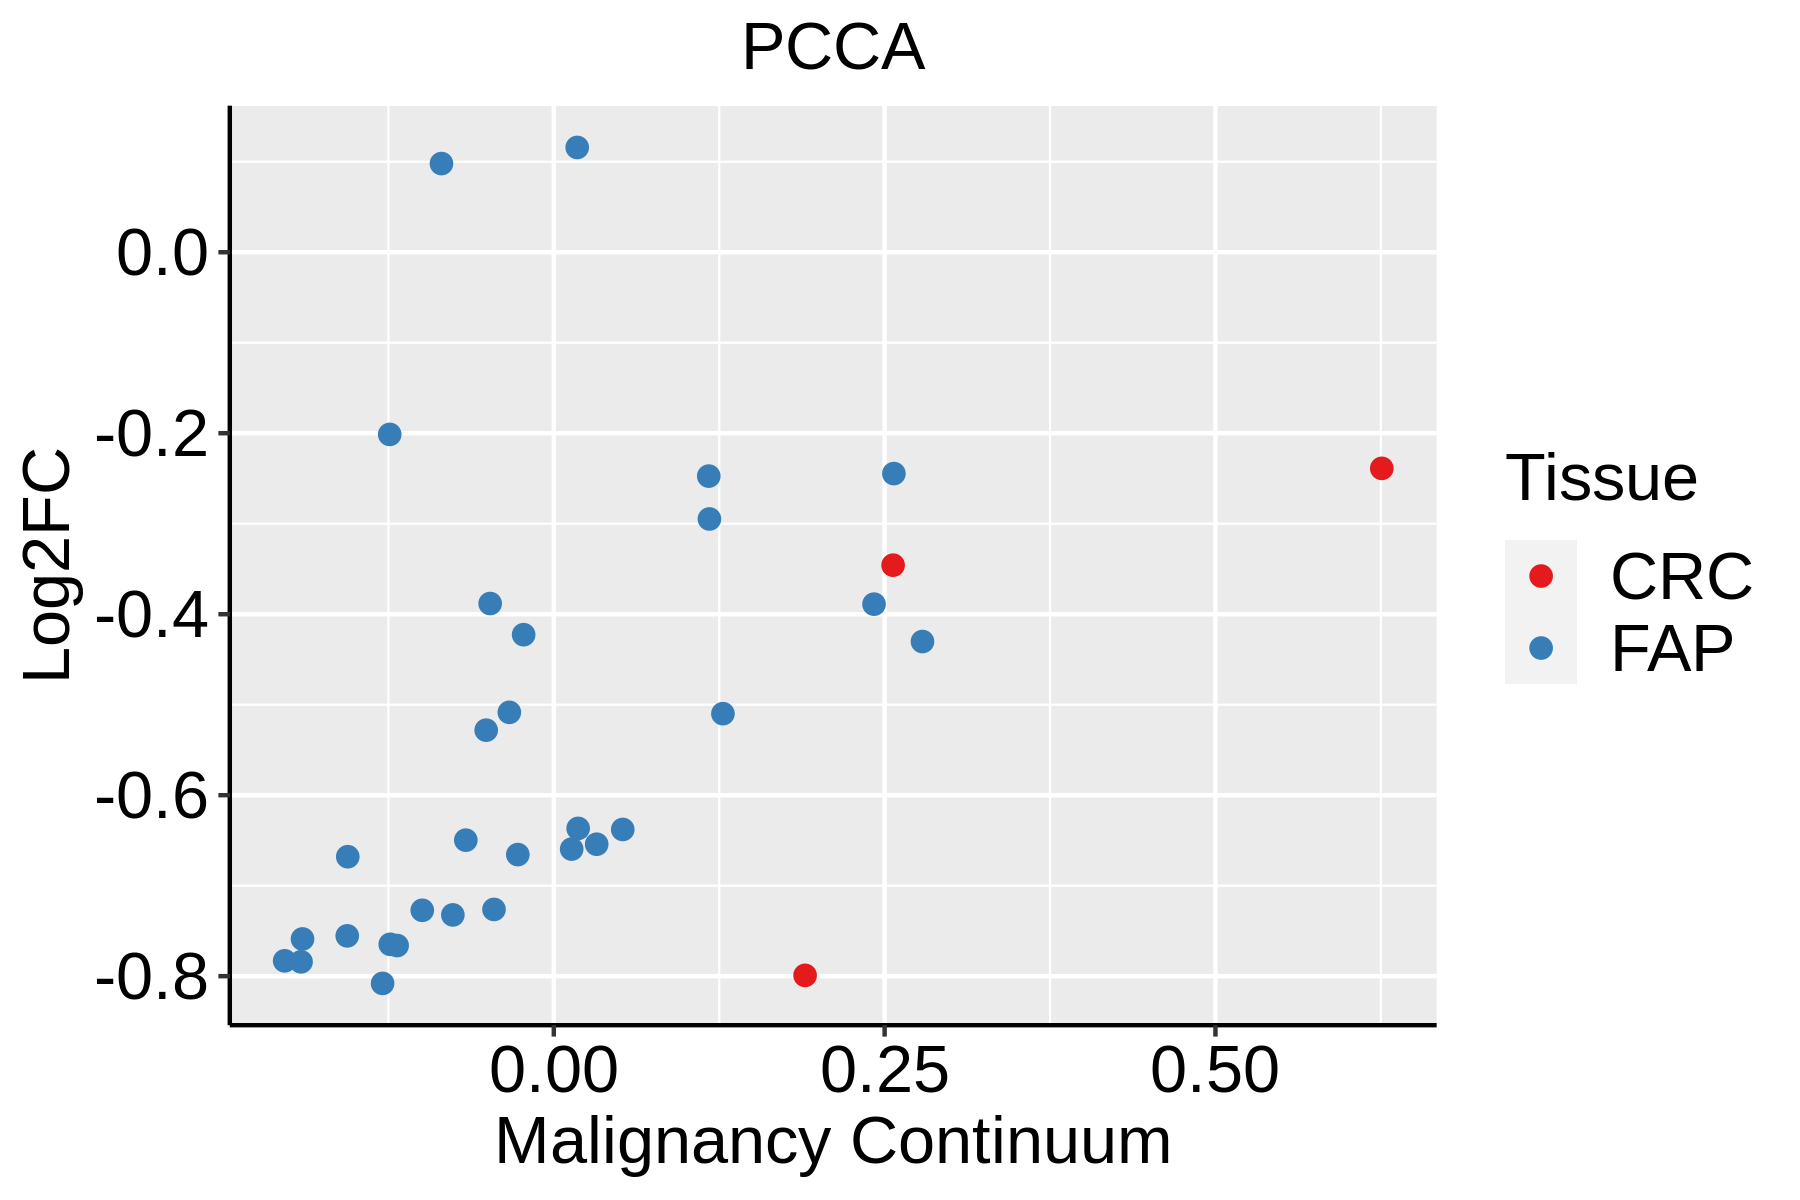 | FAP: Familial adenomatous polyposis |
| CRC: Colorectal cancer | ||
| Colorectum (HTA11) |  | AD: Adenomas |
| SER: Sessile serrated lesions | ||
| MSI-H: Microsatellite-high colorectal cancer | ||
| MSS: Microsatellite stable colorectal cancer | ||
| Endometrium |  | AEH: Atypical endometrial hyperplasia |
| EEC: Endometrioid Cancer | ||
| Liver |  | HCC: Hepatocellular carcinoma |
| NAFLD: Non-alcoholic fatty liver disease | ||
| Lung |  | AAH: Atypical adenomatous hyperplasia |
| AIS: Adenocarcinoma in situ | ||
| IAC: Invasive lung adenocarcinoma | ||
| MIA: Minimally invasive adenocarcinoma | ||
| Prostate | 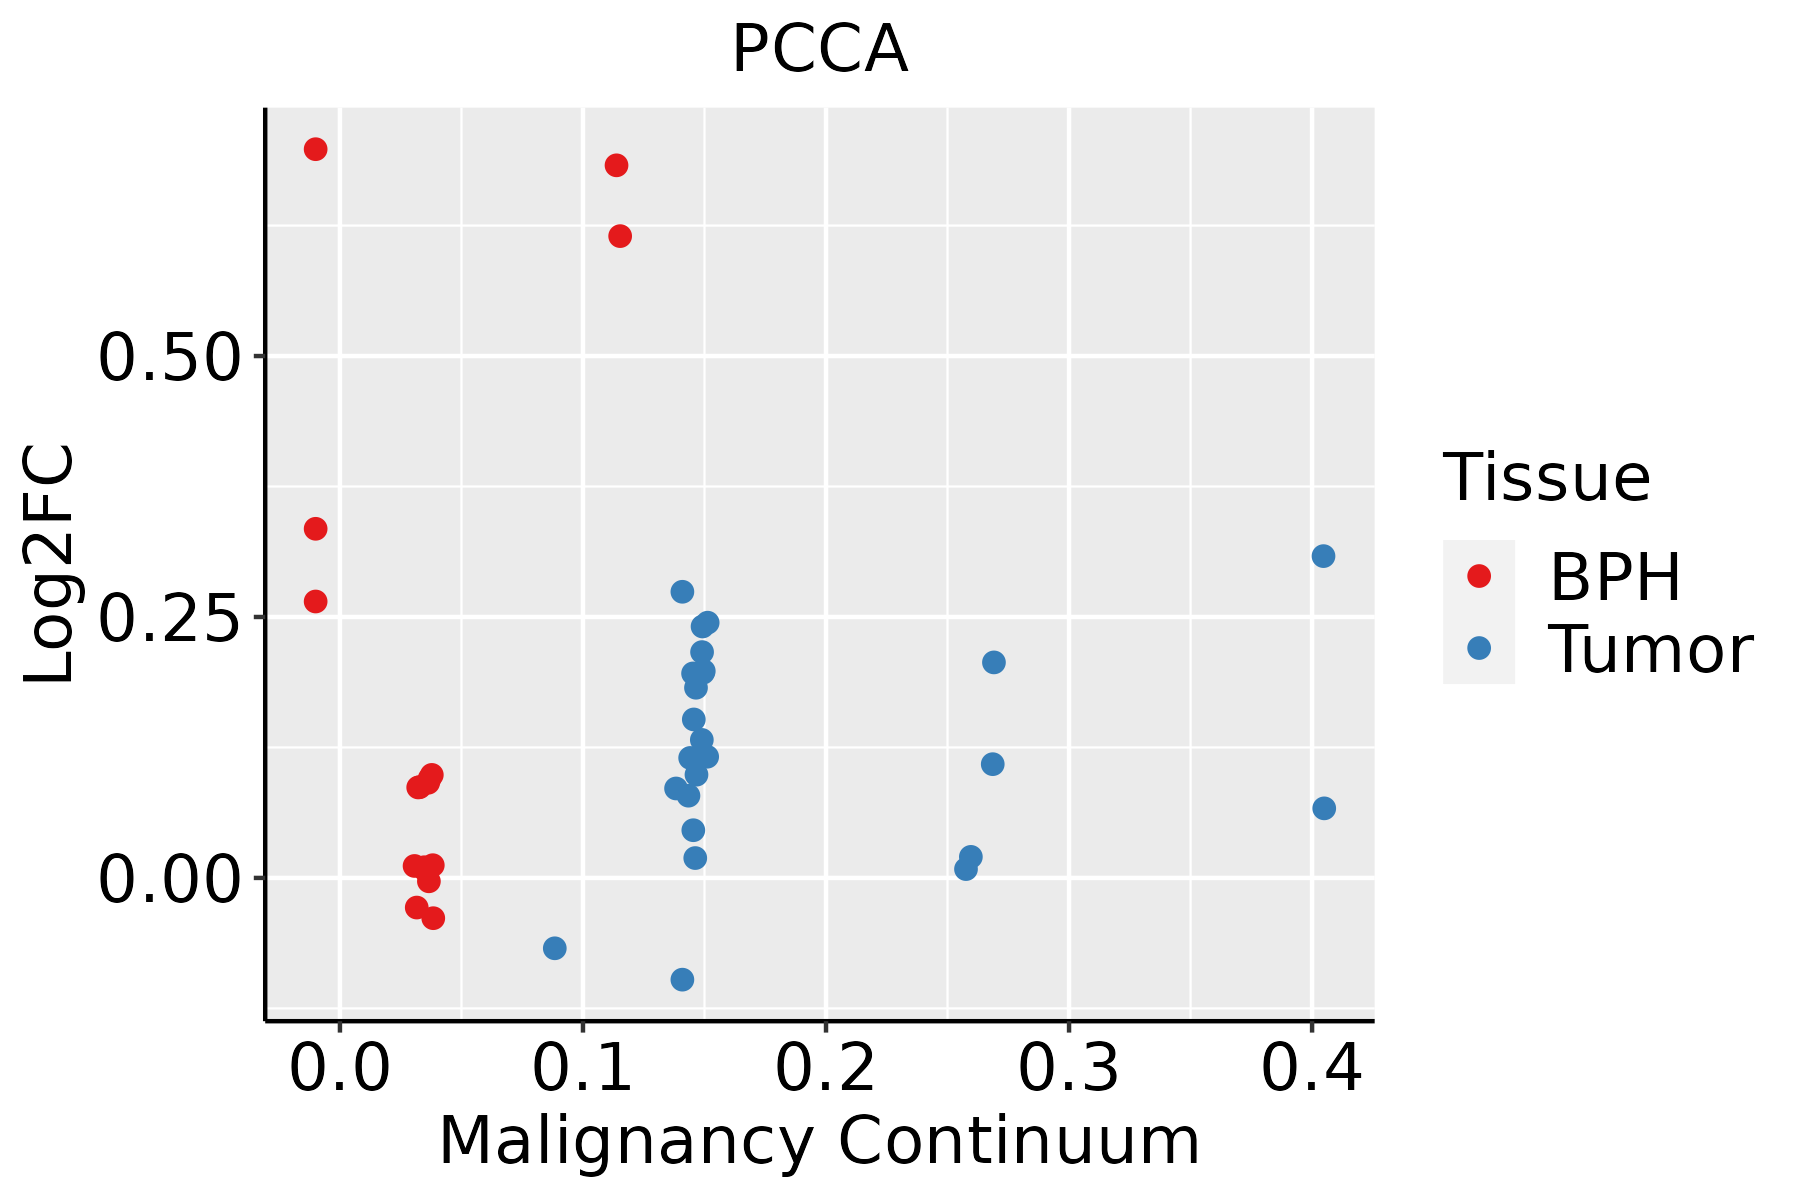 | BPH: Benign Prostatic Hyperplasia |
| ∗log2FC in expression of this searched gene in stem-like cells from each diseased tissue sample relative to stem-like cells in normal samples in each tissue plotted against the malignancy continuum. Samples are colored based on if they are from different disease stage. |
Top |
Malignant transformation related pathway analysis |
| Find out the enriched GO biological processes and KEGG pathways involved in transition from healthy to precancer to cancer |
| Tissue | Disease Stage | Enriched GO biological Processes |
| Colorectum | AD |  |
| Colorectum | SER |  |
| Colorectum | MSS |  |
| Colorectum | MSI-H |  |
| Colorectum | FAP |  |
| ∗Top 15 enriched GO BP terms are showed in the bar plot of each disease state in each tissue. Each row represents a significant GO biological process which is colored according to the -log10(p.adjust). |
| Page: 1 2 3 4 5 6 7 8 9 |
| GO ID | Tissue | Disease Stage | Description | Gene Ratio | Bg Ratio | pvalue | p.adjust | Count |
| GO:0044282 | Colorectum | AD | small molecule catabolic process | 118/3918 | 376/18723 | 1.05e-06 | 3.55e-05 | 118 |
| GO:0009062 | Colorectum | AD | fatty acid catabolic process | 41/3918 | 100/18723 | 4.02e-06 | 1.09e-04 | 41 |
| GO:0016042 | Colorectum | AD | lipid catabolic process | 97/3918 | 320/18723 | 4.31e-05 | 7.56e-04 | 97 |
| GO:0006631 | Colorectum | AD | fatty acid metabolic process | 114/3918 | 390/18723 | 5.58e-05 | 9.44e-04 | 114 |
| GO:0072329 | Colorectum | AD | monocarboxylic acid catabolic process | 44/3918 | 122/18723 | 8.05e-05 | 1.28e-03 | 44 |
| GO:0016054 | Colorectum | AD | organic acid catabolic process | 73/3918 | 240/18723 | 3.20e-04 | 3.81e-03 | 73 |
| GO:0044242 | Colorectum | AD | cellular lipid catabolic process | 66/3918 | 214/18723 | 3.96e-04 | 4.50e-03 | 66 |
| GO:0046395 | Colorectum | AD | carboxylic acid catabolic process | 70/3918 | 236/18723 | 9.06e-04 | 8.71e-03 | 70 |
| GO:0046459 | Colorectum | AD | short-chain fatty acid metabolic process | 8/3918 | 15/18723 | 5.67e-03 | 3.64e-02 | 8 |
| GO:00160421 | Colorectum | SER | lipid catabolic process | 77/2897 | 320/18723 | 3.52e-05 | 9.18e-04 | 77 |
| GO:00442821 | Colorectum | SER | small molecule catabolic process | 87/2897 | 376/18723 | 5.31e-05 | 1.27e-03 | 87 |
| GO:00090621 | Colorectum | SER | fatty acid catabolic process | 31/2897 | 100/18723 | 7.09e-05 | 1.61e-03 | 31 |
| GO:00723291 | Colorectum | SER | monocarboxylic acid catabolic process | 34/2897 | 122/18723 | 3.27e-04 | 5.22e-03 | 34 |
| GO:00442421 | Colorectum | SER | cellular lipid catabolic process | 51/2897 | 214/18723 | 8.60e-04 | 1.05e-02 | 51 |
| GO:00160541 | Colorectum | SER | organic acid catabolic process | 53/2897 | 240/18723 | 4.04e-03 | 3.30e-02 | 53 |
| GO:00066311 | Colorectum | SER | fatty acid metabolic process | 79/2897 | 390/18723 | 6.34e-03 | 4.56e-02 | 79 |
| GO:00090622 | Colorectum | MSS | fatty acid catabolic process | 32/3467 | 100/18723 | 8.28e-04 | 8.67e-03 | 32 |
| GO:00442822 | Colorectum | MSS | small molecule catabolic process | 94/3467 | 376/18723 | 9.85e-04 | 9.86e-03 | 94 |
| GO:00066312 | Colorectum | MSS | fatty acid metabolic process | 95/3467 | 390/18723 | 2.20e-03 | 1.84e-02 | 95 |
| GO:00723292 | Colorectum | MSS | monocarboxylic acid catabolic process | 35/3467 | 122/18723 | 3.97e-03 | 2.90e-02 | 35 |
| Page: 1 2 3 |
| Pathway ID | Tissue | Disease Stage | Description | Gene Ratio | Bg Ratio | pvalue | p.adjust | qvalue | Count |
| hsa01200 | Colorectum | AD | Carbon metabolism | 55/2092 | 115/8465 | 5.53e-08 | 8.42e-07 | 5.37e-07 | 55 |
| hsa00280 | Colorectum | AD | Valine, leucine and isoleucine degradation | 25/2092 | 48/8465 | 3.97e-05 | 3.41e-04 | 2.18e-04 | 25 |
| hsa00640 | Colorectum | AD | Propanoate metabolism | 18/2092 | 32/8465 | 1.33e-04 | 1.11e-03 | 7.08e-04 | 18 |
| hsa00630 | Colorectum | AD | Glyoxylate and dicarboxylate metabolism | 14/2092 | 30/8465 | 7.25e-03 | 2.97e-02 | 1.89e-02 | 14 |
| hsa012001 | Colorectum | AD | Carbon metabolism | 55/2092 | 115/8465 | 5.53e-08 | 8.42e-07 | 5.37e-07 | 55 |
| hsa002801 | Colorectum | AD | Valine, leucine and isoleucine degradation | 25/2092 | 48/8465 | 3.97e-05 | 3.41e-04 | 2.18e-04 | 25 |
| hsa006401 | Colorectum | AD | Propanoate metabolism | 18/2092 | 32/8465 | 1.33e-04 | 1.11e-03 | 7.08e-04 | 18 |
| hsa006301 | Colorectum | AD | Glyoxylate and dicarboxylate metabolism | 14/2092 | 30/8465 | 7.25e-03 | 2.97e-02 | 1.89e-02 | 14 |
| hsa012002 | Colorectum | SER | Carbon metabolism | 40/1580 | 115/8465 | 2.77e-05 | 3.41e-04 | 2.47e-04 | 40 |
| hsa006402 | Colorectum | SER | Propanoate metabolism | 13/1580 | 32/8465 | 3.20e-03 | 2.12e-02 | 1.54e-02 | 13 |
| hsa012003 | Colorectum | SER | Carbon metabolism | 40/1580 | 115/8465 | 2.77e-05 | 3.41e-04 | 2.47e-04 | 40 |
| hsa006403 | Colorectum | SER | Propanoate metabolism | 13/1580 | 32/8465 | 3.20e-03 | 2.12e-02 | 1.54e-02 | 13 |
| hsa012004 | Colorectum | MSS | Carbon metabolism | 43/1875 | 115/8465 | 1.37e-04 | 1.17e-03 | 7.19e-04 | 43 |
| hsa002802 | Colorectum | MSS | Valine, leucine and isoleucine degradation | 21/1875 | 48/8465 | 6.73e-04 | 4.51e-03 | 2.76e-03 | 21 |
| hsa006404 | Colorectum | MSS | Propanoate metabolism | 15/1875 | 32/8465 | 1.68e-03 | 9.05e-03 | 5.55e-03 | 15 |
| hsa012005 | Colorectum | MSS | Carbon metabolism | 43/1875 | 115/8465 | 1.37e-04 | 1.17e-03 | 7.19e-04 | 43 |
| hsa002803 | Colorectum | MSS | Valine, leucine and isoleucine degradation | 21/1875 | 48/8465 | 6.73e-04 | 4.51e-03 | 2.76e-03 | 21 |
| hsa006405 | Colorectum | MSS | Propanoate metabolism | 15/1875 | 32/8465 | 1.68e-03 | 9.05e-03 | 5.55e-03 | 15 |
| hsa012006 | Colorectum | FAP | Carbon metabolism | 38/1404 | 115/8465 | 1.04e-05 | 1.44e-04 | 8.76e-05 | 38 |
| hsa006406 | Colorectum | FAP | Propanoate metabolism | 15/1404 | 32/8465 | 6.21e-05 | 6.10e-04 | 3.71e-04 | 15 |
| Page: 1 2 3 |
Top |
Cell-cell communication analysis |
| Identification of potential cell-cell interactions between two cell types and their ligand-receptor pairs for different disease states |
| Ligand | Receptor | LRpair | Pathway | Tissue | Disease Stage |
| Page: 1 |
Top |
Single-cell gene regulatory network inference analysis |
| Find out the significant the regulons (TFs) and the target genes of each regulon across cell types for different disease states |
| TF | Cell Type | Tissue | Disease Stage | Target Gene | RSS | Regulon Activity |
| ∗The dot plots of a searched regulon are shown for all cell subpopulations in each disease state of each tissue based on the regulon specific score inferred using pySCENIC and by calculating the average expression. |
| Page: 1 |
Top |
Somatic mutation of malignant transformation related genes |
| Annotation of somatic variants for genes involved in malignant transformation |
| Hugo Symbol | Variant Class | Variant Classification | dbSNP RS | HGVSc | HGVSp | HGVSp Short | SWISSPROT | BIOTYPE | SIFT | PolyPhen | Tumor Sample Barcode | Tissue | Histology | Sex | Age | Stage | Therapy Types | Drugs | Outcome |
| PCCA | SNV | Missense_Mutation | novel | c.1532N>A | p.Gly511Asp | p.G511D | P05165 | protein_coding | deleterious(0) | probably_damaging(0.998) | TCGA-A7-A5ZX-01 | Breast | breast invasive carcinoma | Female | <65 | III/IV | Chemotherapy | doxorubicin | CR |
| PCCA | SNV | Missense_Mutation | c.739C>G | p.Gln247Glu | p.Q247E | P05165 | protein_coding | tolerated(0.31) | benign(0.021) | TCGA-AC-A6IW-01 | Breast | breast invasive carcinoma | Female | >=65 | I/II | Unknown | Unknown | SD | |
| PCCA | SNV | Missense_Mutation | novel | c.2158G>A | p.Glu720Lys | p.E720K | P05165 | protein_coding | tolerated(0.36) | probably_damaging(0.933) | TCGA-PE-A5DE-01 | Breast | breast invasive carcinoma | Female | <65 | I/II | Chemotherapy | taxotere | CR |
| PCCA | insertion | Frame_Shift_Ins | novel | c.151_152insCCAGC | p.Leu51ProfsTer55 | p.L51Pfs*55 | P05165 | protein_coding | TCGA-AR-A0U0-01 | Breast | breast invasive carcinoma | Female | >=65 | I/II | Unknown | Unknown | SD | ||
| PCCA | insertion | Frame_Shift_Ins | novel | c.152_153insACTCAGGAGGCTGAGG | p.Gly52LeufsTer11 | p.G52Lfs*11 | P05165 | protein_coding | TCGA-AR-A0U0-01 | Breast | breast invasive carcinoma | Female | >=65 | I/II | Unknown | Unknown | SD | ||
| PCCA | SNV | Missense_Mutation | novel | c.1349N>T | p.Ser450Leu | p.S450L | P05165 | protein_coding | deleterious(0) | probably_damaging(0.959) | TCGA-IR-A3LK-01 | Cervix | cervical & endocervical cancer | Female | >=65 | I/II | Chemotherapy | cisplatin | PD |
| PCCA | SNV | Missense_Mutation | novel | c.1544N>C | p.His515Pro | p.H515P | P05165 | protein_coding | tolerated(0.36) | possibly_damaging(0.535) | TCGA-MY-A913-01 | Cervix | cervical & endocervical cancer | Female | <65 | I/II | Chemotherapy | cisplatin | CR |
| PCCA | SNV | Missense_Mutation | rs747943045 | c.689N>A | p.Arg230His | p.R230H | P05165 | protein_coding | deleterious(0) | probably_damaging(0.992) | TCGA-5M-AAT6-01 | Colorectum | colon adenocarcinoma | Female | <65 | III/IV | Unknown | Unknown | PD |
| PCCA | SNV | Missense_Mutation | c.1943A>C | p.Lys648Thr | p.K648T | P05165 | protein_coding | tolerated(0.08) | benign(0.13) | TCGA-A6-6141-01 | Colorectum | colon adenocarcinoma | Male | <65 | I/II | Chemotherapy | 5-fu | SD | |
| PCCA | SNV | Missense_Mutation | rs368047060 | c.803G>A | p.Arg268His | p.R268H | P05165 | protein_coding | deleterious(0.01) | probably_damaging(0.94) | TCGA-AA-3710-01 | Colorectum | colon adenocarcinoma | Female | >=65 | I/II | Unknown | Unknown | SD |
| Page: 1 2 3 4 5 6 7 8 9 10 |
Top |
Related drugs of malignant transformation related genes |
| Identification of chemicals and drugs interact with genes involved in malignant transfromation |
| (DGIdb 4.0) |
| Entrez ID | Symbol | Category | Interaction Types | Drug Claim Name | Drug Name | PMIDs |
| Page: 1 |

Copyright 2023-Present -The University of Texas Health Science Center at Houston |