
|
|||||
|
 | |
| |
| |
| |
| |
| |
|
Gene: PCBP4 |
Gene summary for PCBP4 |
| Gene information | Species | Human | Gene symbol | PCBP4 | Gene ID | 57060 |
| Gene name | poly(rC) binding protein 4 | |
| Gene Alias | CBP | |
| Cytomap | 3p21.2 | |
| Gene Type | protein-coding | GO ID | GO:0000375 | UniProtAcc | A0A024R320 |
Top |
Malignant transformation analysis |
| Identification of the aberrant gene expression in precancerous and cancerous lesions by comparing the gene expression of stem-like cells in diseased tissues with normal stem cells |
| Entrez ID | Symbol | Replicates | Species | Organ | Tissue | Adj P-value | Log2FC | Malignancy |
| 57060 | PCBP4 | LZE24T | Human | Esophagus | ESCC | 2.85e-02 | 1.22e-01 | 0.0596 |
| 57060 | PCBP4 | P8T-E | Human | Esophagus | ESCC | 9.20e-06 | 8.12e-02 | 0.0889 |
| 57060 | PCBP4 | P10T-E | Human | Esophagus | ESCC | 6.77e-14 | 2.31e-01 | 0.116 |
| 57060 | PCBP4 | P11T-E | Human | Esophagus | ESCC | 1.99e-10 | 5.99e-01 | 0.1426 |
| 57060 | PCBP4 | P12T-E | Human | Esophagus | ESCC | 3.89e-12 | 2.21e-01 | 0.1122 |
| 57060 | PCBP4 | P16T-E | Human | Esophagus | ESCC | 2.95e-17 | 3.43e-01 | 0.1153 |
| 57060 | PCBP4 | P17T-E | Human | Esophagus | ESCC | 1.23e-02 | 4.63e-01 | 0.1278 |
| 57060 | PCBP4 | P19T-E | Human | Esophagus | ESCC | 7.76e-10 | 9.00e-01 | 0.1662 |
| 57060 | PCBP4 | P20T-E | Human | Esophagus | ESCC | 1.38e-03 | 1.82e-01 | 0.1124 |
| 57060 | PCBP4 | P21T-E | Human | Esophagus | ESCC | 6.75e-18 | 3.84e-01 | 0.1617 |
| 57060 | PCBP4 | P22T-E | Human | Esophagus | ESCC | 1.96e-05 | 1.08e-01 | 0.1236 |
| 57060 | PCBP4 | P24T-E | Human | Esophagus | ESCC | 3.50e-18 | 4.45e-01 | 0.1287 |
| 57060 | PCBP4 | P26T-E | Human | Esophagus | ESCC | 7.31e-14 | 2.31e-01 | 0.1276 |
| 57060 | PCBP4 | P27T-E | Human | Esophagus | ESCC | 1.69e-04 | 9.90e-02 | 0.1055 |
| 57060 | PCBP4 | P28T-E | Human | Esophagus | ESCC | 8.40e-04 | 9.19e-02 | 0.1149 |
| 57060 | PCBP4 | P30T-E | Human | Esophagus | ESCC | 5.76e-04 | 2.35e-01 | 0.137 |
| 57060 | PCBP4 | P31T-E | Human | Esophagus | ESCC | 2.02e-06 | 1.40e-01 | 0.1251 |
| 57060 | PCBP4 | P32T-E | Human | Esophagus | ESCC | 1.77e-22 | 4.84e-01 | 0.1666 |
| 57060 | PCBP4 | P36T-E | Human | Esophagus | ESCC | 8.04e-04 | 2.07e-01 | 0.1187 |
| 57060 | PCBP4 | P38T-E | Human | Esophagus | ESCC | 4.83e-02 | 2.14e-01 | 0.127 |
| Page: 1 2 3 4 |
| Tissue | Expression Dynamics | Abbreviation |
| Esophagus | 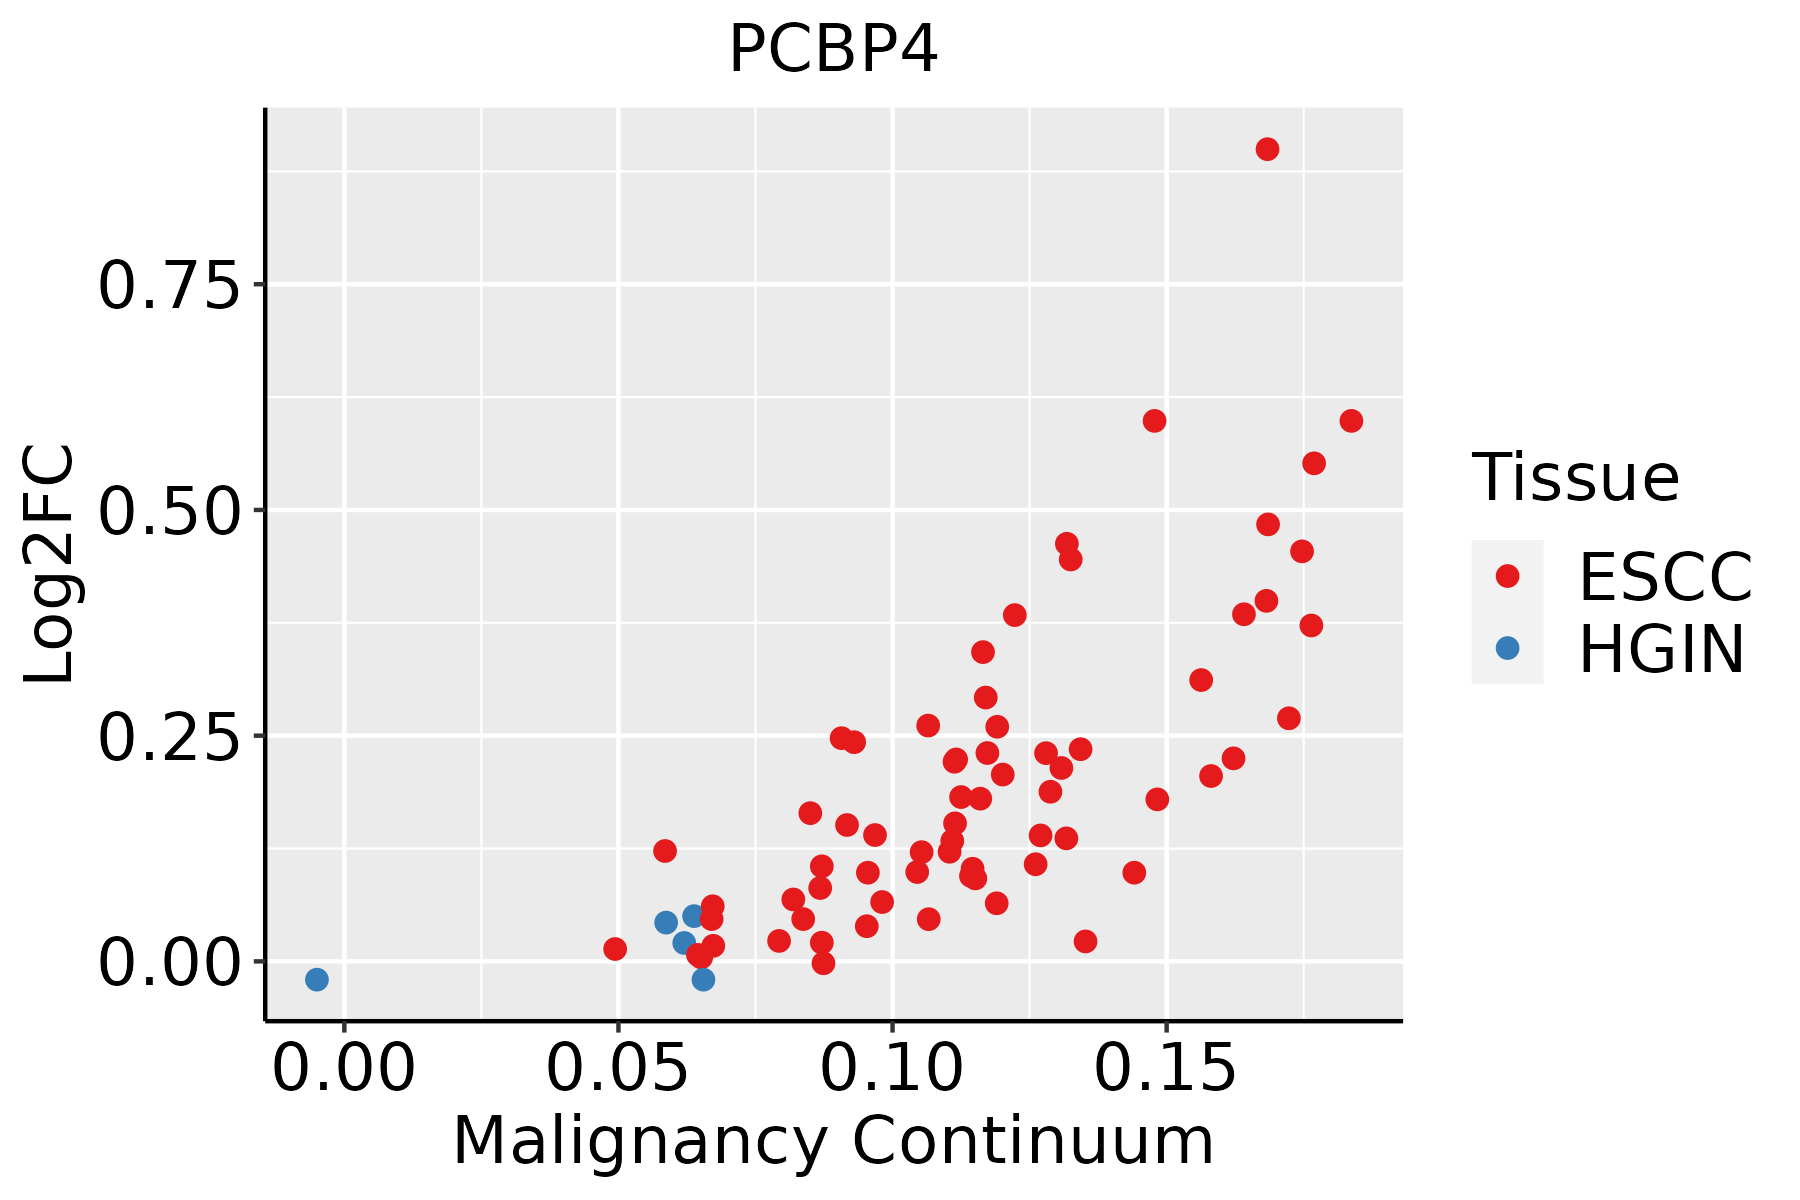 | ESCC: Esophageal squamous cell carcinoma |
| HGIN: High-grade intraepithelial neoplasias | ||
| LGIN: Low-grade intraepithelial neoplasias | ||
| Liver | 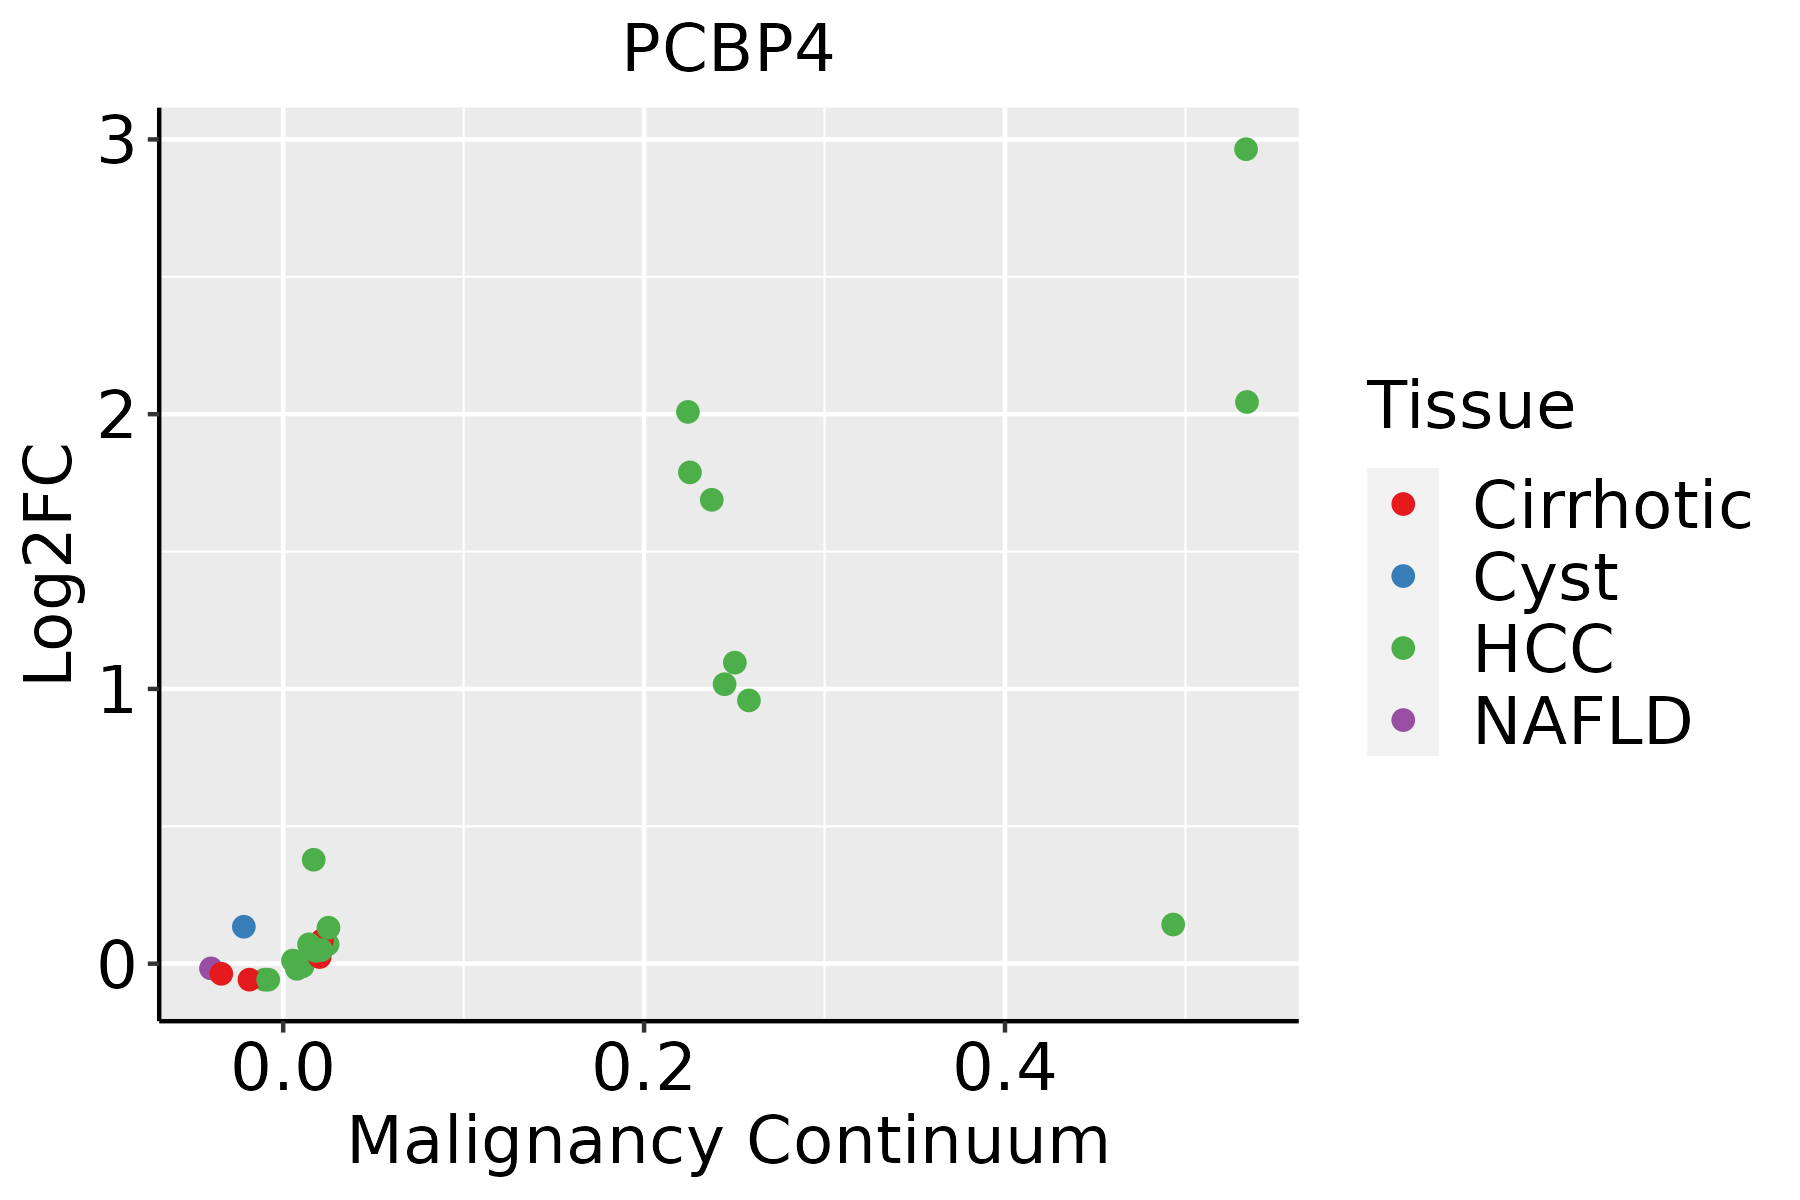 | HCC: Hepatocellular carcinoma |
| NAFLD: Non-alcoholic fatty liver disease | ||
| Thyroid |  | ATC: Anaplastic thyroid cancer |
| HT: Hashimoto's thyroiditis | ||
| PTC: Papillary thyroid cancer |
| ∗log2FC in expression of this searched gene in stem-like cells from each diseased tissue sample relative to stem-like cells in normal samples in each tissue plotted against the malignancy continuum. Samples are colored based on if they are from different disease stage. |
Top |
Malignant transformation related pathway analysis |
| Find out the enriched GO biological processes and KEGG pathways involved in transition from healthy to precancer to cancer |
| Tissue | Disease Stage | Enriched GO biological Processes |
| Colorectum | AD |  |
| Colorectum | SER |  |
| Colorectum | MSS |  |
| Colorectum | MSI-H |  |
| Colorectum | FAP |  |
| ∗Top 15 enriched GO BP terms are showed in the bar plot of each disease state in each tissue. Each row represents a significant GO biological process which is colored according to the -log10(p.adjust). |
| Page: 1 2 3 4 5 6 7 8 9 |
| GO ID | Tissue | Disease Stage | Description | Gene Ratio | Bg Ratio | pvalue | p.adjust | Count |
| GO:0008380111 | Esophagus | ESCC | RNA splicing | 336/8552 | 434/18723 | 1.74e-42 | 3.67e-39 | 336 |
| GO:0000375111 | Esophagus | ESCC | RNA splicing, via transesterification reactions | 248/8552 | 324/18723 | 3.05e-30 | 1.49e-27 | 248 |
| GO:0000377111 | Esophagus | ESCC | RNA splicing, via transesterification reactions with bulged adenosine as nucleophile | 244/8552 | 320/18723 | 2.52e-29 | 1.07e-26 | 244 |
| GO:0000398111 | Esophagus | ESCC | mRNA splicing, via spliceosome | 244/8552 | 320/18723 | 2.52e-29 | 1.07e-26 | 244 |
| GO:1903311110 | Esophagus | ESCC | regulation of mRNA metabolic process | 210/8552 | 288/18723 | 3.25e-21 | 5.56e-19 | 210 |
| GO:0006401110 | Esophagus | ESCC | RNA catabolic process | 204/8552 | 278/18723 | 3.39e-21 | 5.66e-19 | 204 |
| GO:0034655110 | Esophagus | ESCC | nucleobase-containing compound catabolic process | 272/8552 | 407/18723 | 2.92e-18 | 2.90e-16 | 272 |
| GO:0006402110 | Esophagus | ESCC | mRNA catabolic process | 170/8552 | 232/18723 | 8.70e-18 | 8.00e-16 | 170 |
| GO:0043484111 | Esophagus | ESCC | regulation of RNA splicing | 116/8552 | 148/18723 | 3.18e-16 | 2.38e-14 | 116 |
| GO:0050684110 | Esophagus | ESCC | regulation of mRNA processing | 109/8552 | 137/18723 | 3.51e-16 | 2.59e-14 | 109 |
| GO:004670018 | Esophagus | ESCC | heterocycle catabolic process | 286/8552 | 445/18723 | 1.12e-15 | 7.47e-14 | 286 |
| GO:004427019 | Esophagus | ESCC | cellular nitrogen compound catabolic process | 288/8552 | 451/18723 | 3.03e-15 | 1.79e-13 | 288 |
| GO:001943918 | Esophagus | ESCC | aromatic compound catabolic process | 295/8552 | 467/18723 | 1.09e-14 | 5.98e-13 | 295 |
| GO:190136118 | Esophagus | ESCC | organic cyclic compound catabolic process | 307/8552 | 495/18723 | 9.99e-14 | 4.80e-12 | 307 |
| GO:0048024111 | Esophagus | ESCC | regulation of mRNA splicing, via spliceosome | 78/8552 | 101/18723 | 8.72e-11 | 2.66e-09 | 78 |
| GO:006101319 | Esophagus | ESCC | regulation of mRNA catabolic process | 115/8552 | 166/18723 | 5.90e-10 | 1.49e-08 | 115 |
| GO:004348719 | Esophagus | ESCC | regulation of RNA stability | 117/8552 | 170/18723 | 7.91e-10 | 1.94e-08 | 117 |
| GO:004348819 | Esophagus | ESCC | regulation of mRNA stability | 109/8552 | 158/18723 | 2.40e-09 | 5.35e-08 | 109 |
| GO:005068615 | Esophagus | ESCC | negative regulation of mRNA processing | 26/8552 | 29/18723 | 8.98e-07 | 1.15e-05 | 26 |
| GO:0033119111 | Esophagus | ESCC | negative regulation of RNA splicing | 22/8552 | 25/18723 | 1.33e-05 | 1.21e-04 | 22 |
| Page: 1 2 3 4 5 |
| Pathway ID | Tissue | Disease Stage | Description | Gene Ratio | Bg Ratio | pvalue | p.adjust | qvalue | Count |
| Page: 1 |
Top |
Cell-cell communication analysis |
| Identification of potential cell-cell interactions between two cell types and their ligand-receptor pairs for different disease states |
| Ligand | Receptor | LRpair | Pathway | Tissue | Disease Stage |
| Page: 1 |
Top |
Single-cell gene regulatory network inference analysis |
| Find out the significant the regulons (TFs) and the target genes of each regulon across cell types for different disease states |
| TF | Cell Type | Tissue | Disease Stage | Target Gene | RSS | Regulon Activity |
| ∗The dot plots of a searched regulon are shown for all cell subpopulations in each disease state of each tissue based on the regulon specific score inferred using pySCENIC and by calculating the average expression. |
| Page: 1 |
Top |
Somatic mutation of malignant transformation related genes |
| Annotation of somatic variants for genes involved in malignant transformation |
| Hugo Symbol | Variant Class | Variant Classification | dbSNP RS | HGVSc | HGVSp | HGVSp Short | SWISSPROT | BIOTYPE | SIFT | PolyPhen | Tumor Sample Barcode | Tissue | Histology | Sex | Age | Stage | Therapy Types | Drugs | Outcome |
| PCBP4 | SNV | Missense_Mutation | rs753153356 | c.776N>A | p.Arg259His | p.R259H | P57723 | protein_coding | deleterious(0.03) | probably_damaging(0.998) | TCGA-D8-A27V-01 | Breast | breast invasive carcinoma | Female | <65 | I/II | Hormone Therapy | tamoxiphen | SD |
| PCBP4 | insertion | Nonsense_Mutation | novel | c.124_125insACTTTCTCTCTGAACCACTCCTTCTGGGCTGACCAGTGAGTCCCCCA | p.Arg42HisfsTer11 | p.R42Hfs*11 | P57723 | protein_coding | TCGA-A8-A095-01 | Breast | breast invasive carcinoma | Female | <65 | I/II | Chemotherapy | 5-fluorouracil | CR | ||
| PCBP4 | SNV | Missense_Mutation | rs773787182 | c.691N>A | p.Val231Met | p.V231M | P57723 | protein_coding | tolerated(0.34) | benign(0.012) | TCGA-AA-3509-01 | Colorectum | colon adenocarcinoma | Female | <65 | I/II | Unknown | Unknown | SD |
| PCBP4 | SNV | Missense_Mutation | rs746354848 | c.502G>A | p.Ala168Thr | p.A168T | P57723 | protein_coding | tolerated(0.49) | benign(0.006) | TCGA-D5-6920-01 | Colorectum | colon adenocarcinoma | Female | >=65 | I/II | Unknown | Unknown | SD |
| PCBP4 | SNV | Missense_Mutation | c.236T>C | p.Ile79Thr | p.I79T | P57723 | protein_coding | deleterious(0) | possibly_damaging(0.877) | TCGA-DM-A280-01 | Colorectum | colon adenocarcinoma | Female | >=65 | I/II | Unknown | Unknown | SD | |
| PCBP4 | insertion | Frame_Shift_Ins | novel | c.605_606insAGAG | p.Gly203GlufsTer11 | p.G203Efs*11 | P57723 | protein_coding | TCGA-AM-5820-01 | Colorectum | colon adenocarcinoma | Female | <65 | I/II | Unknown | Unknown | SD | ||
| PCBP4 | SNV | Missense_Mutation | novel | c.135N>T | p.Glu45Asp | p.E45D | P57723 | protein_coding | deleterious(0.04) | probably_damaging(0.949) | TCGA-A5-A0G1-01 | Endometrium | uterine corpus endometrioid carcinoma | Female | >=65 | I/II | Unknown | Unknown | SD |
| PCBP4 | SNV | Missense_Mutation | c.895G>A | p.Ala299Thr | p.A299T | P57723 | protein_coding | tolerated(0.19) | benign(0.007) | TCGA-AJ-A3EK-01 | Endometrium | uterine corpus endometrioid carcinoma | Female | <65 | I/II | Chemotherapy | carboplatin | CR | |
| PCBP4 | SNV | Missense_Mutation | rs770277994 | c.973N>A | p.Ala325Thr | p.A325T | P57723 | protein_coding | tolerated(0.35) | benign(0) | TCGA-AP-A0LT-01 | Endometrium | uterine corpus endometrioid carcinoma | Female | <65 | I/II | Unknown | Unknown | SD |
| PCBP4 | SNV | Missense_Mutation | novel | c.62G>A | p.Arg21Gln | p.R21Q | P57723 | protein_coding | deleterious(0.04) | probably_damaging(0.987) | TCGA-AP-A1DK-01 | Endometrium | uterine corpus endometrioid carcinoma | Female | <65 | I/II | Unknown | Unknown | SD |
| Page: 1 2 3 |
Top |
Related drugs of malignant transformation related genes |
| Identification of chemicals and drugs interact with genes involved in malignant transfromation |
| (DGIdb 4.0) |
| Entrez ID | Symbol | Category | Interaction Types | Drug Claim Name | Drug Name | PMIDs |
| Page: 1 |

Copyright 2023-Present -The University of Texas Health Science Center at Houston |