
|
|||||
|
 | |
| |
| |
| |
| |
| |
|
Gene: PCBP1 |
Gene summary for PCBP1 |
| Gene information | Species | Human | Gene symbol | PCBP1 | Gene ID | 5093 |
| Gene name | poly(rC) binding protein 1 | |
| Gene Alias | HEL-S-85 | |
| Cytomap | 2p13.3 | |
| Gene Type | protein-coding | GO ID | GO:0006139 | UniProtAcc | Q15365 |
Top |
Malignant transformation analysis |
| Identification of the aberrant gene expression in precancerous and cancerous lesions by comparing the gene expression of stem-like cells in diseased tissues with normal stem cells |
| Entrez ID | Symbol | Replicates | Species | Organ | Tissue | Adj P-value | Log2FC | Malignancy |
| 5093 | PCBP1 | GSM4909282 | Human | Breast | IDC | 1.81e-25 | 5.67e-01 | -0.0288 |
| 5093 | PCBP1 | GSM4909285 | Human | Breast | IDC | 1.69e-04 | -9.21e-02 | 0.21 |
| 5093 | PCBP1 | GSM4909286 | Human | Breast | IDC | 7.89e-13 | -2.33e-01 | 0.1081 |
| 5093 | PCBP1 | GSM4909287 | Human | Breast | IDC | 5.63e-04 | 1.41e-01 | 0.2057 |
| 5093 | PCBP1 | GSM4909288 | Human | Breast | IDC | 4.73e-03 | -2.85e-01 | 0.0988 |
| 5093 | PCBP1 | GSM4909294 | Human | Breast | IDC | 1.15e-03 | -2.64e-01 | 0.2022 |
| 5093 | PCBP1 | GSM4909296 | Human | Breast | IDC | 6.78e-11 | -2.28e-01 | 0.1524 |
| 5093 | PCBP1 | GSM4909297 | Human | Breast | IDC | 5.29e-26 | -4.30e-01 | 0.1517 |
| 5093 | PCBP1 | GSM4909301 | Human | Breast | IDC | 6.72e-11 | 2.75e-01 | 0.1577 |
| 5093 | PCBP1 | GSM4909304 | Human | Breast | IDC | 8.70e-09 | 3.35e-01 | 0.1636 |
| 5093 | PCBP1 | GSM4909309 | Human | Breast | IDC | 4.01e-04 | -1.12e-01 | 0.0483 |
| 5093 | PCBP1 | GSM4909311 | Human | Breast | IDC | 4.87e-44 | -4.74e-01 | 0.1534 |
| 5093 | PCBP1 | GSM4909312 | Human | Breast | IDC | 1.89e-18 | -3.80e-01 | 0.1552 |
| 5093 | PCBP1 | GSM4909313 | Human | Breast | IDC | 1.54e-03 | -2.01e-01 | 0.0391 |
| 5093 | PCBP1 | GSM4909316 | Human | Breast | IDC | 1.71e-02 | -2.69e-01 | 0.21 |
| 5093 | PCBP1 | GSM4909319 | Human | Breast | IDC | 2.98e-61 | -5.11e-01 | 0.1563 |
| 5093 | PCBP1 | GSM4909320 | Human | Breast | IDC | 1.44e-07 | -2.29e-01 | 0.1575 |
| 5093 | PCBP1 | GSM4909321 | Human | Breast | IDC | 1.30e-22 | -2.01e-01 | 0.1559 |
| 5093 | PCBP1 | ctrl6 | Human | Breast | Precancer | 2.89e-10 | 4.80e-01 | -0.0061 |
| 5093 | PCBP1 | brca3 | Human | Breast | Precancer | 1.89e-05 | 2.34e-01 | -0.0263 |
| Page: 1 2 3 4 5 6 7 8 9 10 11 12 13 14 |
| Tissue | Expression Dynamics | Abbreviation |
| Breast |  | IDC: Invasive ductal carcinoma |
| DCIS: Ductal carcinoma in situ | ||
| Precancer(BRCA1-mut): Precancerous lesion from BRCA1 mutation carriers | ||
| Cervix | 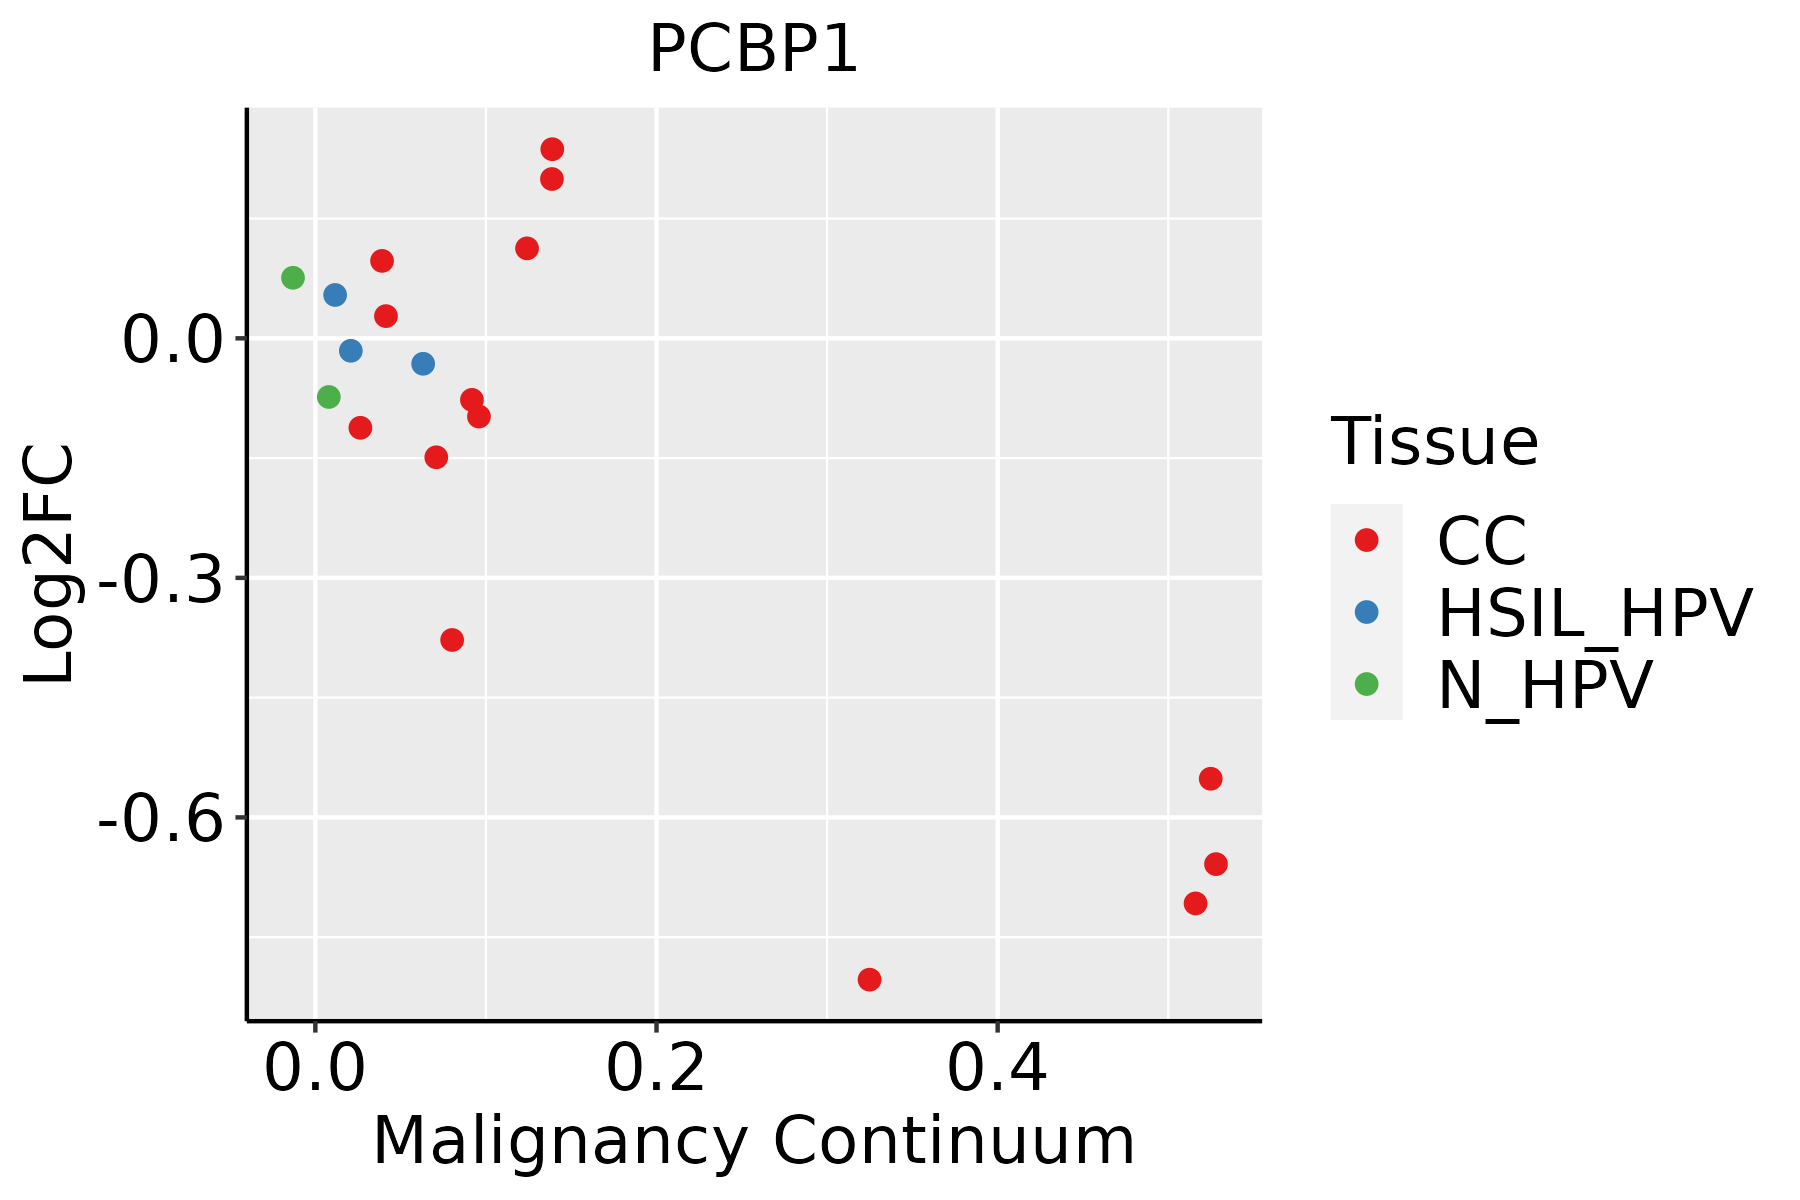 | CC: Cervix cancer |
| HSIL_HPV: HPV-infected high-grade squamous intraepithelial lesions | ||
| N_HPV: HPV-infected normal cervix | ||
| Endometrium | 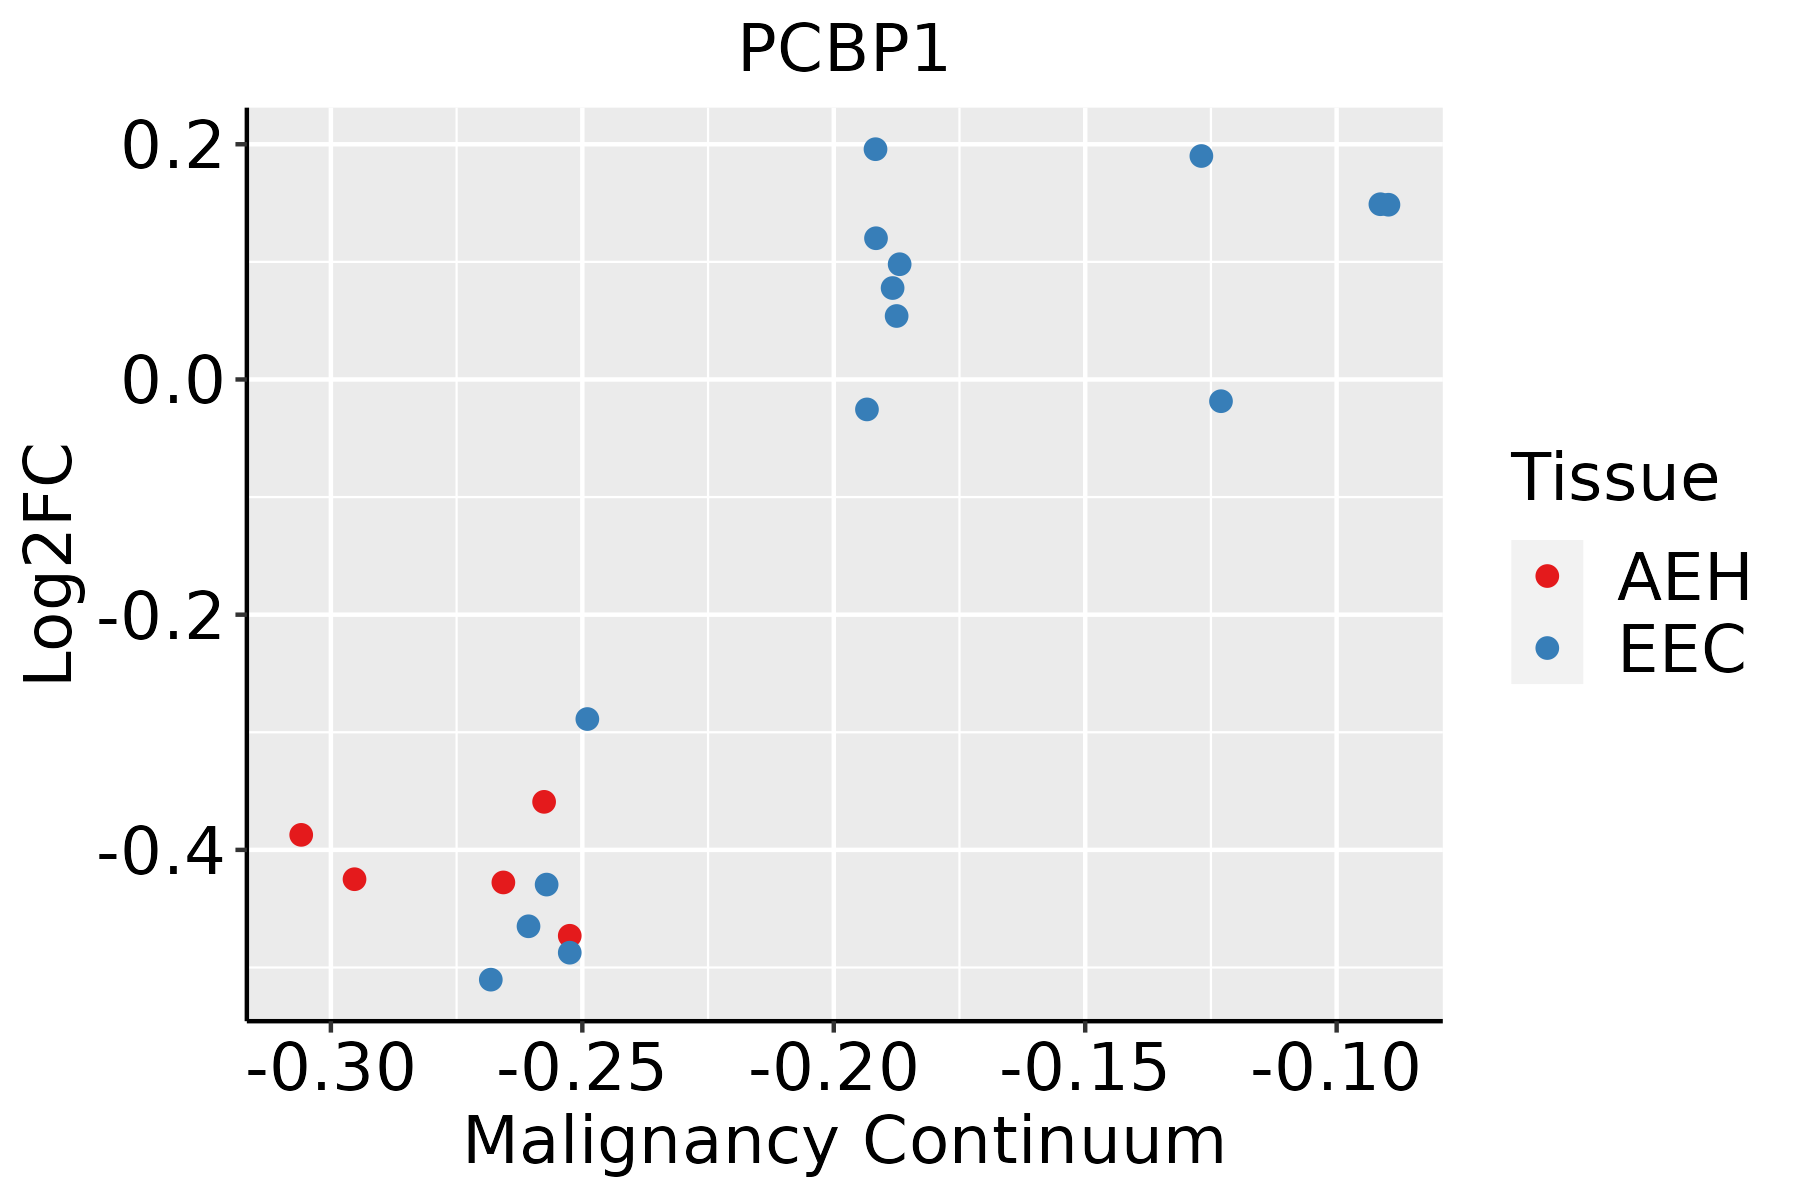 | AEH: Atypical endometrial hyperplasia |
| EEC: Endometrioid Cancer | ||
| Esophagus | 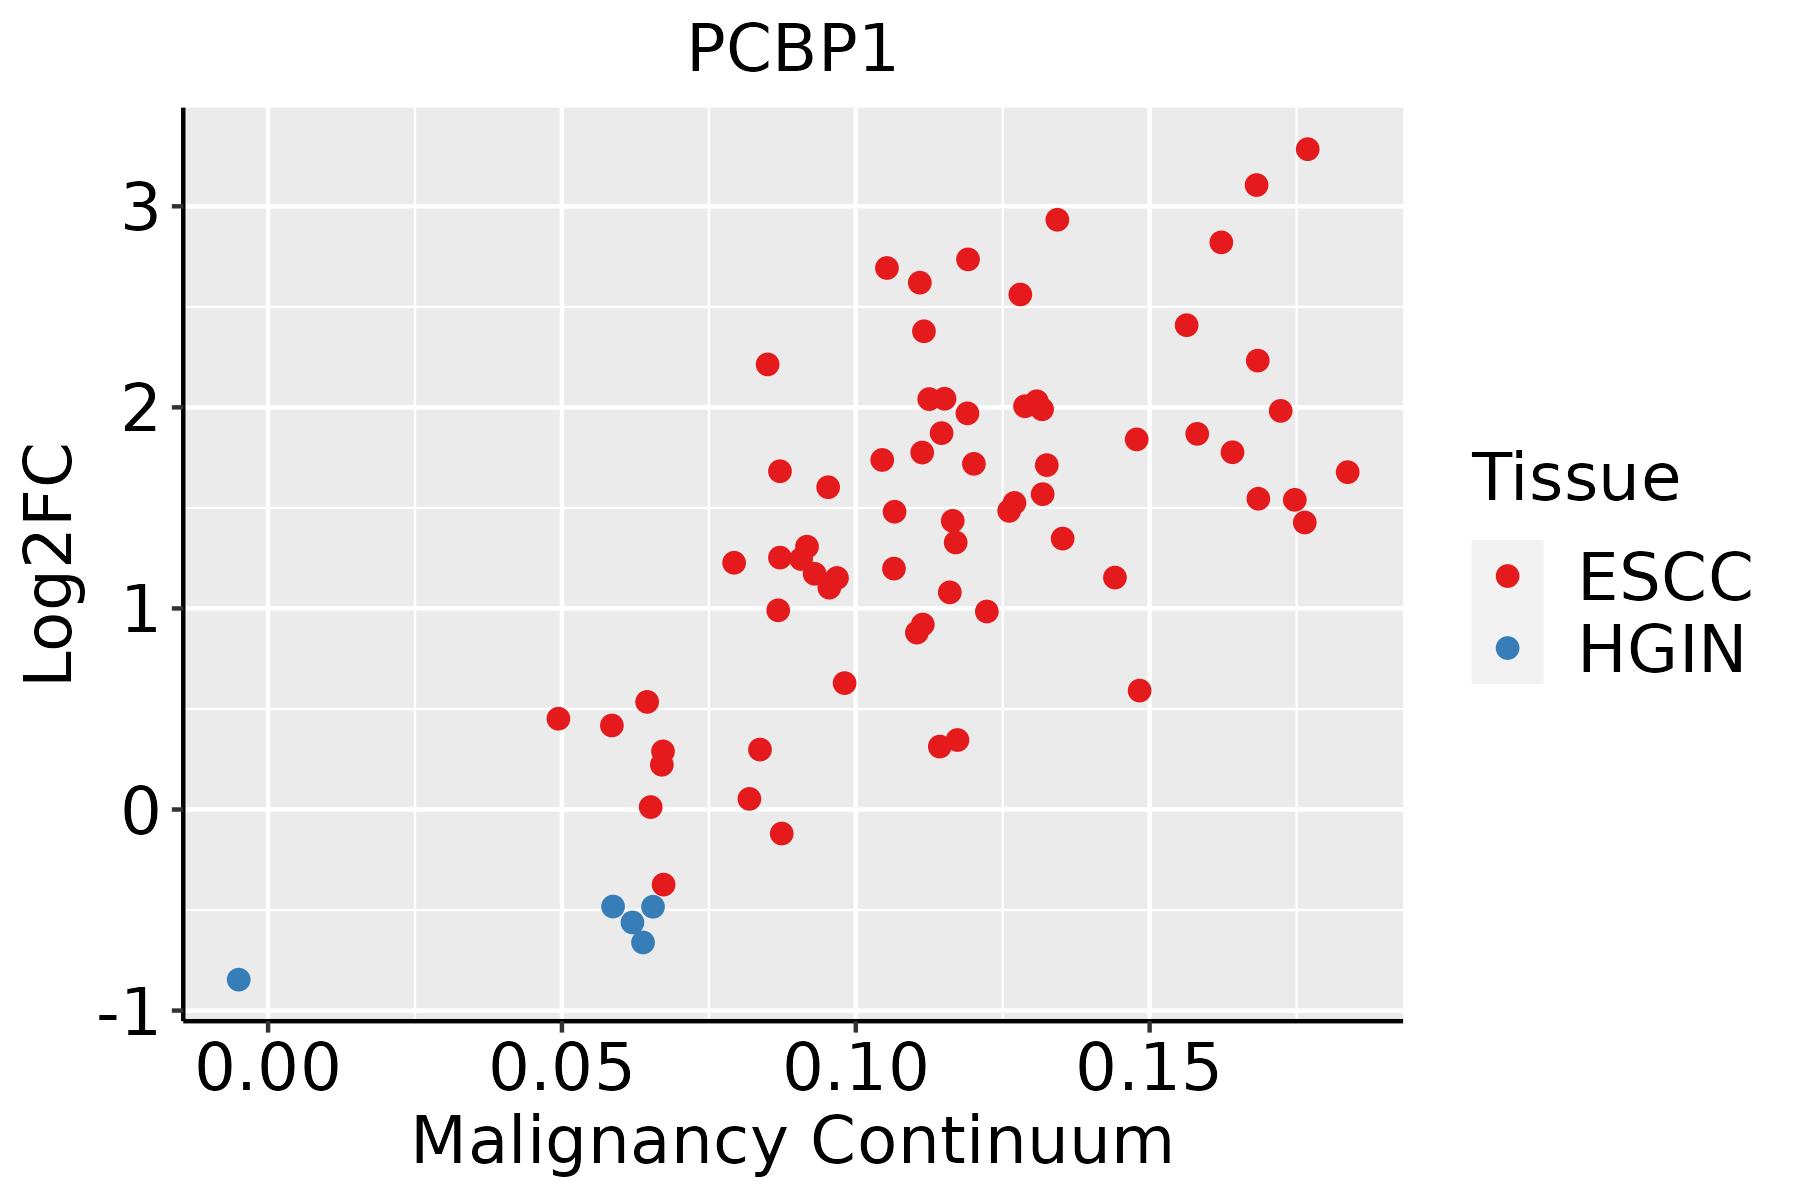 | ESCC: Esophageal squamous cell carcinoma |
| HGIN: High-grade intraepithelial neoplasias | ||
| LGIN: Low-grade intraepithelial neoplasias | ||
| GC | 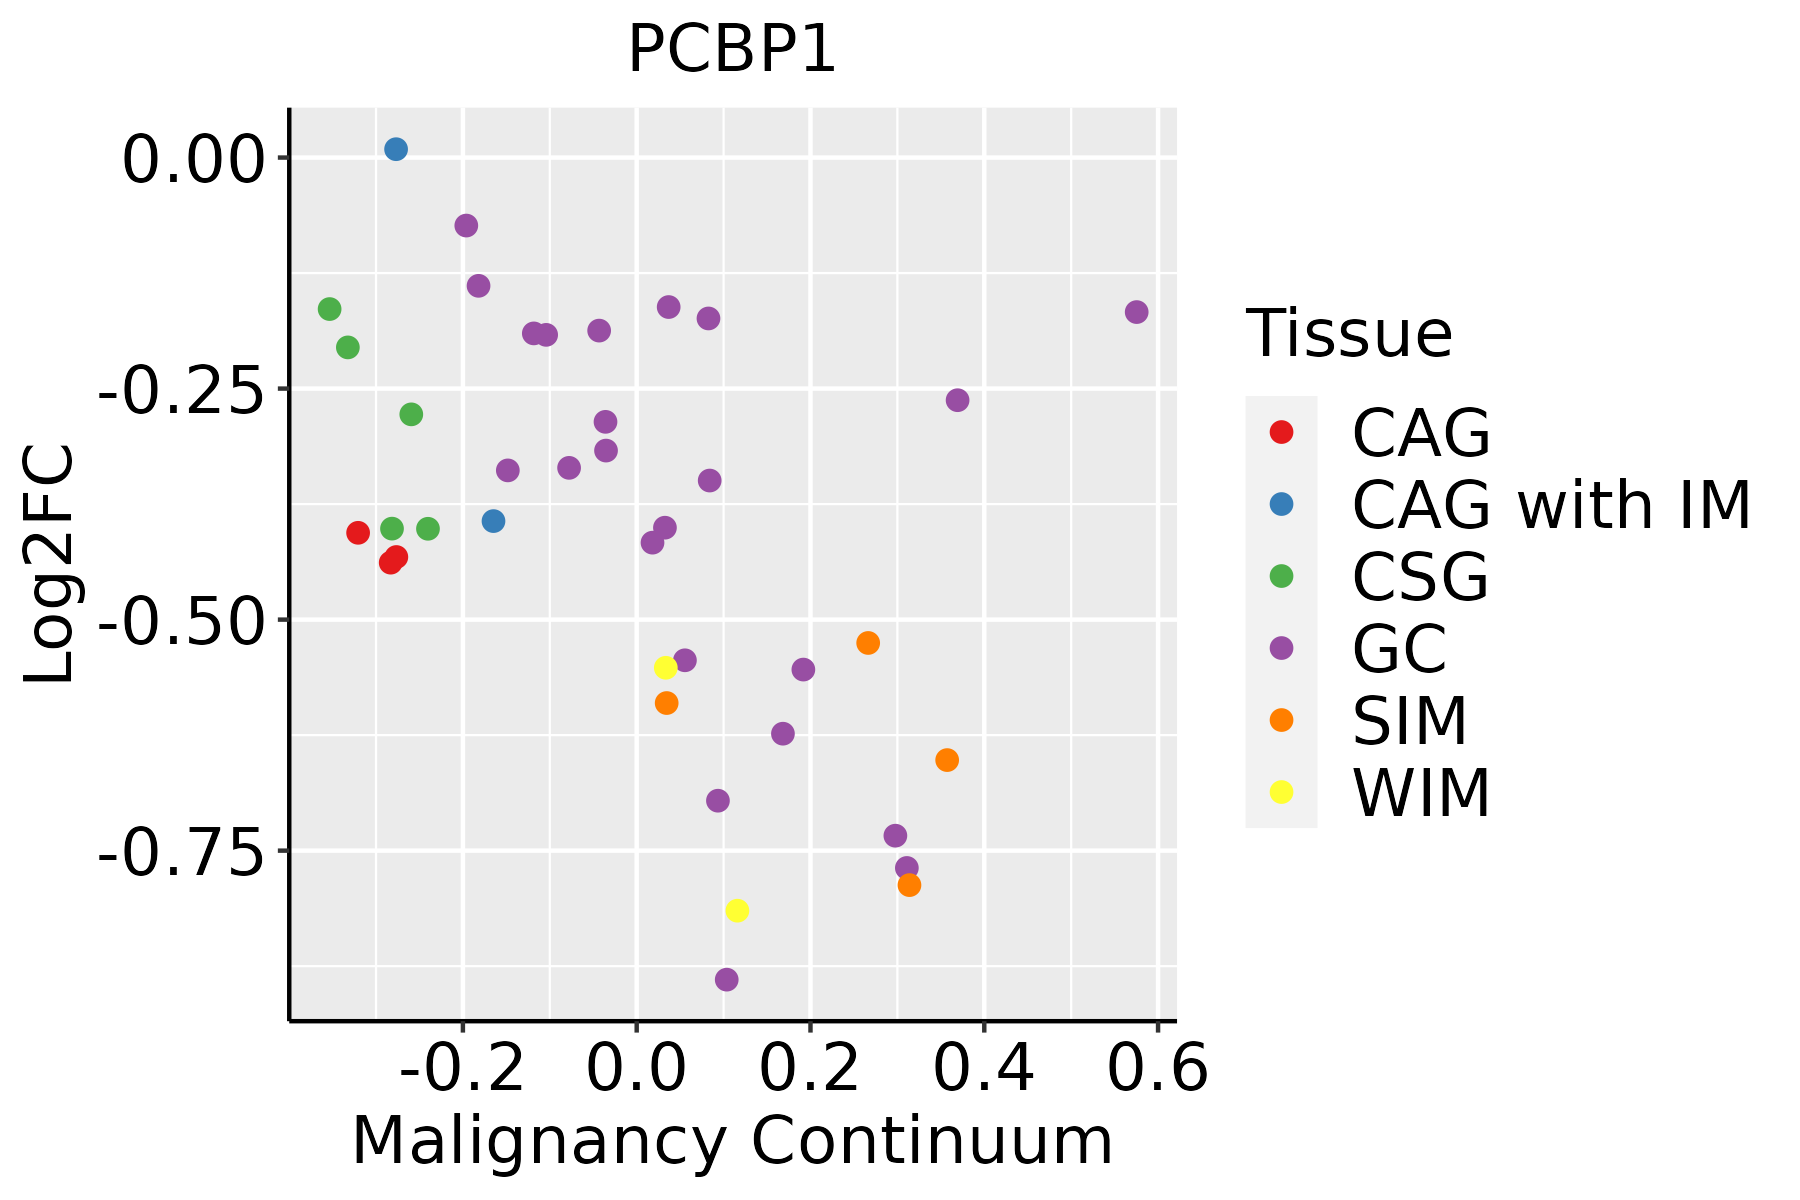 | CAG: Chronic atrophic gastritis |
| CAG with IM: Chronic atrophic gastritis with intestinal metaplasia | ||
| CSG: Chronic superficial gastritis | ||
| GC: Gastric cancer | ||
| SIM: Severe intestinal metaplasia | ||
| WIM: Wild intestinal metaplasia | ||
| Liver |  | HCC: Hepatocellular carcinoma |
| NAFLD: Non-alcoholic fatty liver disease | ||
| Lung | 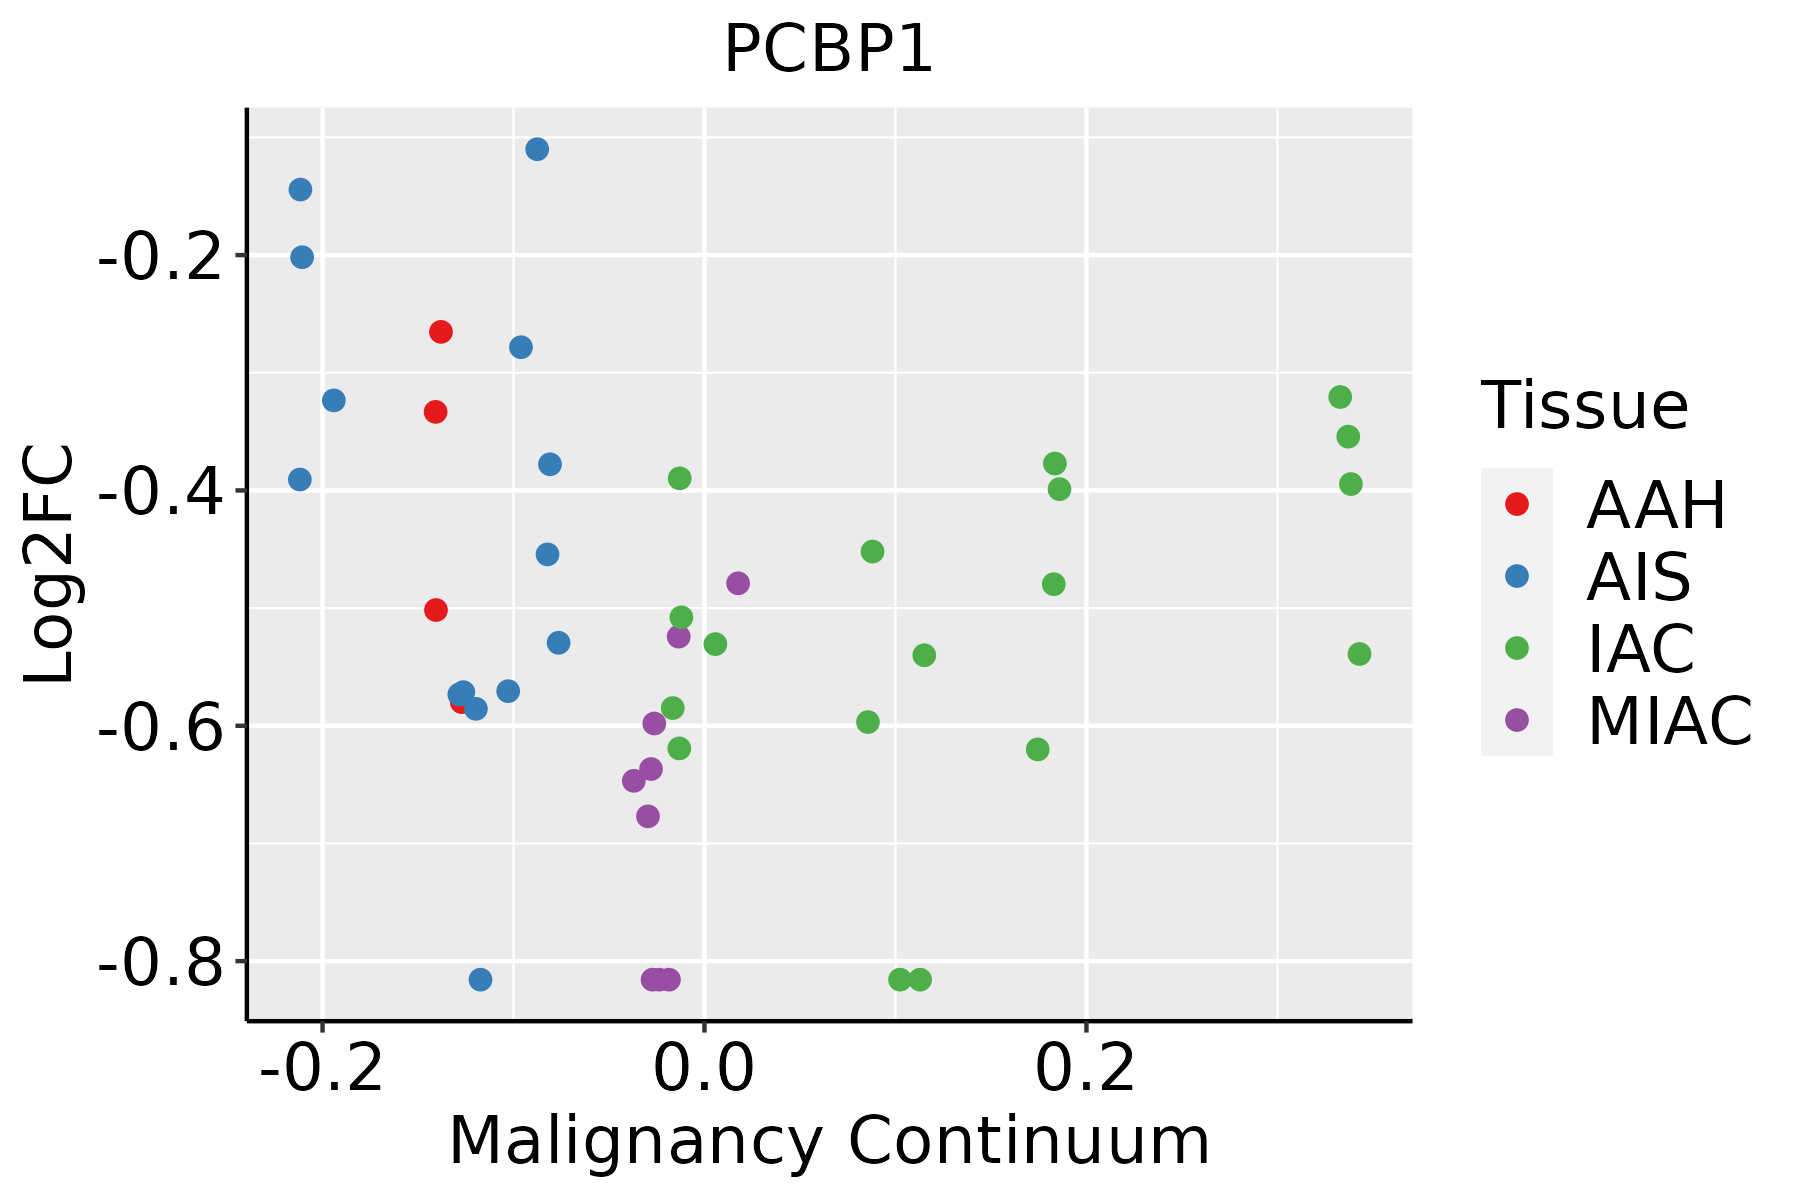 | AAH: Atypical adenomatous hyperplasia |
| AIS: Adenocarcinoma in situ | ||
| IAC: Invasive lung adenocarcinoma | ||
| MIA: Minimally invasive adenocarcinoma | ||
| Oral Cavity |  | EOLP: Erosive Oral lichen planus |
| LP: leukoplakia | ||
| NEOLP: Non-erosive oral lichen planus | ||
| OSCC: Oral squamous cell carcinoma | ||
| Prostate | 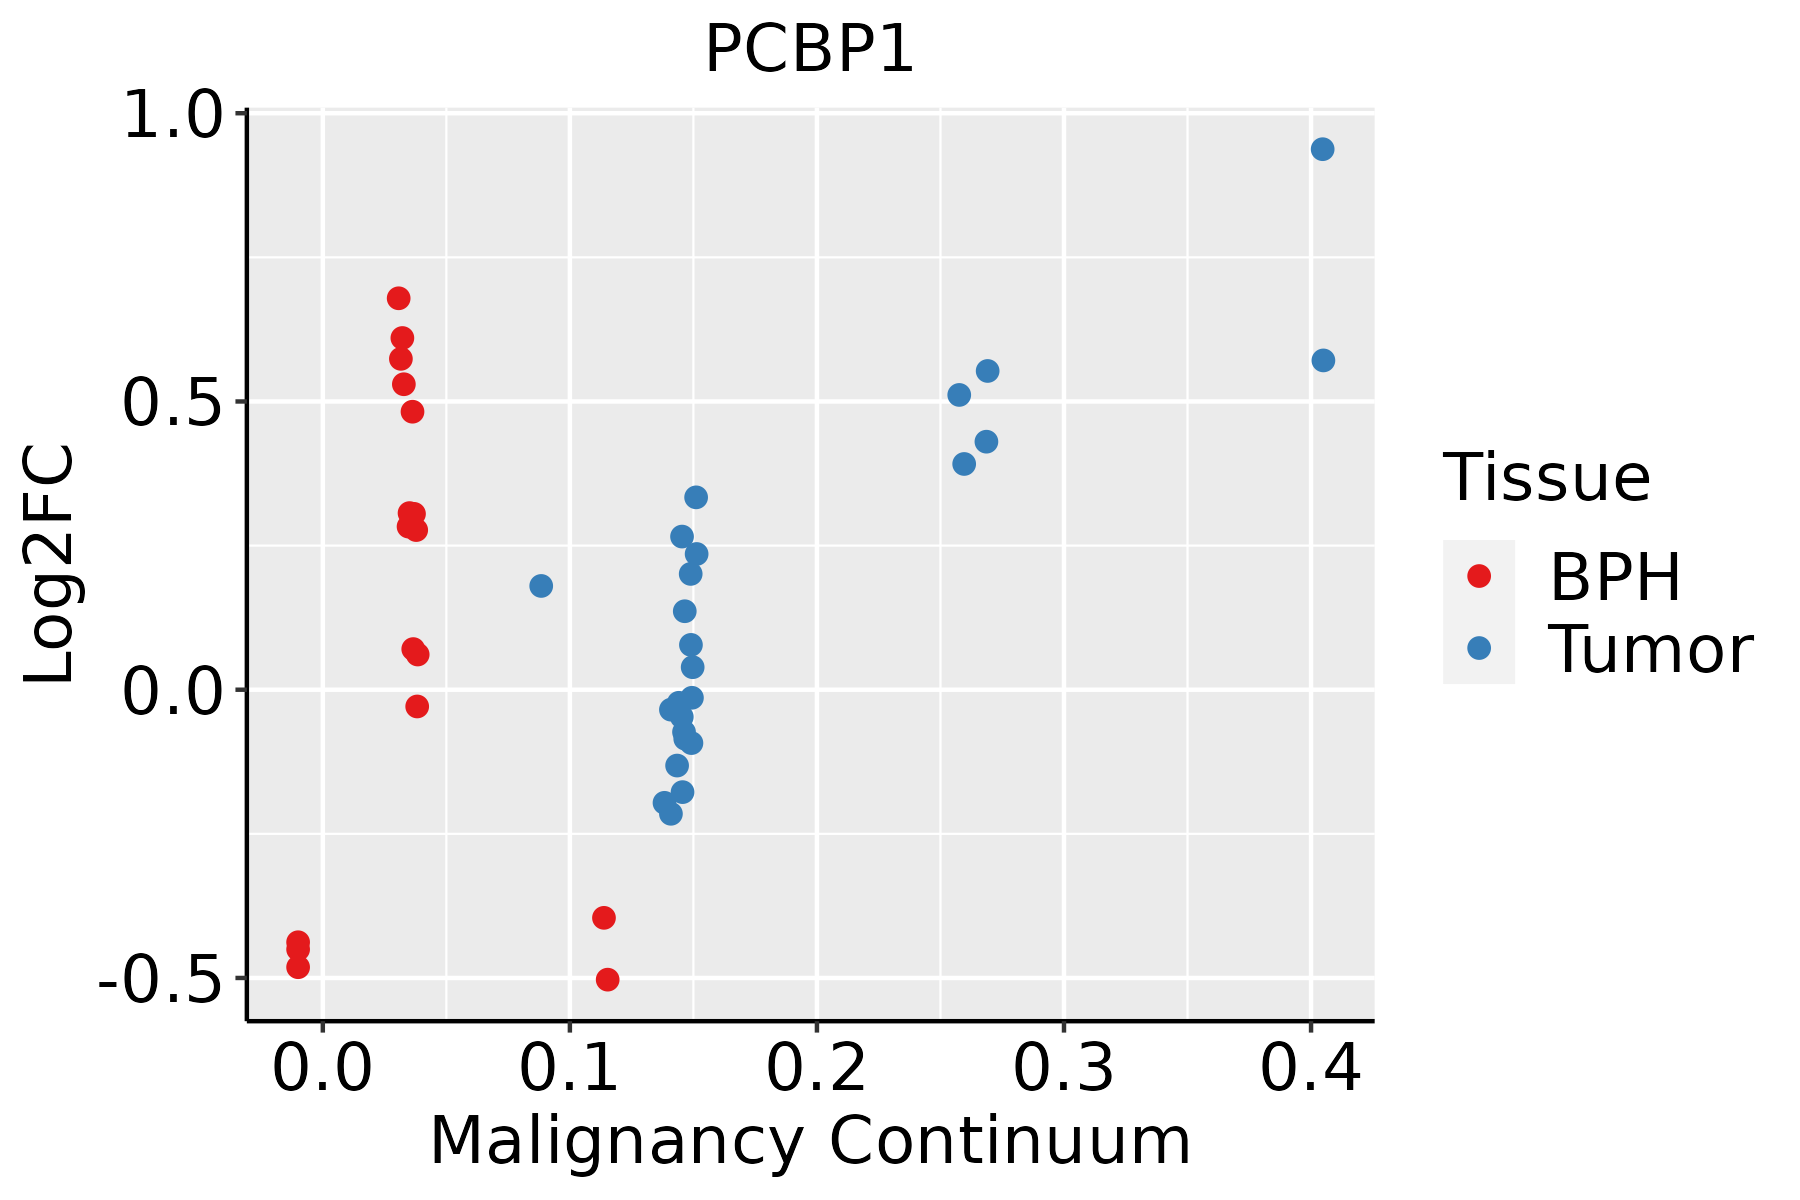 | BPH: Benign Prostatic Hyperplasia |
| Skin | 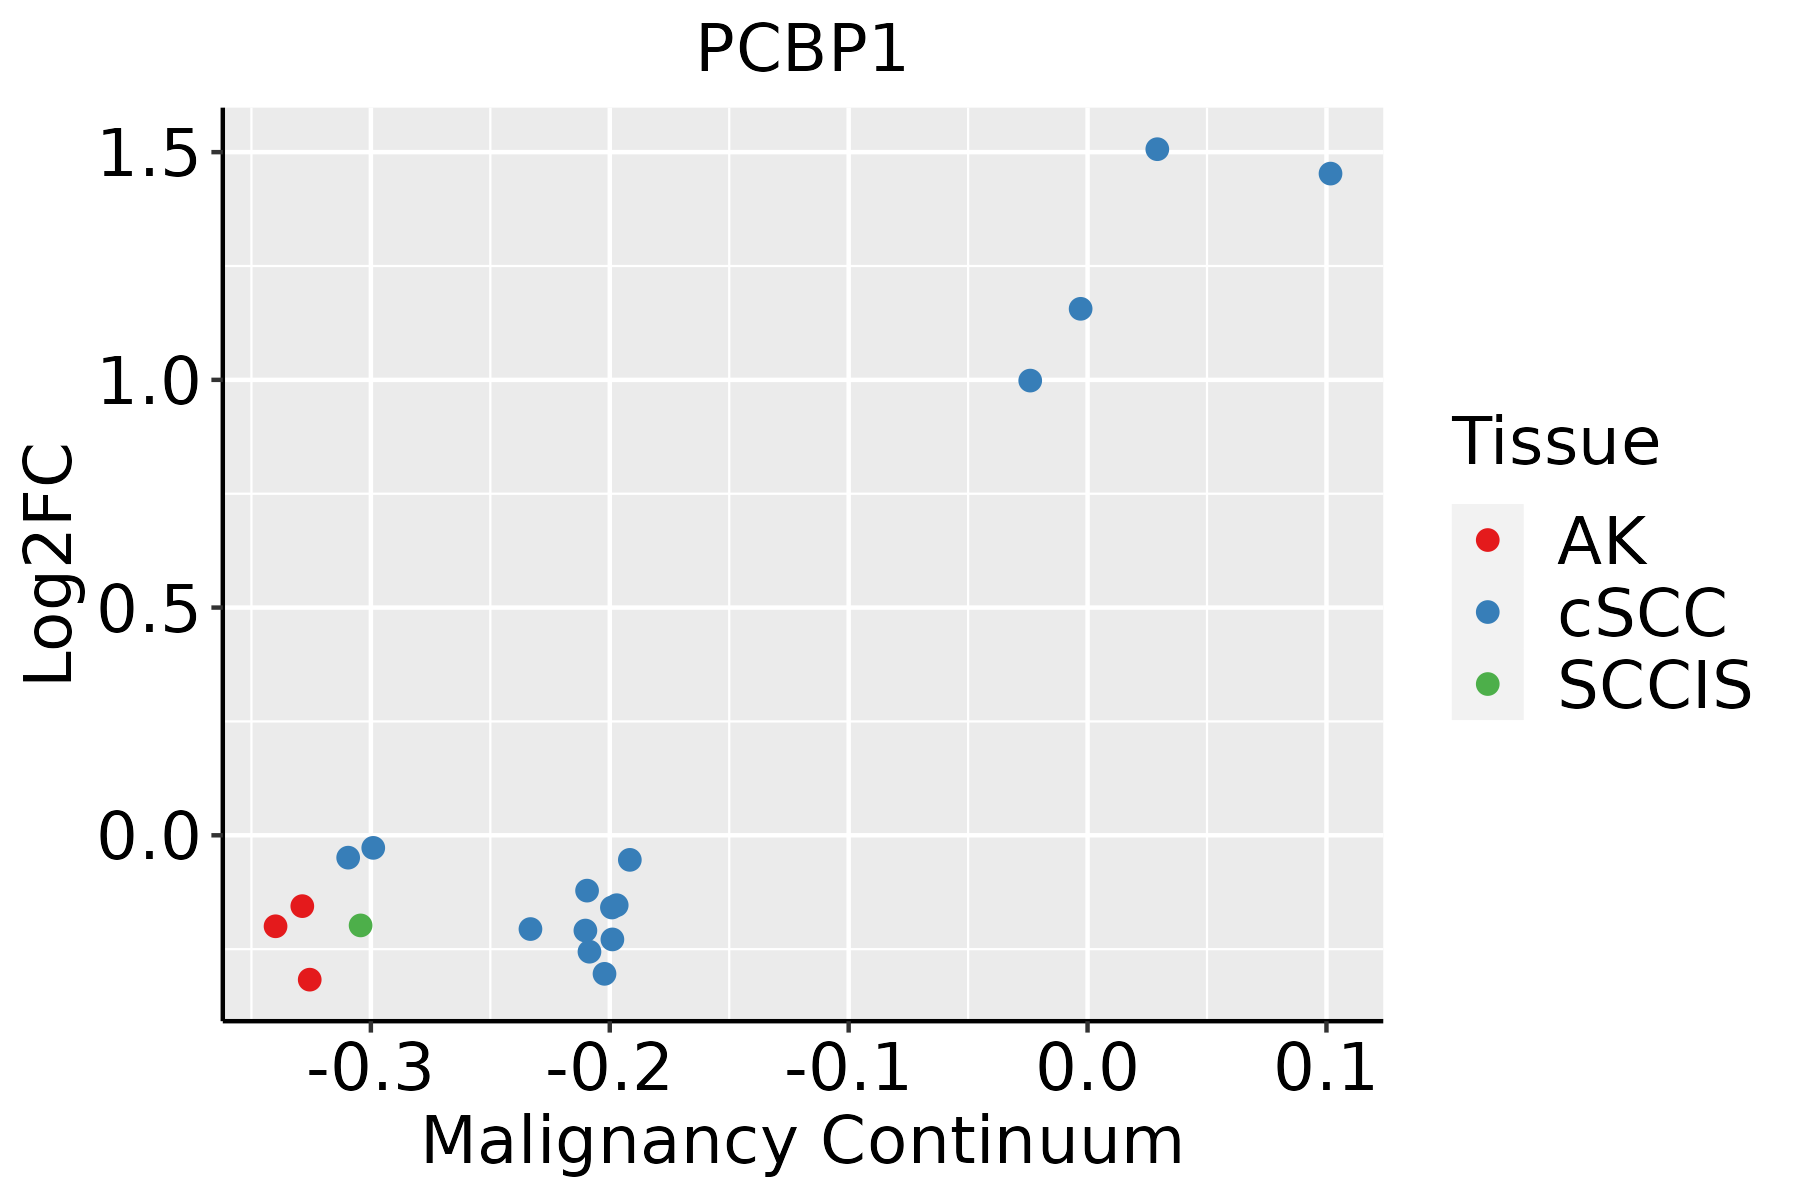 | AK: Actinic keratosis |
| cSCC: Cutaneous squamous cell carcinoma | ||
| SCCIS:squamous cell carcinoma in situ | ||
| Thyroid |  | ATC: Anaplastic thyroid cancer |
| HT: Hashimoto's thyroiditis | ||
| PTC: Papillary thyroid cancer |
| ∗log2FC in expression of this searched gene in stem-like cells from each diseased tissue sample relative to stem-like cells in normal samples in each tissue plotted against the malignancy continuum. Samples are colored based on if they are from different disease stage. |
Top |
Malignant transformation related pathway analysis |
| Find out the enriched GO biological processes and KEGG pathways involved in transition from healthy to precancer to cancer |
| Tissue | Disease Stage | Enriched GO biological Processes |
| Colorectum | AD |  |
| Colorectum | SER |  |
| Colorectum | MSS |  |
| Colorectum | MSI-H |  |
| Colorectum | FAP |  |
| ∗Top 15 enriched GO BP terms are showed in the bar plot of each disease state in each tissue. Each row represents a significant GO biological process which is colored according to the -log10(p.adjust). |
| Page: 1 2 3 4 5 6 7 8 9 |
| GO ID | Tissue | Disease Stage | Description | Gene Ratio | Bg Ratio | pvalue | p.adjust | Count |
| GO:00160329 | Breast | Precancer | viral process | 58/1080 | 415/18723 | 3.42e-10 | 3.16e-08 | 58 |
| GO:00190589 | Breast | Precancer | viral life cycle | 47/1080 | 317/18723 | 2.42e-09 | 1.99e-07 | 47 |
| GO:00190799 | Breast | Precancer | viral genome replication | 22/1080 | 131/18723 | 5.63e-06 | 1.66e-04 | 22 |
| GO:001603214 | Breast | IDC | viral process | 75/1434 | 415/18723 | 1.98e-12 | 4.02e-10 | 75 |
| GO:001905814 | Breast | IDC | viral life cycle | 61/1434 | 317/18723 | 1.61e-11 | 2.77e-09 | 61 |
| GO:001907914 | Breast | IDC | viral genome replication | 32/1434 | 131/18723 | 2.82e-09 | 2.46e-07 | 32 |
| GO:001603224 | Breast | DCIS | viral process | 73/1390 | 415/18723 | 3.40e-12 | 6.88e-10 | 73 |
| GO:001905824 | Breast | DCIS | viral life cycle | 59/1390 | 317/18723 | 4.05e-11 | 5.74e-09 | 59 |
| GO:001907923 | Breast | DCIS | viral genome replication | 30/1390 | 131/18723 | 2.12e-08 | 1.45e-06 | 30 |
| GO:001603210 | Cervix | CC | viral process | 109/2311 | 415/18723 | 5.40e-15 | 6.46e-12 | 109 |
| GO:001905810 | Cervix | CC | viral life cycle | 87/2311 | 317/18723 | 2.20e-13 | 1.20e-10 | 87 |
| GO:001907910 | Cervix | CC | viral genome replication | 35/2311 | 131/18723 | 6.11e-06 | 1.49e-04 | 35 |
| GO:001603216 | Endometrium | AEH | viral process | 110/2100 | 415/18723 | 1.99e-18 | 1.09e-15 | 110 |
| GO:001905816 | Endometrium | AEH | viral life cycle | 86/2100 | 317/18723 | 2.53e-15 | 7.58e-13 | 86 |
| GO:001907916 | Endometrium | AEH | viral genome replication | 43/2100 | 131/18723 | 3.22e-11 | 4.60e-09 | 43 |
| GO:00396942 | Endometrium | AEH | viral RNA genome replication | 12/2100 | 35/18723 | 2.69e-04 | 3.12e-03 | 12 |
| GO:001603217 | Endometrium | EEC | viral process | 112/2168 | 415/18723 | 2.48e-18 | 1.35e-15 | 112 |
| GO:001905817 | Endometrium | EEC | viral life cycle | 86/2168 | 317/18723 | 1.63e-14 | 4.65e-12 | 86 |
| GO:001907917 | Endometrium | EEC | viral genome replication | 42/2168 | 131/18723 | 3.43e-10 | 3.61e-08 | 42 |
| GO:00396941 | Endometrium | EEC | viral RNA genome replication | 11/2168 | 35/18723 | 1.44e-03 | 1.17e-02 | 11 |
| Page: 1 2 3 4 5 |
| Pathway ID | Tissue | Disease Stage | Description | Gene Ratio | Bg Ratio | pvalue | p.adjust | qvalue | Count |
| hsa030408 | Breast | Precancer | Spliceosome | 39/684 | 217/8465 | 1.44e-06 | 2.27e-05 | 1.74e-05 | 39 |
| hsa0421610 | Breast | Precancer | Ferroptosis | 11/684 | 41/8465 | 2.95e-04 | 2.45e-03 | 1.88e-03 | 11 |
| hsa0304013 | Breast | Precancer | Spliceosome | 39/684 | 217/8465 | 1.44e-06 | 2.27e-05 | 1.74e-05 | 39 |
| hsa0421613 | Breast | Precancer | Ferroptosis | 11/684 | 41/8465 | 2.95e-04 | 2.45e-03 | 1.88e-03 | 11 |
| hsa0304023 | Breast | IDC | Spliceosome | 40/867 | 217/8465 | 1.53e-04 | 1.42e-03 | 1.06e-03 | 40 |
| hsa0421623 | Breast | IDC | Ferroptosis | 12/867 | 41/8465 | 5.87e-04 | 4.89e-03 | 3.66e-03 | 12 |
| hsa0304033 | Breast | IDC | Spliceosome | 40/867 | 217/8465 | 1.53e-04 | 1.42e-03 | 1.06e-03 | 40 |
| hsa0421633 | Breast | IDC | Ferroptosis | 12/867 | 41/8465 | 5.87e-04 | 4.89e-03 | 3.66e-03 | 12 |
| hsa0304043 | Breast | DCIS | Spliceosome | 40/846 | 217/8465 | 8.97e-05 | 8.52e-04 | 6.28e-04 | 40 |
| hsa0421642 | Breast | DCIS | Ferroptosis | 12/846 | 41/8465 | 4.69e-04 | 3.69e-03 | 2.72e-03 | 12 |
| hsa0304053 | Breast | DCIS | Spliceosome | 40/846 | 217/8465 | 8.97e-05 | 8.52e-04 | 6.28e-04 | 40 |
| hsa0421652 | Breast | DCIS | Ferroptosis | 12/846 | 41/8465 | 4.69e-04 | 3.69e-03 | 2.72e-03 | 12 |
| hsa0421614 | Cervix | CC | Ferroptosis | 14/1267 | 41/8465 | 1.75e-03 | 7.21e-03 | 4.26e-03 | 14 |
| hsa0421615 | Cervix | CC | Ferroptosis | 14/1267 | 41/8465 | 1.75e-03 | 7.21e-03 | 4.26e-03 | 14 |
| hsa030409 | Endometrium | AEH | Spliceosome | 54/1197 | 217/8465 | 1.47e-05 | 1.65e-04 | 1.21e-04 | 54 |
| hsa0421616 | Endometrium | AEH | Ferroptosis | 15/1197 | 41/8465 | 2.83e-04 | 2.30e-03 | 1.68e-03 | 15 |
| hsa0304014 | Endometrium | AEH | Spliceosome | 54/1197 | 217/8465 | 1.47e-05 | 1.65e-04 | 1.21e-04 | 54 |
| hsa0421617 | Endometrium | AEH | Ferroptosis | 15/1197 | 41/8465 | 2.83e-04 | 2.30e-03 | 1.68e-03 | 15 |
| hsa0304024 | Endometrium | EEC | Spliceosome | 54/1237 | 217/8465 | 3.78e-05 | 3.88e-04 | 2.89e-04 | 54 |
| hsa0421625 | Endometrium | EEC | Ferroptosis | 16/1237 | 41/8465 | 1.09e-04 | 1.08e-03 | 8.08e-04 | 16 |
| Page: 1 2 3 4 |
Top |
Cell-cell communication analysis |
| Identification of potential cell-cell interactions between two cell types and their ligand-receptor pairs for different disease states |
| Ligand | Receptor | LRpair | Pathway | Tissue | Disease Stage |
| Page: 1 |
Top |
Single-cell gene regulatory network inference analysis |
| Find out the significant the regulons (TFs) and the target genes of each regulon across cell types for different disease states |
| TF | Cell Type | Tissue | Disease Stage | Target Gene | RSS | Regulon Activity |
| ∗The dot plots of a searched regulon are shown for all cell subpopulations in each disease state of each tissue based on the regulon specific score inferred using pySCENIC and by calculating the average expression. |
| Page: 1 |
Top |
Somatic mutation of malignant transformation related genes |
| Annotation of somatic variants for genes involved in malignant transformation |
| Hugo Symbol | Variant Class | Variant Classification | dbSNP RS | HGVSc | HGVSp | HGVSp Short | SWISSPROT | BIOTYPE | SIFT | PolyPhen | Tumor Sample Barcode | Tissue | Histology | Sex | Age | Stage | Therapy Types | Drugs | Outcome |
| PCBP1 | SNV | Missense_Mutation | c.19N>C | p.Glu7Gln | p.E7Q | Q15365 | protein_coding | deleterious(0) | possibly_damaging(0.833) | TCGA-C8-A1HM-01 | Breast | breast invasive carcinoma | Female | >=65 | I/II | Chemotherapy | doxorubicin | CR | |
| PCBP1 | SNV | Missense_Mutation | novel | c.151N>A | p.Glu51Lys | p.E51K | Q15365 | protein_coding | deleterious(0.01) | possibly_damaging(0.785) | TCGA-C5-A905-01 | Cervix | cervical & endocervical cancer | Female | <65 | I/II | Unknown | Unknown | SD |
| PCBP1 | SNV | Missense_Mutation | c.305T>C | p.Leu102Pro | p.L102P | Q15365 | protein_coding | deleterious(0.01) | probably_damaging(1) | TCGA-5M-AAT4-01 | Colorectum | colon adenocarcinoma | Male | >=65 | III/IV | Unknown | Unknown | PD | |
| PCBP1 | SNV | Missense_Mutation | c.299N>A | p.Leu100Gln | p.L100Q | Q15365 | protein_coding | deleterious(0.01) | probably_damaging(0.96) | TCGA-A6-2684-01 | Colorectum | colon adenocarcinoma | Female | >=65 | I/II | Unknown | Unknown | PD | |
| PCBP1 | SNV | Missense_Mutation | c.299N>C | p.Leu100Pro | p.L100P | Q15365 | protein_coding | deleterious(0.03) | probably_damaging(0.987) | TCGA-A6-4107-01 | Colorectum | colon adenocarcinoma | Female | <65 | III/IV | Chemotherapy | 5 | SD | |
| PCBP1 | SNV | Missense_Mutation | c.305N>C | p.Leu102Pro | p.L102P | Q15365 | protein_coding | deleterious(0.01) | probably_damaging(1) | TCGA-AA-3814-01 | Colorectum | colon adenocarcinoma | Female | >=65 | I/II | Unknown | Unknown | SD | |
| PCBP1 | SNV | Missense_Mutation | c.305N>A | p.Leu102Gln | p.L102Q | Q15365 | protein_coding | deleterious(0) | probably_damaging(1) | TCGA-AA-3979-01 | Colorectum | colon adenocarcinoma | Male | >=65 | I/II | Unknown | Unknown | SD | |
| PCBP1 | SNV | Missense_Mutation | c.299T>A | p.Leu100Gln | p.L100Q | Q15365 | protein_coding | deleterious(0.01) | probably_damaging(0.96) | TCGA-AA-A01I-01 | Colorectum | colon adenocarcinoma | Male | >=65 | I/II | Unknown | Unknown | SD | |
| PCBP1 | SNV | Missense_Mutation | c.676G>A | p.Gly226Arg | p.G226R | Q15365 | protein_coding | deleterious(0.02) | benign(0.274) | TCGA-AD-6964-01 | Colorectum | colon adenocarcinoma | Male | <65 | III/IV | Chemotherapy | folfox | PD | |
| PCBP1 | SNV | Missense_Mutation | c.871N>G | p.Ile291Val | p.I291V | Q15365 | protein_coding | deleterious(0) | possibly_damaging(0.705) | TCGA-CA-6718-01 | Colorectum | colon adenocarcinoma | Male | <65 | I/II | Unknown | Unknown | PD |
| Page: 1 2 3 4 5 6 |
Top |
Related drugs of malignant transformation related genes |
| Identification of chemicals and drugs interact with genes involved in malignant transfromation |
| (DGIdb 4.0) |
| Entrez ID | Symbol | Category | Interaction Types | Drug Claim Name | Drug Name | PMIDs |
| Page: 1 |

Copyright 2023-Present -The University of Texas Health Science Center at Houston |