
|
|||||
|
 | |
| |
| |
| |
| |
| |
|
Gene: PCBD2 |
Gene summary for PCBD2 |
| Gene information | Species | Human | Gene symbol | PCBD2 | Gene ID | 84105 |
| Gene name | pterin-4 alpha-carbinolamine dehydratase 2 | |
| Gene Alias | DCOH2 | |
| Cytomap | 5q31.1 | |
| Gene Type | protein-coding | GO ID | GO:0006066 | UniProtAcc | Q9H0N5 |
Top |
Malignant transformation analysis |
| Identification of the aberrant gene expression in precancerous and cancerous lesions by comparing the gene expression of stem-like cells in diseased tissues with normal stem cells |
| Entrez ID | Symbol | Replicates | Species | Organ | Tissue | Adj P-value | Log2FC | Malignancy |
| 84105 | PCBD2 | CCI_2 | Human | Cervix | CC | 4.00e-09 | 8.60e-01 | 0.5249 |
| 84105 | PCBD2 | CCI_3 | Human | Cervix | CC | 1.78e-05 | 5.94e-01 | 0.516 |
| 84105 | PCBD2 | HTA11_3410_2000001011 | Human | Colorectum | AD | 1.19e-02 | 2.72e-01 | 0.0155 |
| 84105 | PCBD2 | HTA11_2487_2000001011 | Human | Colorectum | SER | 6.64e-09 | 7.18e-01 | -0.1808 |
| 84105 | PCBD2 | HTA11_1938_2000001011 | Human | Colorectum | AD | 4.08e-23 | 1.25e+00 | -0.0811 |
| 84105 | PCBD2 | HTA11_78_2000001011 | Human | Colorectum | AD | 4.52e-26 | 1.49e+00 | -0.1088 |
| 84105 | PCBD2 | HTA11_347_2000001011 | Human | Colorectum | AD | 1.16e-48 | 1.50e+00 | -0.1954 |
| 84105 | PCBD2 | HTA11_411_2000001011 | Human | Colorectum | SER | 8.37e-09 | 1.05e+00 | -0.2602 |
| 84105 | PCBD2 | HTA11_3361_2000001011 | Human | Colorectum | AD | 8.94e-03 | 5.35e-01 | -0.1207 |
| 84105 | PCBD2 | HTA11_83_2000001011 | Human | Colorectum | SER | 5.83e-21 | 1.17e+00 | -0.1526 |
| 84105 | PCBD2 | HTA11_696_2000001011 | Human | Colorectum | AD | 2.35e-20 | 8.48e-01 | -0.1464 |
| 84105 | PCBD2 | HTA11_866_2000001011 | Human | Colorectum | AD | 1.57e-04 | 3.86e-01 | -0.1001 |
| 84105 | PCBD2 | HTA11_1391_2000001011 | Human | Colorectum | AD | 3.03e-07 | 5.86e-01 | -0.059 |
| 84105 | PCBD2 | HTA11_2992_2000001011 | Human | Colorectum | SER | 9.41e-17 | 1.41e+00 | -0.1706 |
| 84105 | PCBD2 | HTA11_5212_2000001011 | Human | Colorectum | AD | 5.31e-26 | 1.76e+00 | -0.2061 |
| 84105 | PCBD2 | HTA11_5216_2000001011 | Human | Colorectum | SER | 1.95e-10 | 1.16e+00 | -0.1462 |
| 84105 | PCBD2 | HTA11_546_2000001011 | Human | Colorectum | AD | 1.62e-08 | 8.38e-01 | -0.0842 |
| 84105 | PCBD2 | HTA11_4255_2000001011 | Human | Colorectum | SER | 1.30e-30 | 2.92e+00 | 0.0446 |
| 84105 | PCBD2 | HTA11_7663_2000001011 | Human | Colorectum | SER | 1.17e-28 | 2.96e+00 | 0.0131 |
| 84105 | PCBD2 | HTA11_10623_2000001011 | Human | Colorectum | AD | 2.68e-23 | 1.69e+00 | -0.0177 |
| Page: 1 2 3 4 5 6 7 |
| Tissue | Expression Dynamics | Abbreviation |
| Cervix | 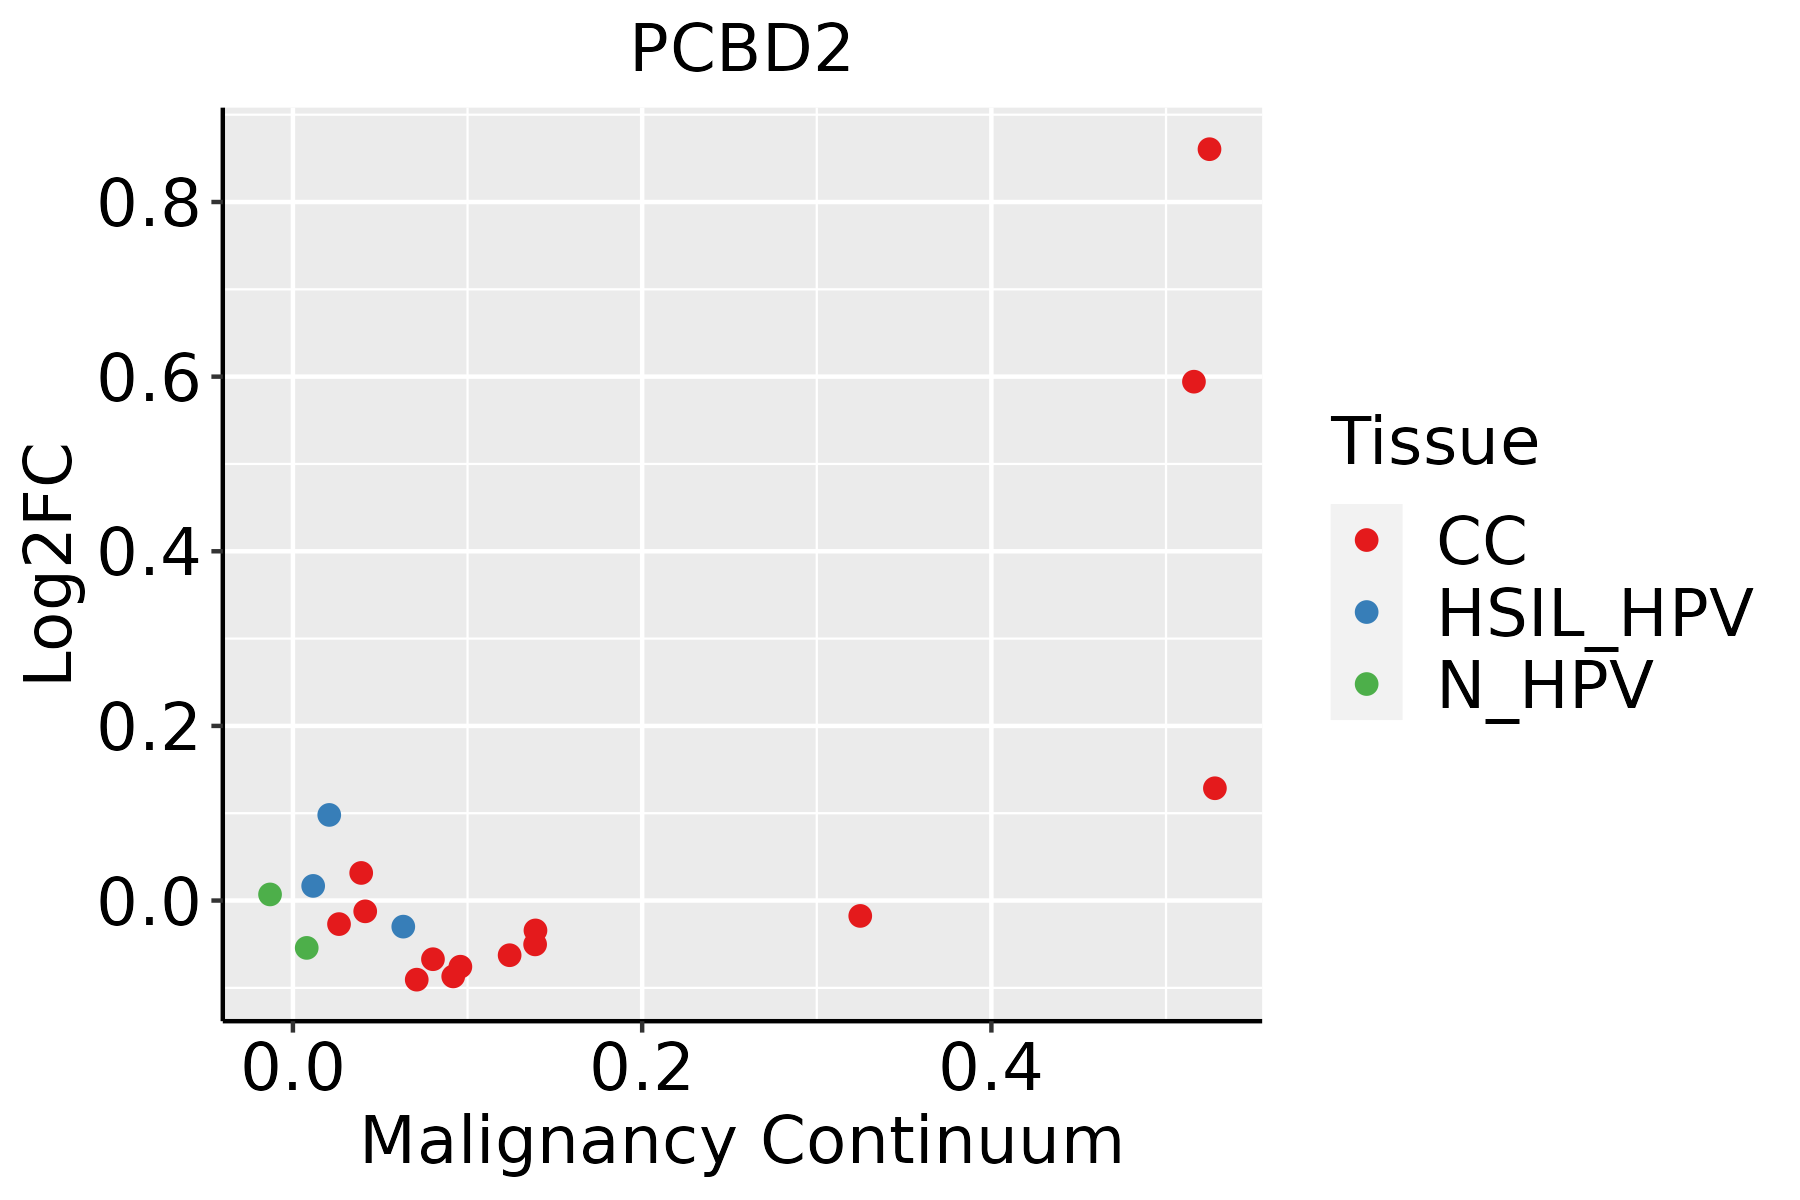 | CC: Cervix cancer |
| HSIL_HPV: HPV-infected high-grade squamous intraepithelial lesions | ||
| N_HPV: HPV-infected normal cervix | ||
| Colorectum (GSE201348) |  | FAP: Familial adenomatous polyposis |
| CRC: Colorectal cancer | ||
| Colorectum (HTA11) |  | AD: Adenomas |
| SER: Sessile serrated lesions | ||
| MSI-H: Microsatellite-high colorectal cancer | ||
| MSS: Microsatellite stable colorectal cancer | ||
| Esophagus | 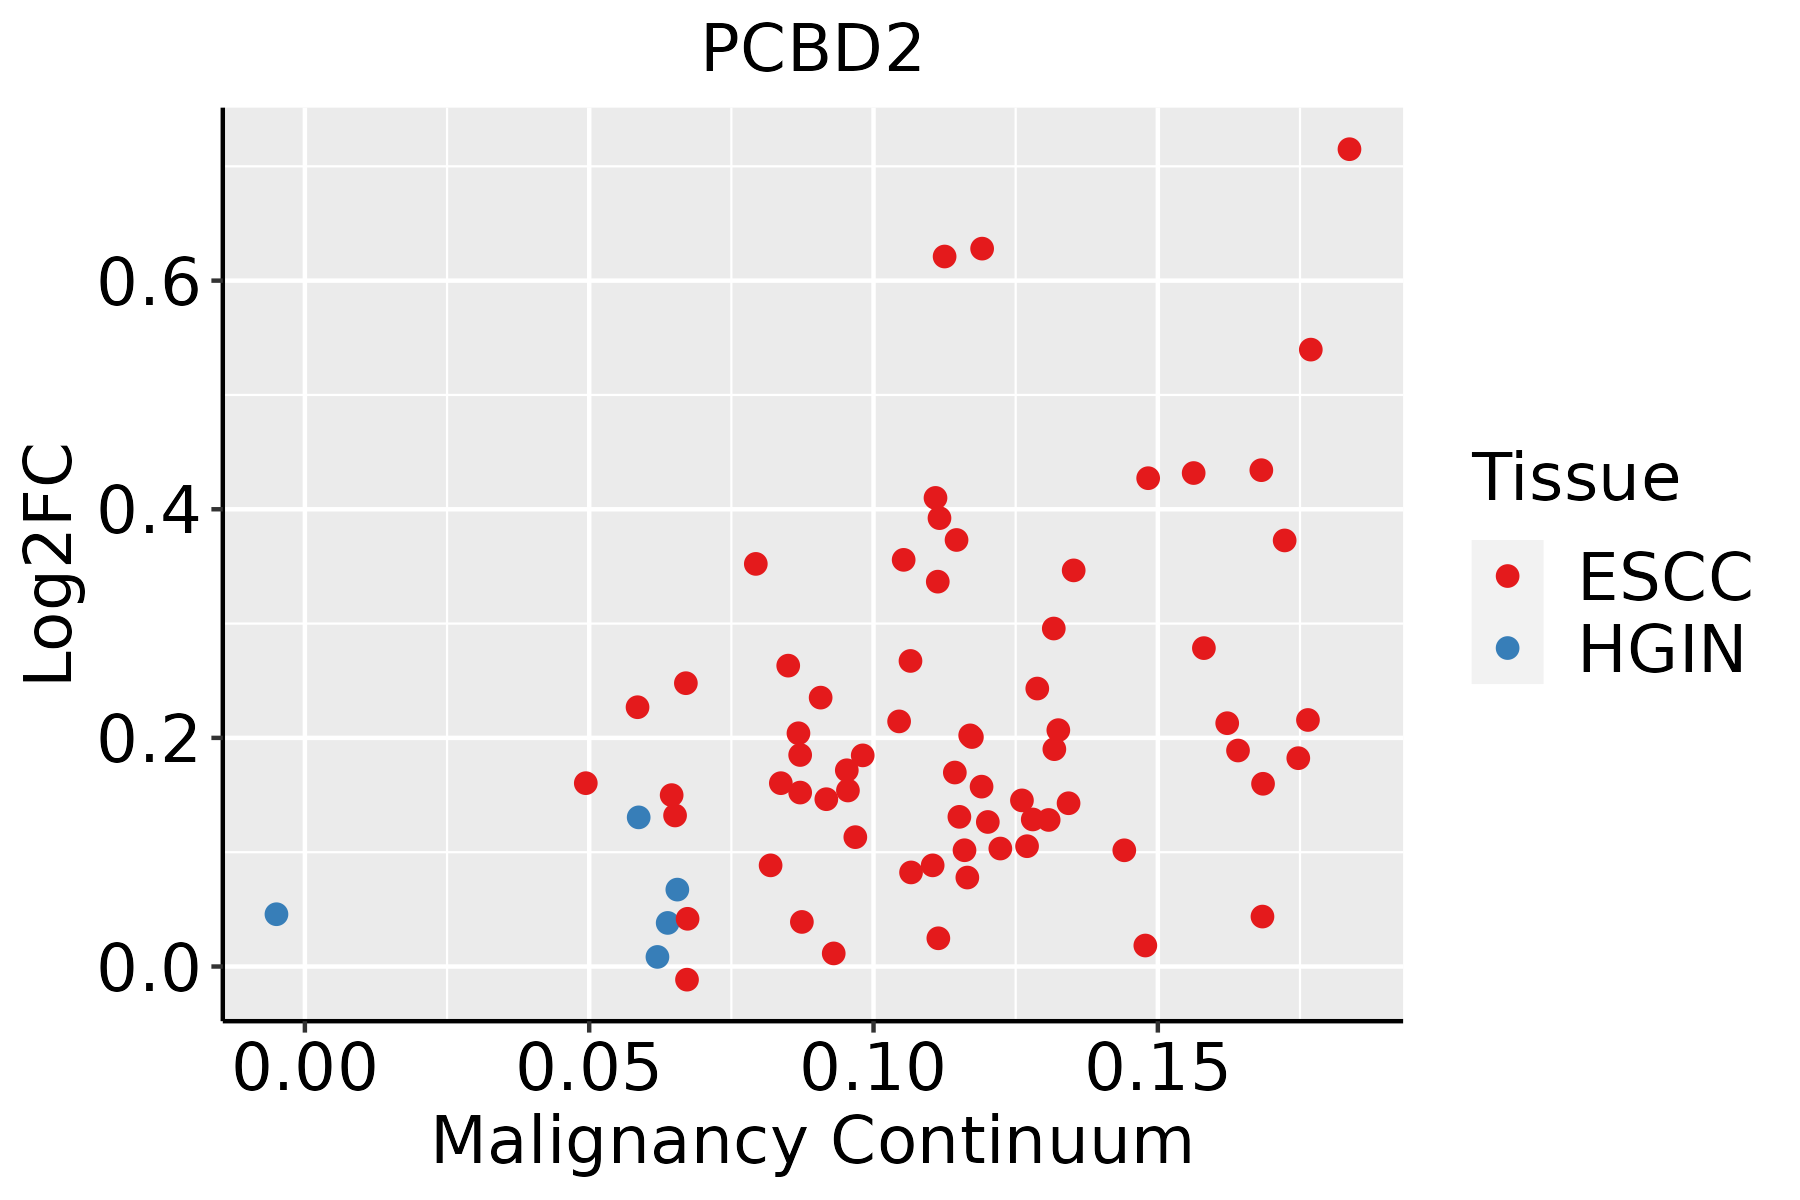 | ESCC: Esophageal squamous cell carcinoma |
| HGIN: High-grade intraepithelial neoplasias | ||
| LGIN: Low-grade intraepithelial neoplasias | ||
| Liver |  | HCC: Hepatocellular carcinoma |
| NAFLD: Non-alcoholic fatty liver disease | ||
| Oral Cavity | 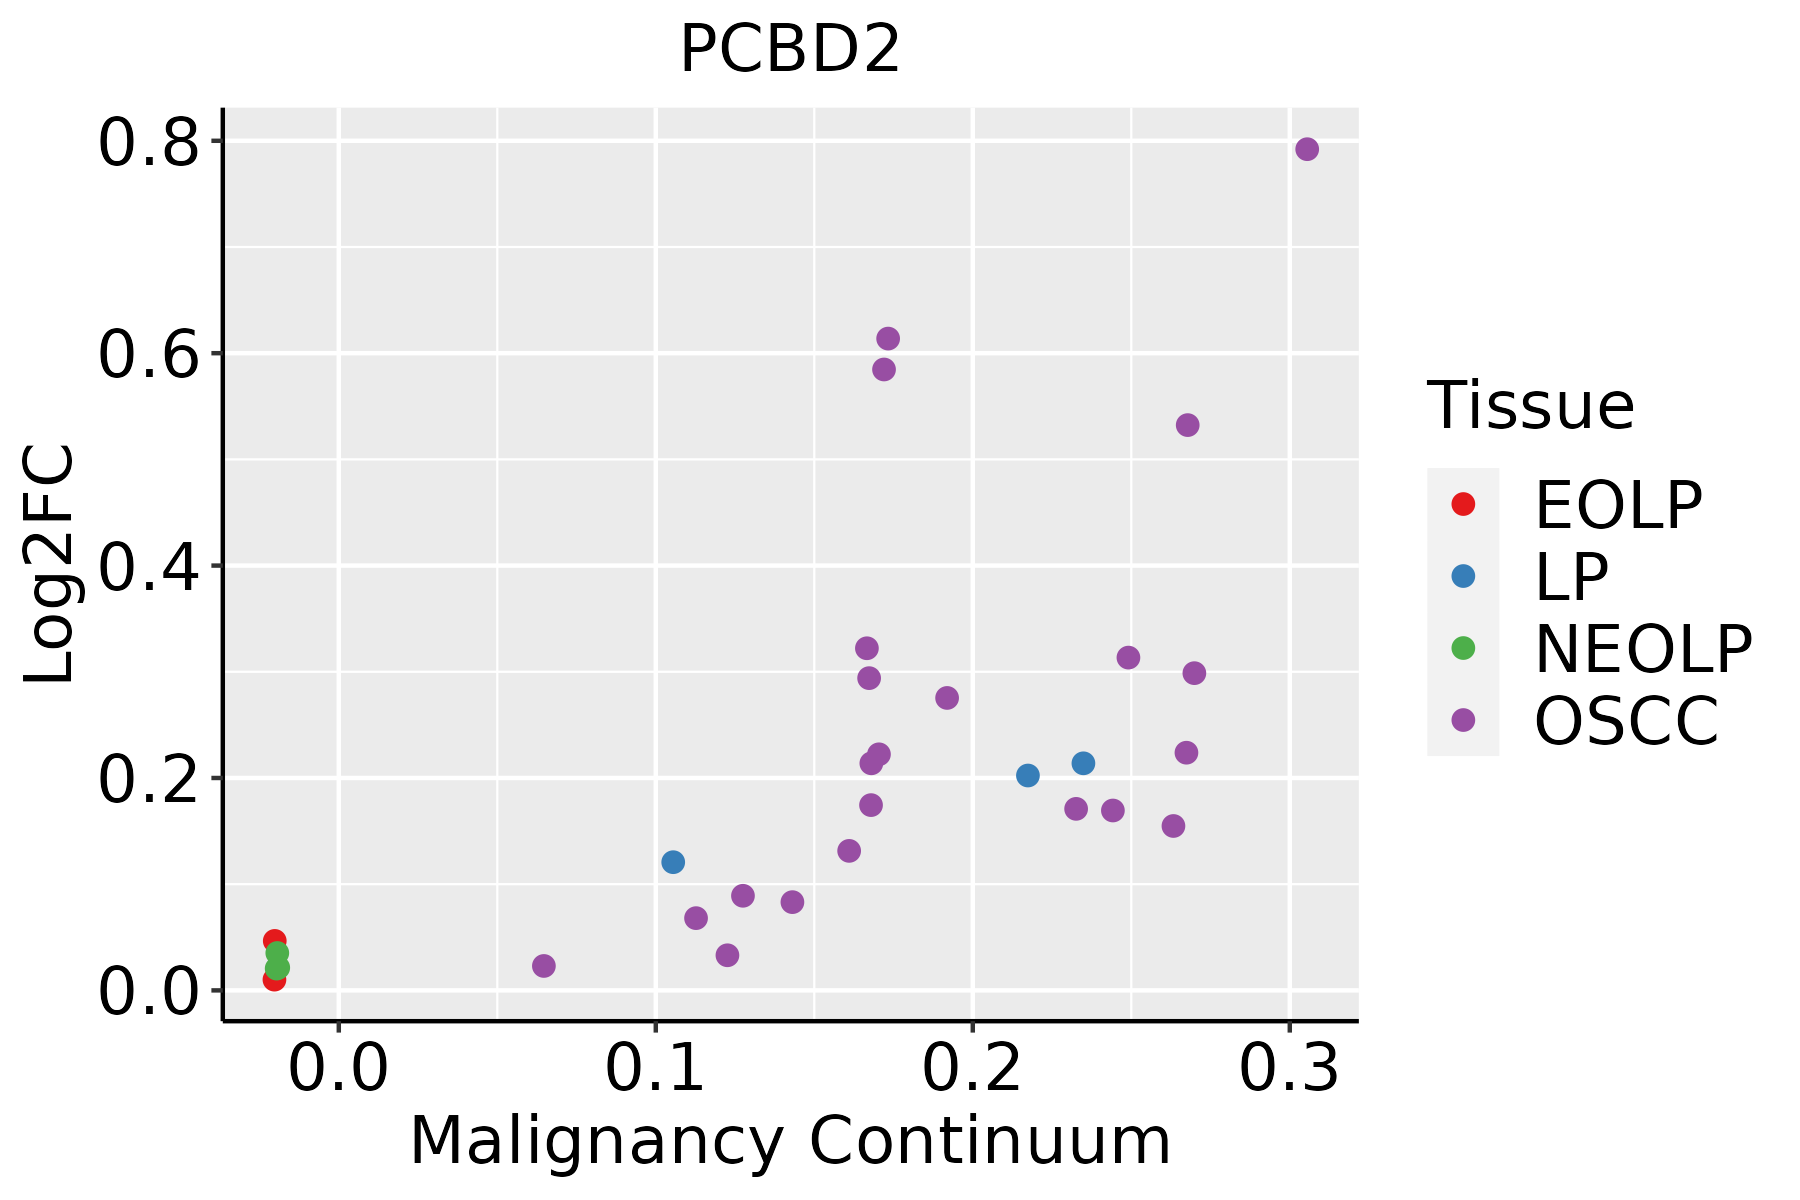 | EOLP: Erosive Oral lichen planus |
| LP: leukoplakia | ||
| NEOLP: Non-erosive oral lichen planus | ||
| OSCC: Oral squamous cell carcinoma |
| ∗log2FC in expression of this searched gene in stem-like cells from each diseased tissue sample relative to stem-like cells in normal samples in each tissue plotted against the malignancy continuum. Samples are colored based on if they are from different disease stage. |
Top |
Malignant transformation related pathway analysis |
| Find out the enriched GO biological processes and KEGG pathways involved in transition from healthy to precancer to cancer |
| Tissue | Disease Stage | Enriched GO biological Processes |
| Colorectum | AD |  |
| Colorectum | SER |  |
| Colorectum | MSS |  |
| Colorectum | MSI-H |  |
| Colorectum | FAP |  |
| ∗Top 15 enriched GO BP terms are showed in the bar plot of each disease state in each tissue. Each row represents a significant GO biological process which is colored according to the -log10(p.adjust). |
| Page: 1 2 3 4 5 6 7 8 9 |
| GO ID | Tissue | Disease Stage | Description | Gene Ratio | Bg Ratio | pvalue | p.adjust | Count |
| GO:0006066 | Colorectum | AD | alcohol metabolic process | 106/3918 | 353/18723 | 3.02e-05 | 5.57e-04 | 106 |
| GO:0006520 | Colorectum | AD | cellular amino acid metabolic process | 81/3918 | 284/18723 | 1.37e-03 | 1.19e-02 | 81 |
| GO:00060661 | Colorectum | SER | alcohol metabolic process | 79/2897 | 353/18723 | 3.50e-04 | 5.50e-03 | 79 |
| GO:00065201 | Colorectum | SER | cellular amino acid metabolic process | 61/2897 | 284/18723 | 4.20e-03 | 3.41e-02 | 61 |
| GO:00060662 | Colorectum | MSS | alcohol metabolic process | 92/3467 | 353/18723 | 2.57e-04 | 3.46e-03 | 92 |
| GO:0042559 | Colorectum | MSS | pteridine-containing compound biosynthetic process | 8/3467 | 15/18723 | 2.54e-03 | 2.02e-02 | 8 |
| GO:0046394 | Colorectum | MSS | carboxylic acid biosynthetic process | 76/3467 | 314/18723 | 6.71e-03 | 4.38e-02 | 76 |
| GO:0016053 | Colorectum | MSS | organic acid biosynthetic process | 76/3467 | 316/18723 | 7.88e-03 | 4.84e-02 | 76 |
| GO:00425591 | Colorectum | MSI-H | pteridine-containing compound biosynthetic process | 8/1319 | 15/18723 | 2.44e-06 | 1.43e-04 | 8 |
| GO:0042558 | Colorectum | MSI-H | pteridine-containing compound metabolic process | 10/1319 | 33/18723 | 6.01e-05 | 2.05e-03 | 10 |
| GO:1901605 | Colorectum | MSI-H | alpha-amino acid metabolic process | 26/1319 | 195/18723 | 1.26e-03 | 2.02e-02 | 26 |
| GO:0008652 | Colorectum | MSI-H | cellular amino acid biosynthetic process | 13/1319 | 76/18723 | 2.35e-03 | 3.12e-02 | 13 |
| GO:1901607 | Colorectum | MSI-H | alpha-amino acid biosynthetic process | 12/1319 | 68/18723 | 2.60e-03 | 3.41e-02 | 12 |
| GO:00463941 | Colorectum | MSI-H | carboxylic acid biosynthetic process | 36/1319 | 314/18723 | 2.68e-03 | 3.48e-02 | 36 |
| GO:00160531 | Colorectum | MSI-H | organic acid biosynthetic process | 36/1319 | 316/18723 | 2.98e-03 | 3.78e-02 | 36 |
| GO:0034311 | Colorectum | MSI-H | diol metabolic process | 7/1319 | 29/18723 | 3.34e-03 | 4.05e-02 | 7 |
| GO:00060663 | Colorectum | FAP | alcohol metabolic process | 69/2622 | 353/18723 | 2.29e-03 | 1.85e-02 | 69 |
| GO:00060664 | Colorectum | CRC | alcohol metabolic process | 57/2078 | 353/18723 | 2.37e-03 | 2.27e-02 | 57 |
| GO:0019751 | Colorectum | CRC | polyol metabolic process | 22/2078 | 114/18723 | 6.73e-03 | 4.77e-02 | 22 |
| GO:00060668 | Esophagus | ESCC | alcohol metabolic process | 202/8552 | 353/18723 | 7.32e-06 | 7.26e-05 | 202 |
| Page: 1 2 3 |
| Pathway ID | Tissue | Disease Stage | Description | Gene Ratio | Bg Ratio | pvalue | p.adjust | qvalue | Count |
| Page: 1 |
Top |
Cell-cell communication analysis |
| Identification of potential cell-cell interactions between two cell types and their ligand-receptor pairs for different disease states |
| Ligand | Receptor | LRpair | Pathway | Tissue | Disease Stage |
| Page: 1 |
Top |
Single-cell gene regulatory network inference analysis |
| Find out the significant the regulons (TFs) and the target genes of each regulon across cell types for different disease states |
| TF | Cell Type | Tissue | Disease Stage | Target Gene | RSS | Regulon Activity |
| ∗The dot plots of a searched regulon are shown for all cell subpopulations in each disease state of each tissue based on the regulon specific score inferred using pySCENIC and by calculating the average expression. |
| Page: 1 |
Top |
Somatic mutation of malignant transformation related genes |
| Annotation of somatic variants for genes involved in malignant transformation |
| Hugo Symbol | Variant Class | Variant Classification | dbSNP RS | HGVSc | HGVSp | HGVSp Short | SWISSPROT | BIOTYPE | SIFT | PolyPhen | Tumor Sample Barcode | Tissue | Histology | Sex | Age | Stage | Therapy Types | Drugs | Outcome |
| PCBD2 | SNV | Missense_Mutation | c.183N>G | p.Ile61Met | p.I61M | Q9H0N5 | protein_coding | deleterious(0.02) | probably_damaging(0.968) | TCGA-LP-A5U2-01 | Cervix | cervical & endocervical cancer | Female | <65 | III/IV | Unknown | Unknown | SD | |
| PCBD2 | deletion | In_Frame_Del | c.260_262delTGA | p.Met87del | p.M87del | Q9H0N5 | protein_coding | TCGA-F4-6570-01 | Colorectum | colon adenocarcinoma | Female | >=65 | I/II | Unknown | Unknown | SD | |||
| PCBD2 | SNV | Missense_Mutation | novel | c.206N>G | p.Asn69Ser | p.N69S | Q9H0N5 | protein_coding | tolerated(0.12) | benign(0.07) | TCGA-AP-A1DK-01 | Endometrium | uterine corpus endometrioid carcinoma | Female | <65 | I/II | Unknown | Unknown | SD |
| PCBD2 | SNV | Missense_Mutation | rs763152332 | c.242N>T | p.Ala81Val | p.A81V | Q9H0N5 | protein_coding | deleterious(0) | probably_damaging(0.998) | TCGA-DF-A2KN-01 | Endometrium | uterine corpus endometrioid carcinoma | Female | Unknown | I/II | Unknown | Unknown | SD |
| PCBD2 | SNV | Missense_Mutation | novel | c.269N>G | p.His90Arg | p.H90R | Q9H0N5 | protein_coding | deleterious(0) | probably_damaging(1) | TCGA-E6-A1LX-01 | Endometrium | uterine corpus endometrioid carcinoma | Female | <65 | I/II | Unknown | Unknown | SD |
| PCBD2 | deletion | Frame_Shift_Del | novel | c.345delA | p.Asp116MetfsTer2 | p.D116Mfs*2 | Q9H0N5 | protein_coding | TCGA-E6-A2P9-01 | Endometrium | uterine corpus endometrioid carcinoma | Female | >=65 | I/II | Unknown | Unknown | SD | ||
| PCBD2 | SNV | Missense_Mutation | c.216N>T | p.Gln72His | p.Q72H | Q9H0N5 | protein_coding | deleterious(0) | possibly_damaging(0.463) | TCGA-75-6214-01 | Lung | lung adenocarcinoma | Female | Unknown | III/IV | Unknown | Unknown | PD | |
| PCBD2 | deletion | Frame_Shift_Del | novel | c.345delA | p.Asp116MetfsTer2 | p.D116Mfs*2 | Q9H0N5 | protein_coding | TCGA-21-1080-01 | Lung | lung squamous cell carcinoma | Male | >=65 | I/II | Unknown | Unknown | SD | ||
| PCBD2 | insertion | Frame_Shift_Ins | novel | c.283_284insATGTATACAACAAGGTAACTAAACTGCCTTATTT | p.Gln101ThrfsTer19 | p.Q101Tfs*19 | Q9H0N5 | protein_coding | TCGA-Y6-A8TL-01 | Prostate | prostate adenocarcinoma | Male | >=65 | 6 | Unknown | Unknown | SD |
| Page: 1 |
Top |
Related drugs of malignant transformation related genes |
| Identification of chemicals and drugs interact with genes involved in malignant transfromation |
| (DGIdb 4.0) |
| Entrez ID | Symbol | Category | Interaction Types | Drug Claim Name | Drug Name | PMIDs |
| Page: 1 |

Copyright 2023-Present -The University of Texas Health Science Center at Houston |