
|
|||||
|
 | |
| |
| |
| |
| |
| |
|
Gene: PCBD1 |
Gene summary for PCBD1 |
| Gene information | Species | Human | Gene symbol | PCBD1 | Gene ID | 5092 |
| Gene name | pterin-4 alpha-carbinolamine dehydratase 1 | |
| Gene Alias | DCOH | |
| Cytomap | 10q22.1 | |
| Gene Type | protein-coding | GO ID | GO:0006066 | UniProtAcc | P61457 |
Top |
Malignant transformation analysis |
| Identification of the aberrant gene expression in precancerous and cancerous lesions by comparing the gene expression of stem-like cells in diseased tissues with normal stem cells |
| Entrez ID | Symbol | Replicates | Species | Organ | Tissue | Adj P-value | Log2FC | Malignancy |
| 5092 | PCBD1 | GSM4909285 | Human | Breast | IDC | 1.35e-07 | 2.57e-01 | 0.21 |
| 5092 | PCBD1 | GSM4909291 | Human | Breast | IDC | 1.37e-03 | 3.58e-01 | 0.1753 |
| 5092 | PCBD1 | GSM4909293 | Human | Breast | IDC | 5.98e-80 | 1.02e+00 | 0.1581 |
| 5092 | PCBD1 | GSM4909296 | Human | Breast | IDC | 1.98e-32 | 6.15e-01 | 0.1524 |
| 5092 | PCBD1 | GSM4909297 | Human | Breast | IDC | 1.38e-09 | -1.74e-01 | 0.1517 |
| 5092 | PCBD1 | GSM4909302 | Human | Breast | IDC | 3.00e-03 | 2.27e-01 | 0.1545 |
| 5092 | PCBD1 | GSM4909304 | Human | Breast | IDC | 3.42e-05 | 3.39e-01 | 0.1636 |
| 5092 | PCBD1 | GSM4909306 | Human | Breast | IDC | 4.32e-09 | 4.11e-01 | 0.1564 |
| 5092 | PCBD1 | GSM4909308 | Human | Breast | IDC | 7.28e-16 | 4.88e-01 | 0.158 |
| 5092 | PCBD1 | GSM4909311 | Human | Breast | IDC | 4.72e-27 | 4.37e-02 | 0.1534 |
| 5092 | PCBD1 | GSM4909312 | Human | Breast | IDC | 1.41e-11 | 2.62e-01 | 0.1552 |
| 5092 | PCBD1 | GSM4909313 | Human | Breast | IDC | 9.48e-05 | 1.96e-01 | 0.0391 |
| 5092 | PCBD1 | GSM4909315 | Human | Breast | IDC | 3.09e-05 | 3.77e-01 | 0.21 |
| 5092 | PCBD1 | GSM4909316 | Human | Breast | IDC | 5.61e-11 | 5.09e-01 | 0.21 |
| 5092 | PCBD1 | GSM4909319 | Human | Breast | IDC | 4.91e-40 | 2.08e-02 | 0.1563 |
| 5092 | PCBD1 | GSM4909321 | Human | Breast | IDC | 1.07e-14 | 2.45e-01 | 0.1559 |
| 5092 | PCBD1 | brca2 | Human | Breast | Precancer | 4.86e-03 | 6.29e-02 | -0.024 |
| 5092 | PCBD1 | M2 | Human | Breast | IDC | 7.44e-03 | 1.70e-01 | 0.21 |
| 5092 | PCBD1 | M5 | Human | Breast | IDC | 8.24e-05 | 5.15e-01 | 0.1598 |
| 5092 | PCBD1 | NCCBC14 | Human | Breast | DCIS | 4.91e-09 | -1.03e-01 | 0.2021 |
| Page: 1 2 3 4 5 6 7 8 9 10 11 |
| Tissue | Expression Dynamics | Abbreviation |
| Breast | 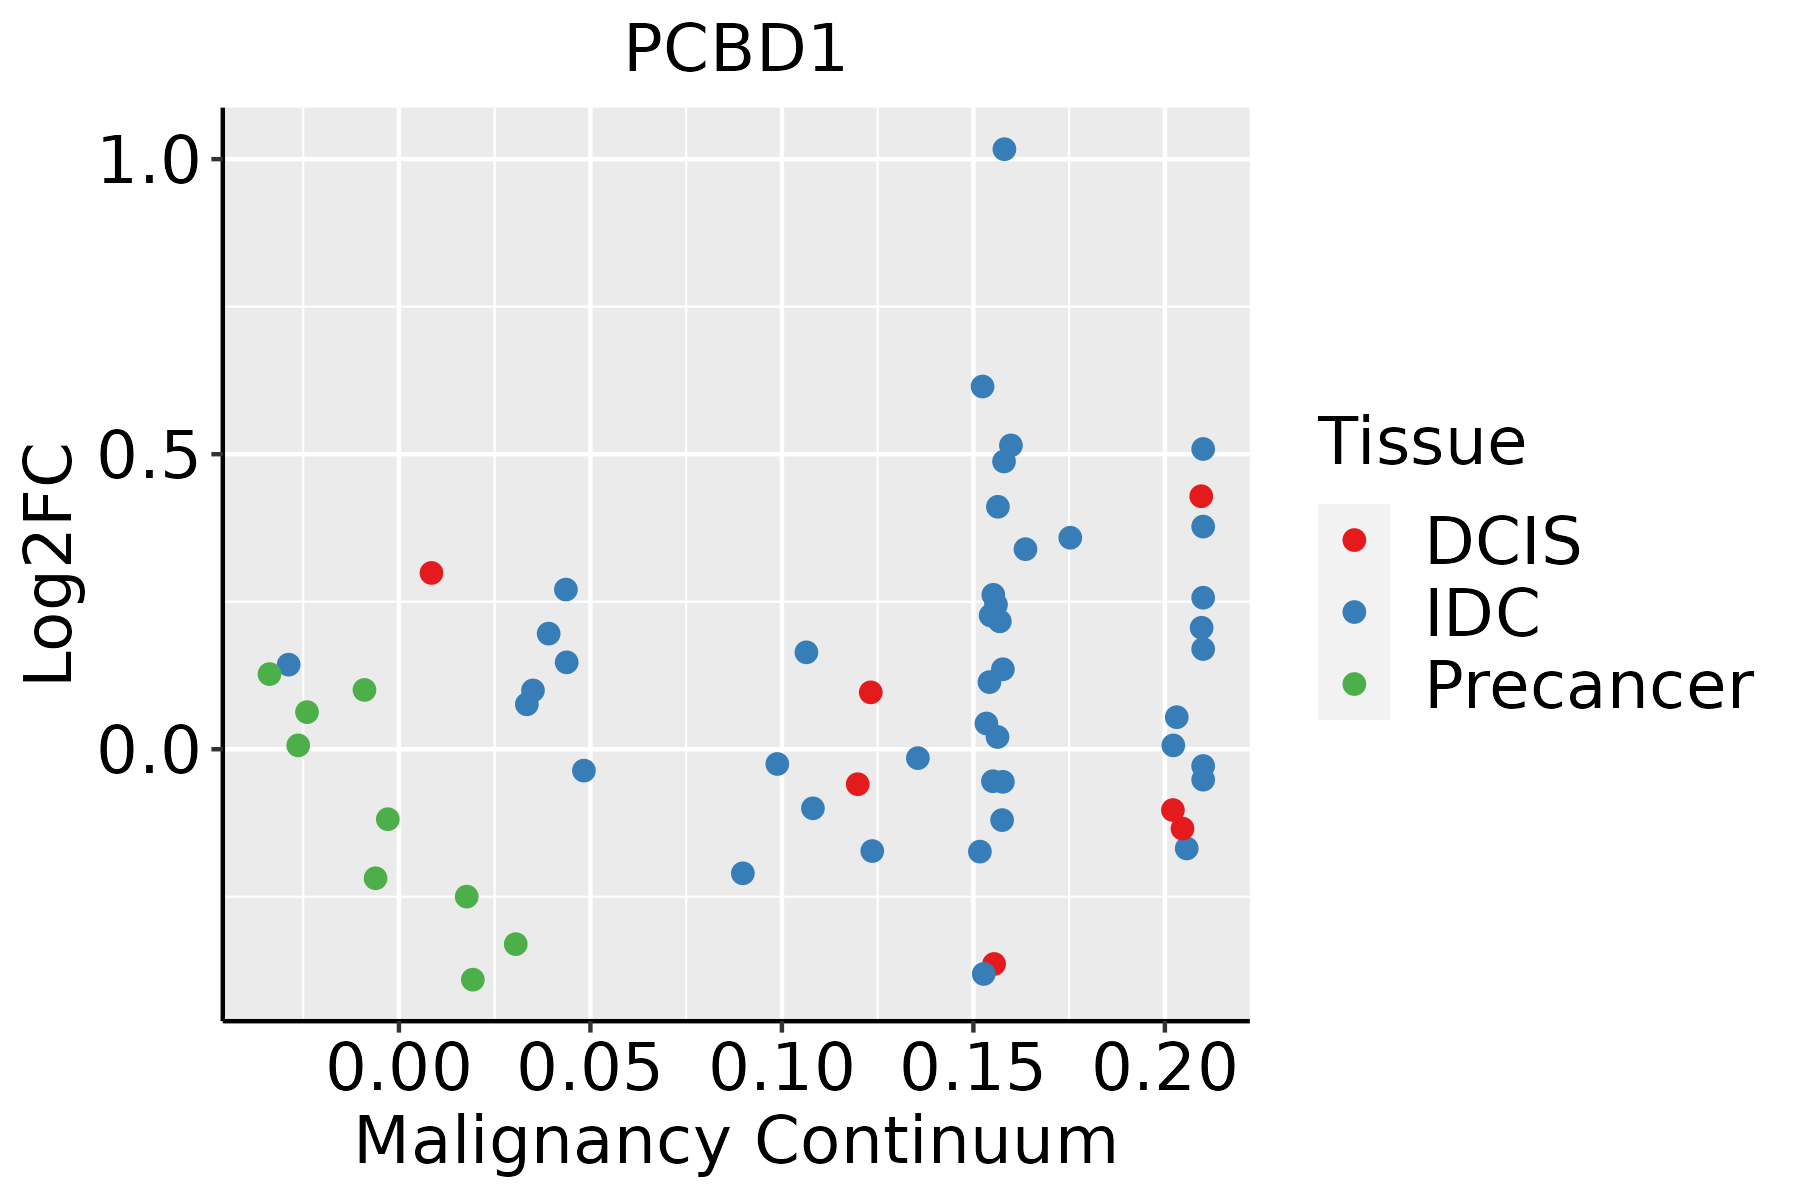 | IDC: Invasive ductal carcinoma |
| DCIS: Ductal carcinoma in situ | ||
| Precancer(BRCA1-mut): Precancerous lesion from BRCA1 mutation carriers | ||
| Colorectum (GSE201348) |  | FAP: Familial adenomatous polyposis |
| CRC: Colorectal cancer | ||
| Colorectum (HTA11) | 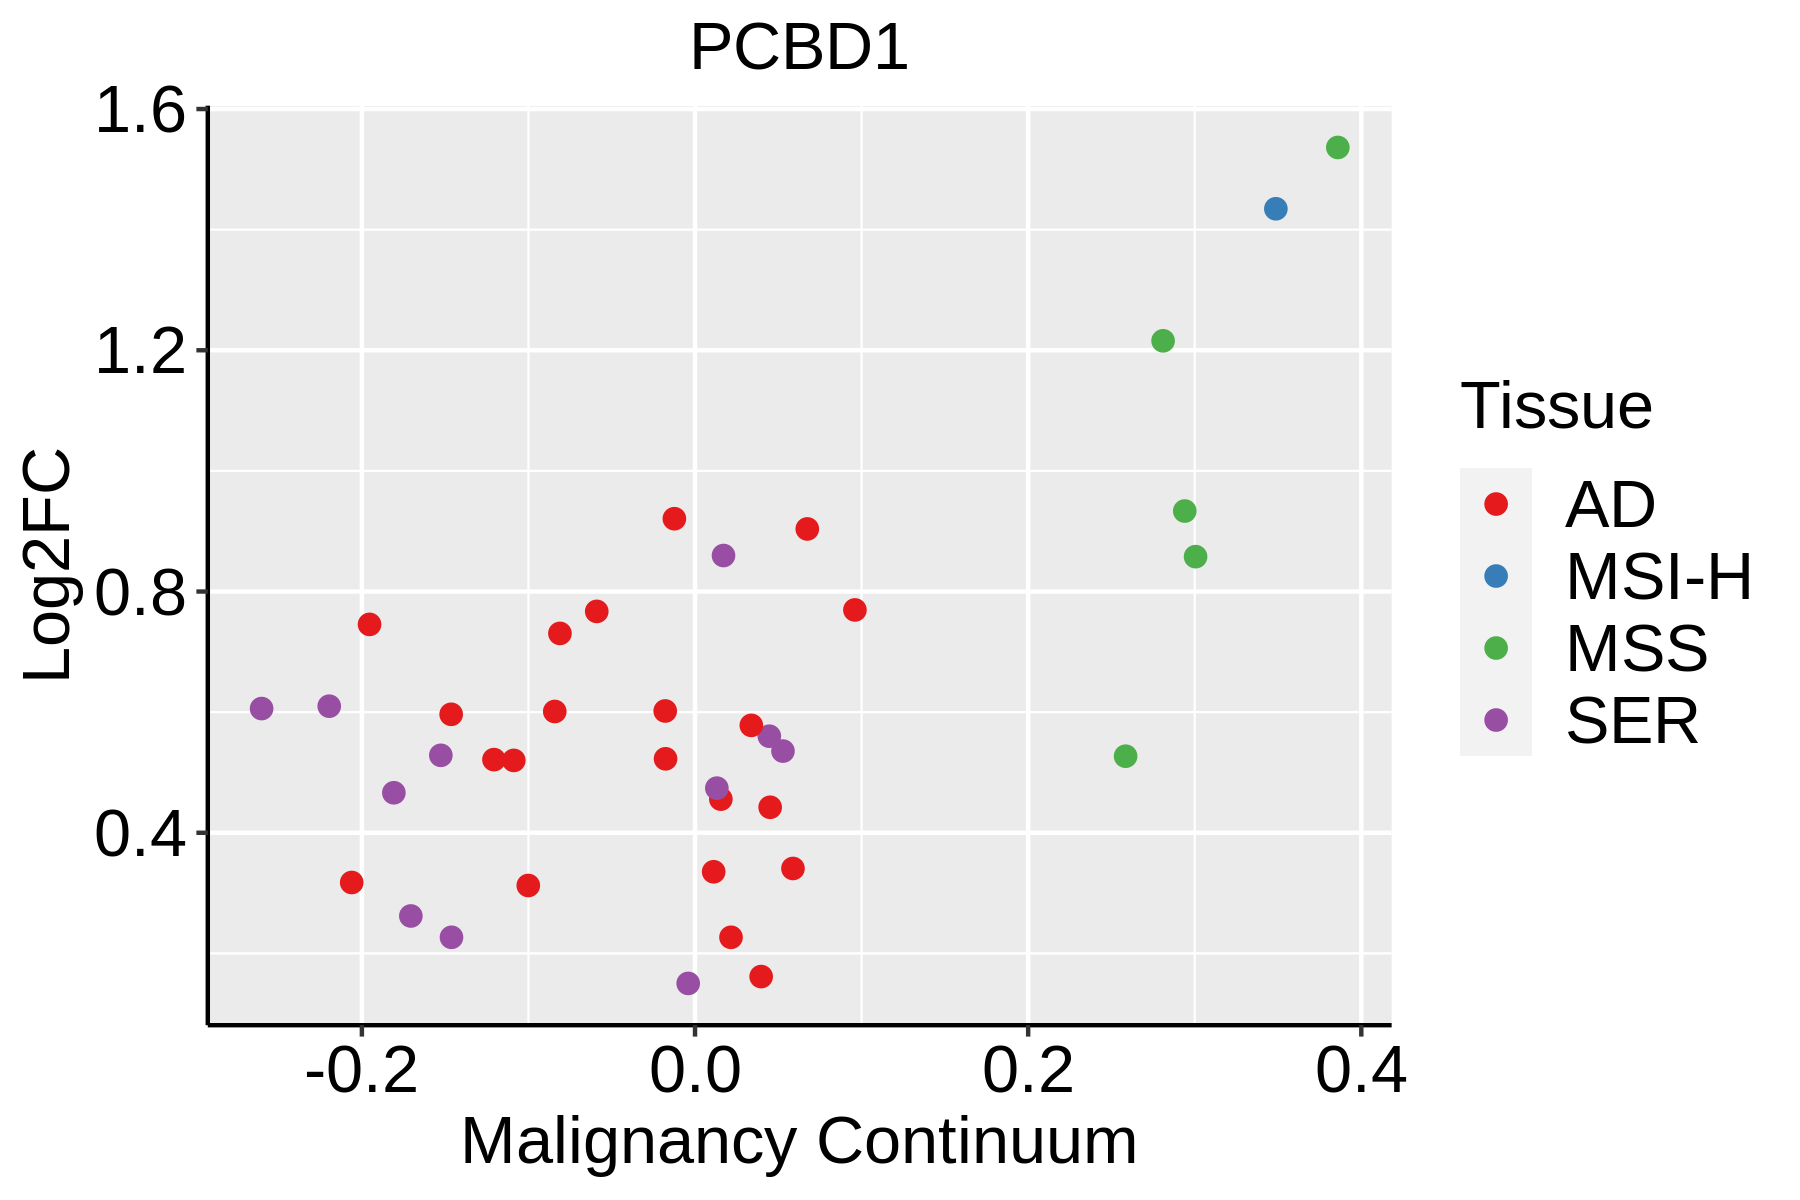 | AD: Adenomas |
| SER: Sessile serrated lesions | ||
| MSI-H: Microsatellite-high colorectal cancer | ||
| MSS: Microsatellite stable colorectal cancer | ||
| Endometrium | 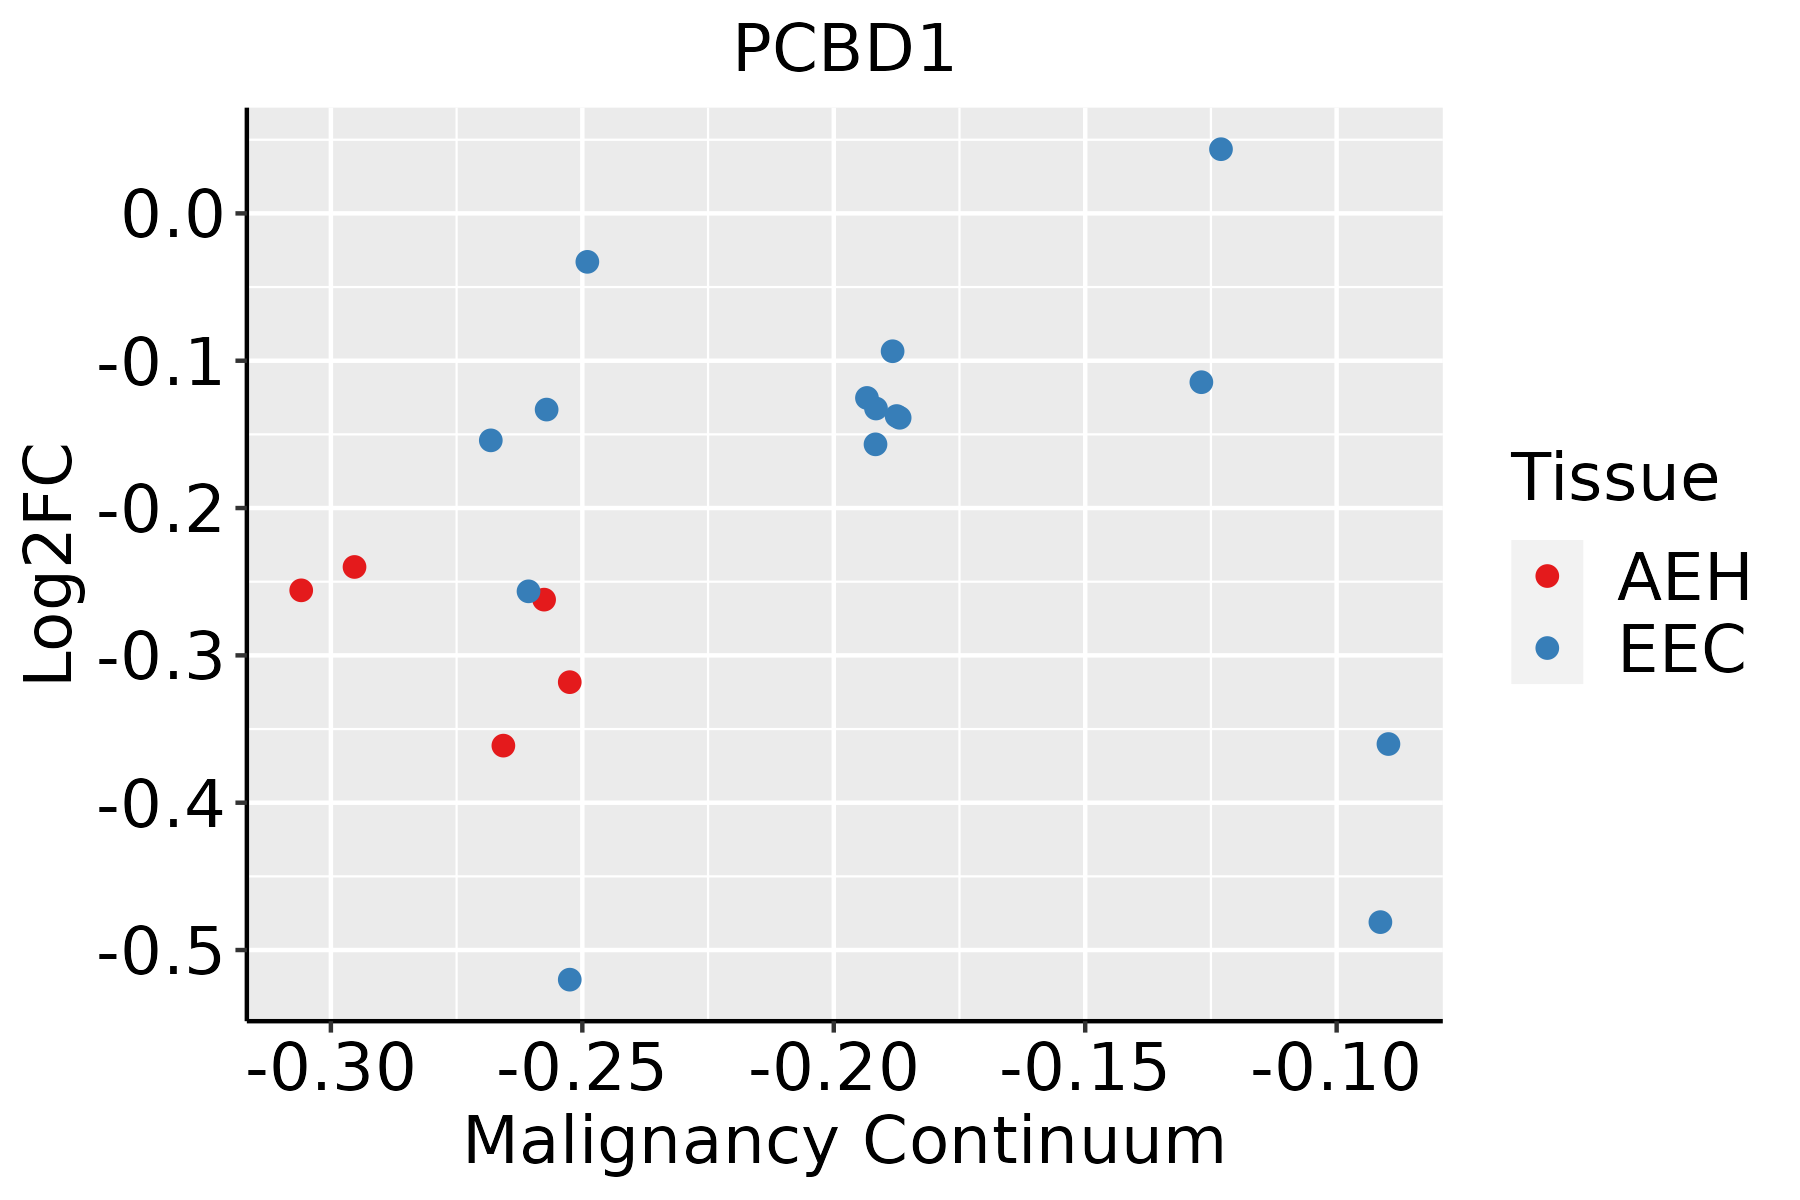 | AEH: Atypical endometrial hyperplasia |
| EEC: Endometrioid Cancer | ||
| Esophagus | 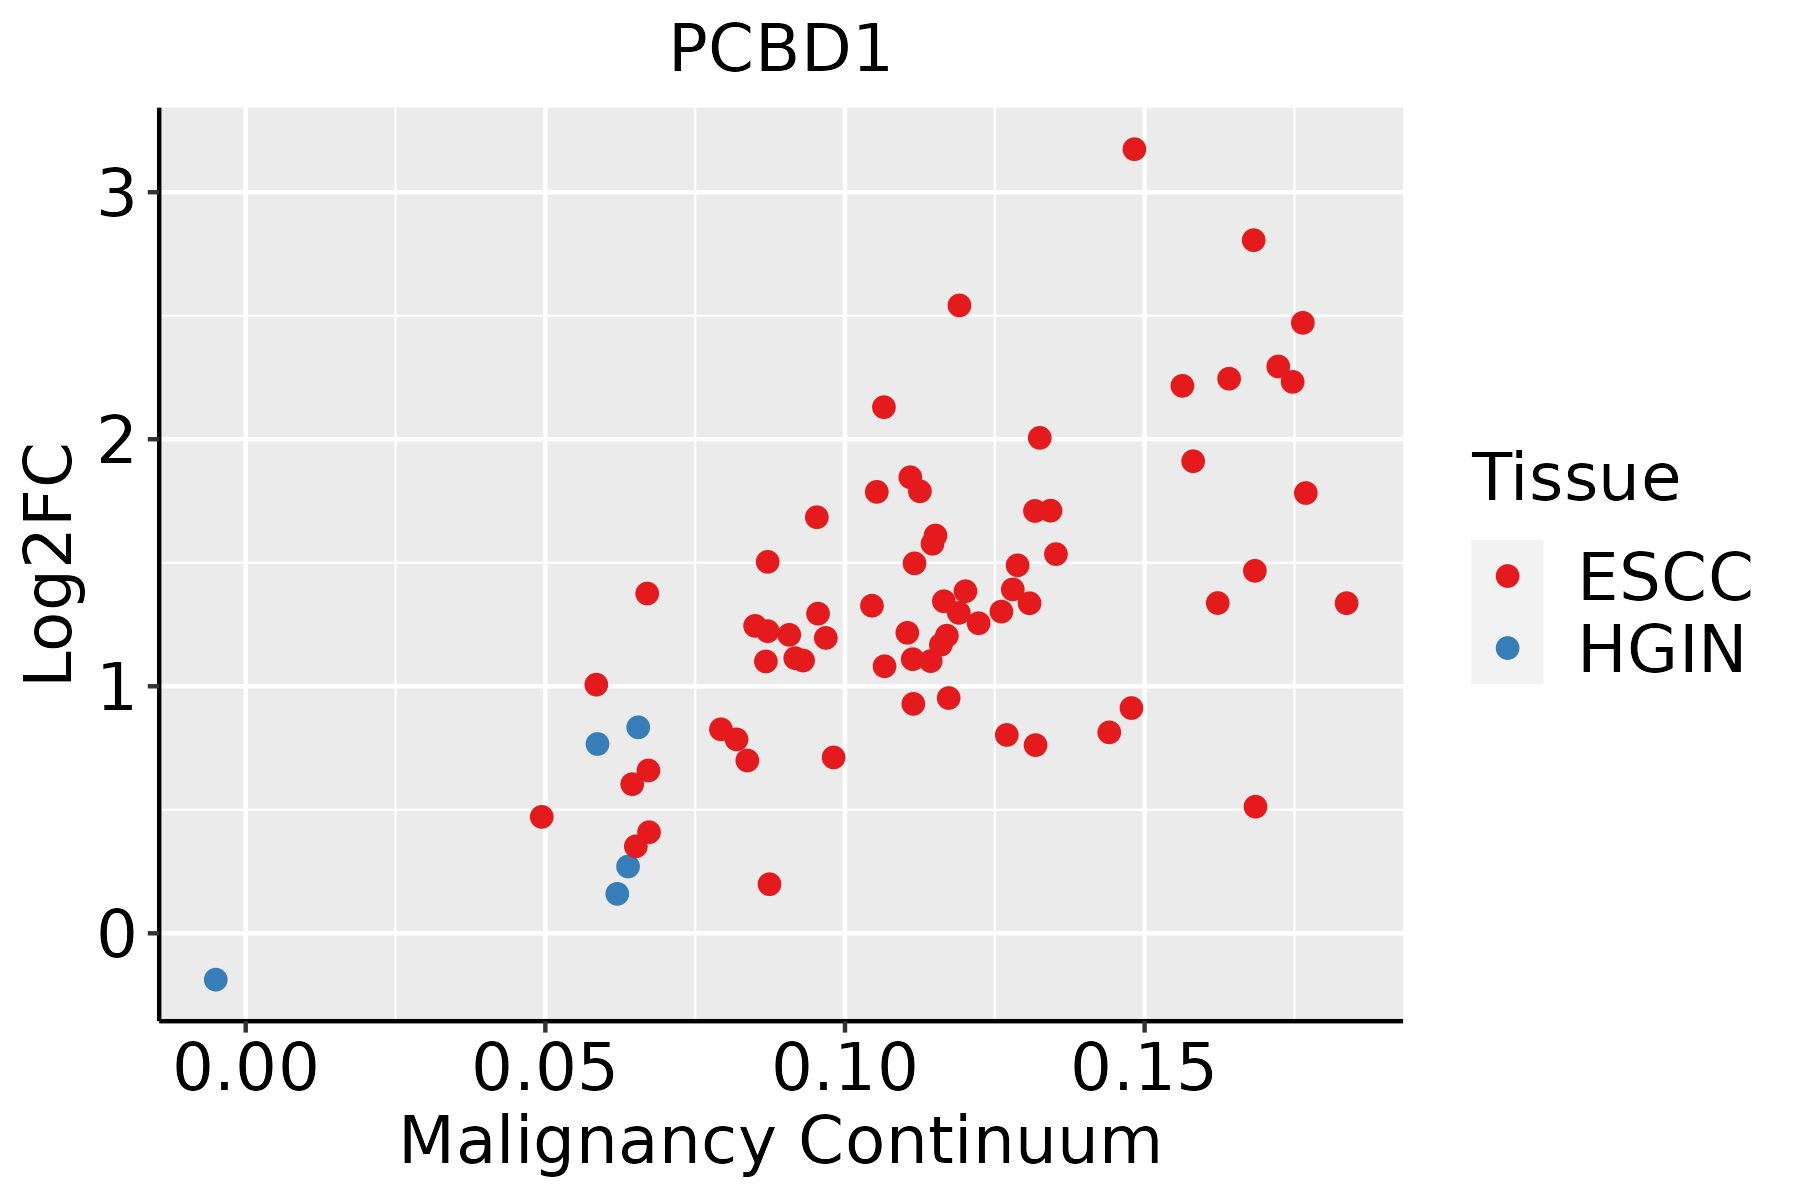 | ESCC: Esophageal squamous cell carcinoma |
| HGIN: High-grade intraepithelial neoplasias | ||
| LGIN: Low-grade intraepithelial neoplasias | ||
| Liver |  | HCC: Hepatocellular carcinoma |
| NAFLD: Non-alcoholic fatty liver disease | ||
| Oral Cavity | 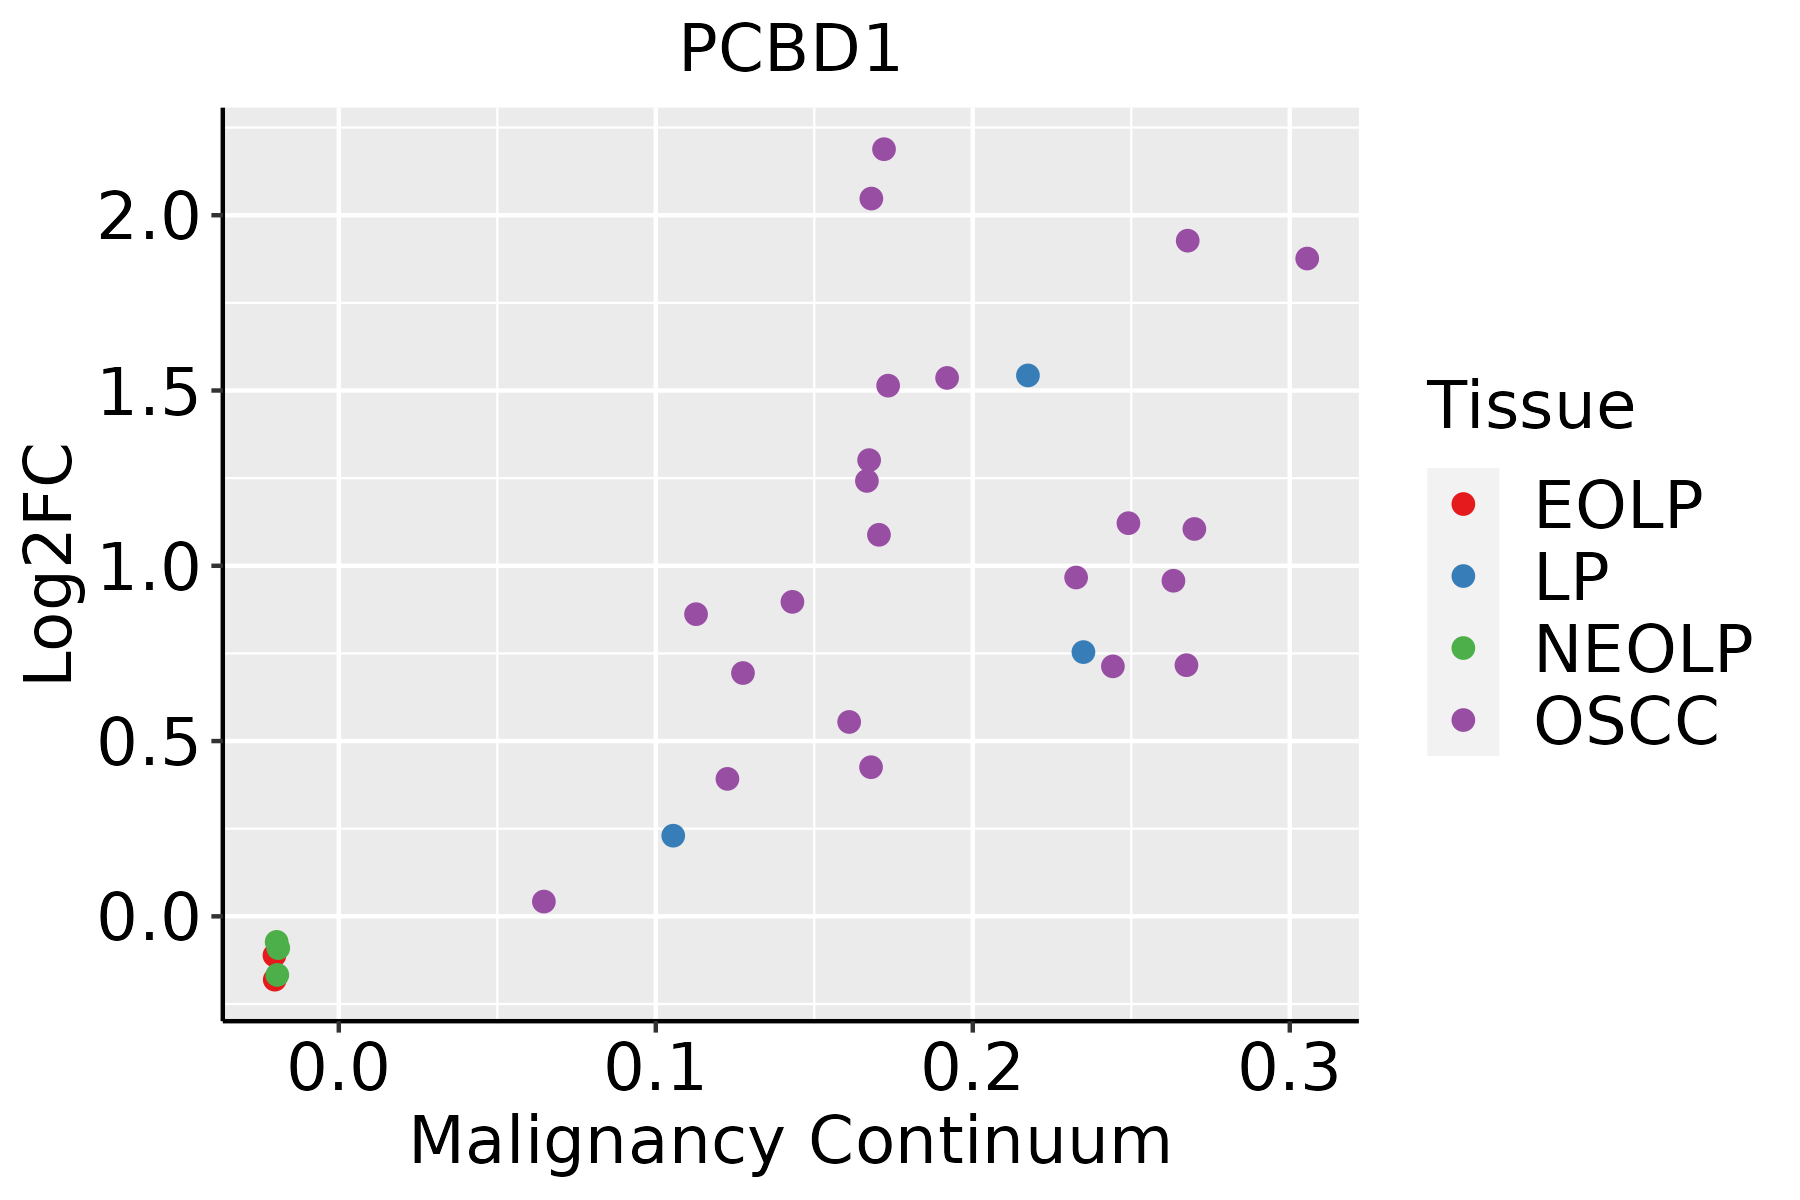 | EOLP: Erosive Oral lichen planus |
| LP: leukoplakia | ||
| NEOLP: Non-erosive oral lichen planus | ||
| OSCC: Oral squamous cell carcinoma | ||
| Prostate | 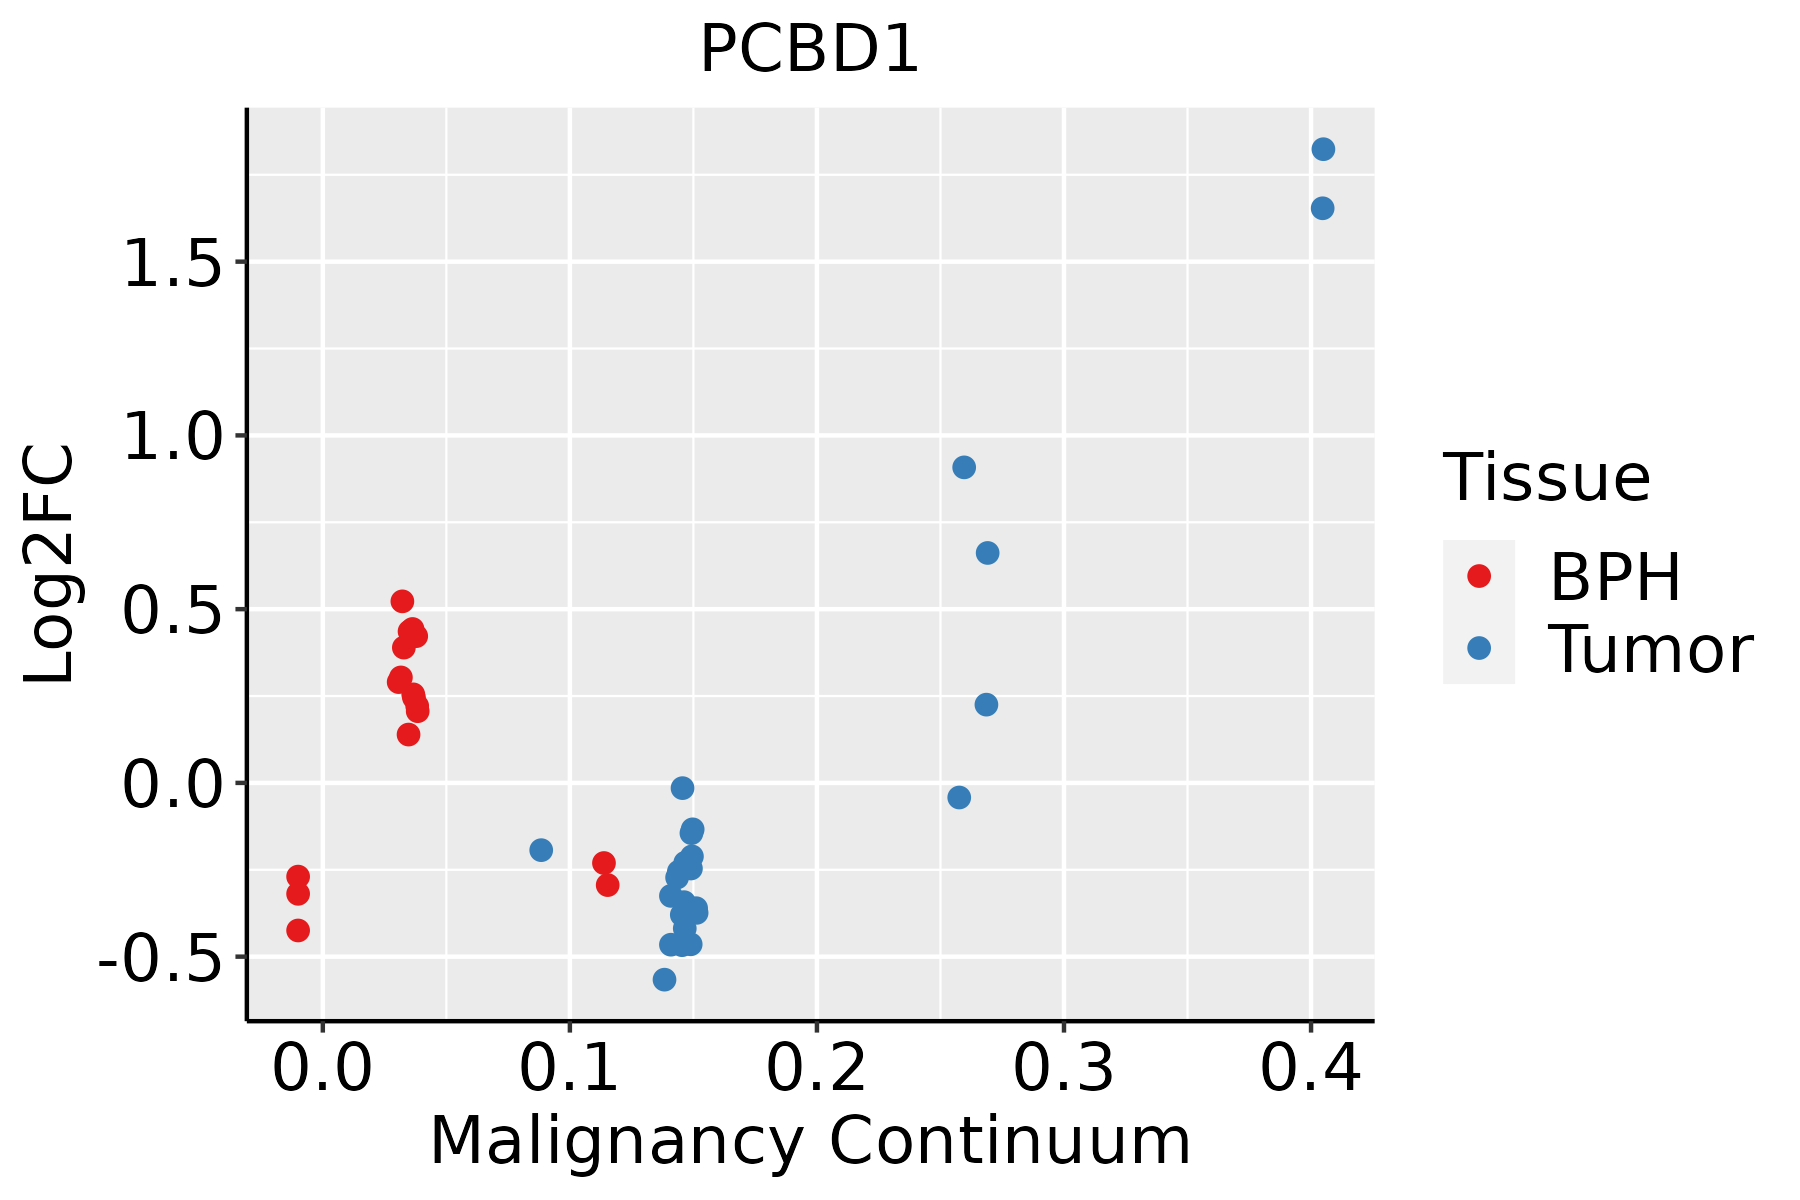 | BPH: Benign Prostatic Hyperplasia |
| Skin |  | AK: Actinic keratosis |
| cSCC: Cutaneous squamous cell carcinoma | ||
| SCCIS:squamous cell carcinoma in situ | ||
| Thyroid | 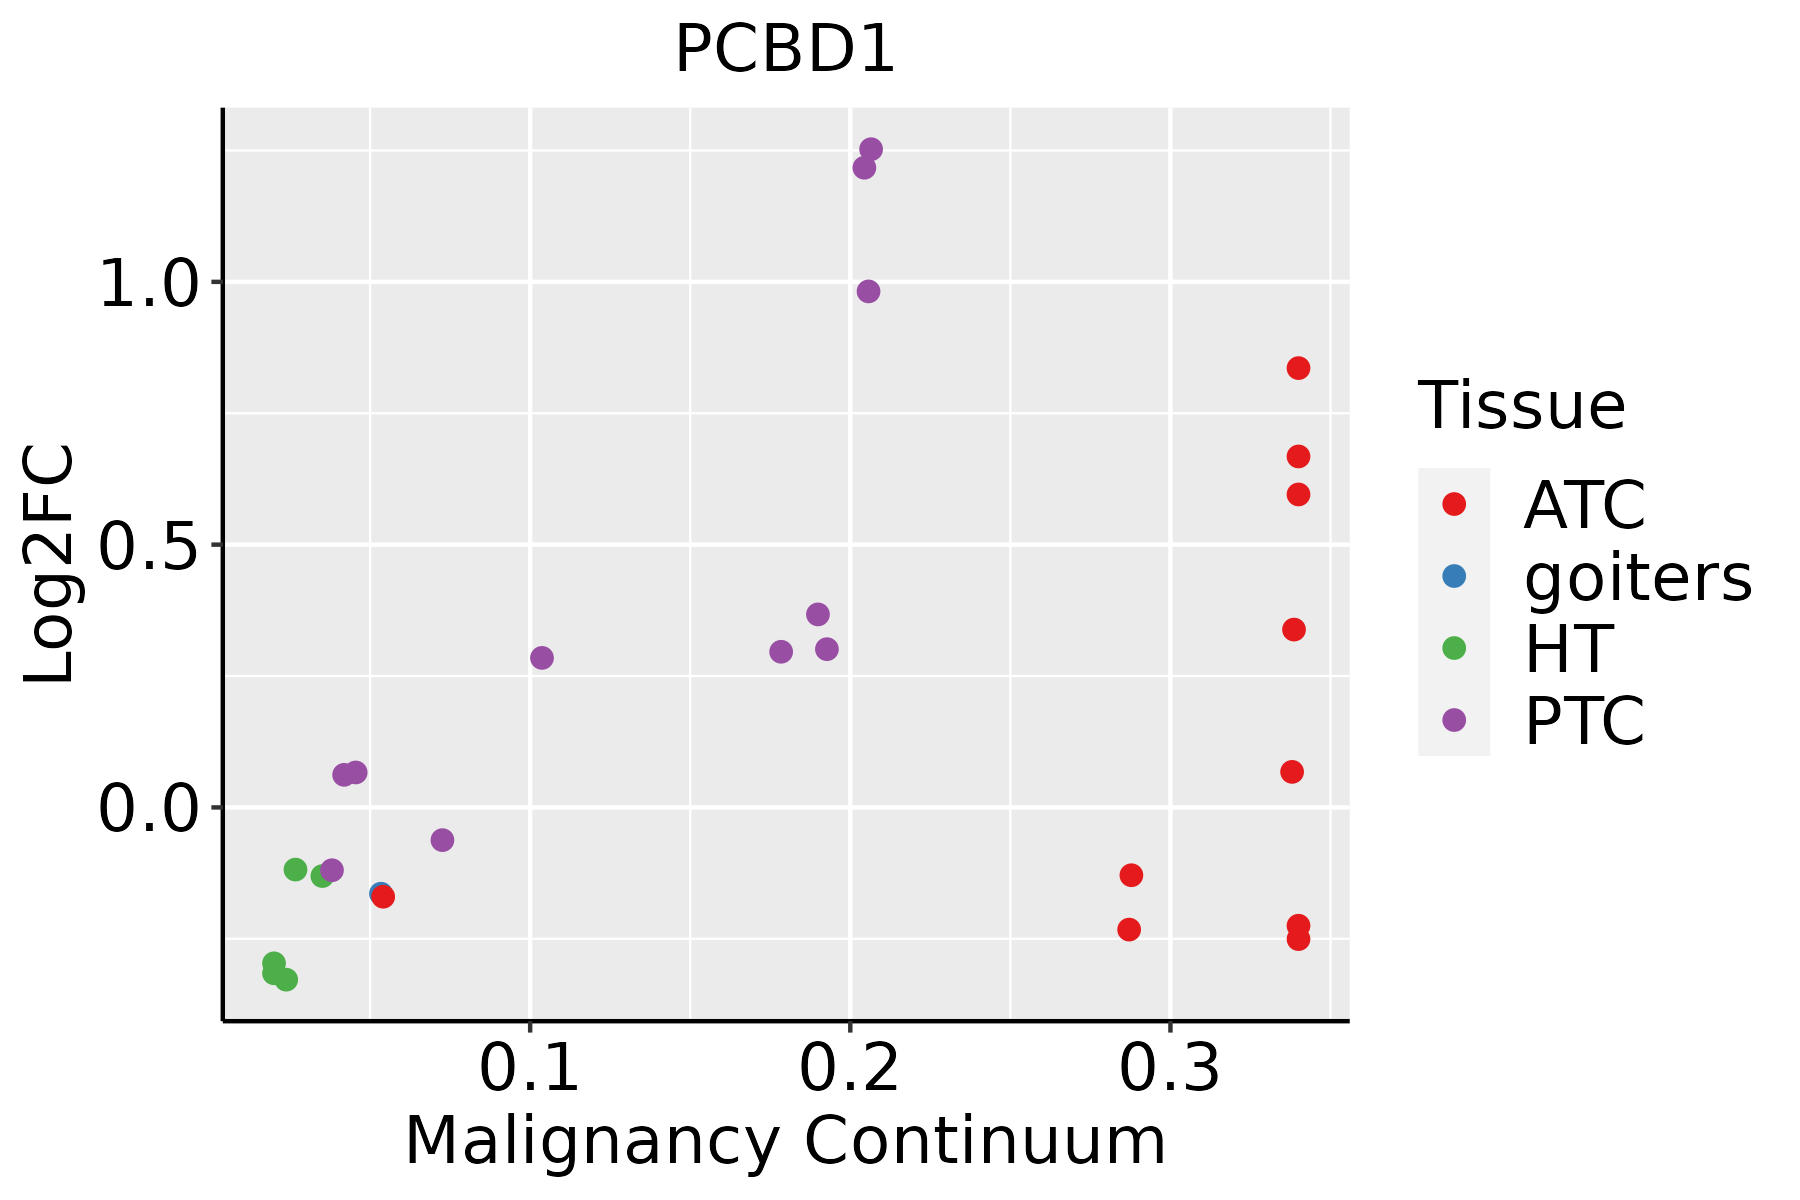 | ATC: Anaplastic thyroid cancer |
| HT: Hashimoto's thyroiditis | ||
| PTC: Papillary thyroid cancer |
| ∗log2FC in expression of this searched gene in stem-like cells from each diseased tissue sample relative to stem-like cells in normal samples in each tissue plotted against the malignancy continuum. Samples are colored based on if they are from different disease stage. |
Top |
Malignant transformation related pathway analysis |
| Find out the enriched GO biological processes and KEGG pathways involved in transition from healthy to precancer to cancer |
| Tissue | Disease Stage | Enriched GO biological Processes |
| Colorectum | AD |  |
| Colorectum | SER |  |
| Colorectum | MSS |  |
| Colorectum | MSI-H |  |
| Colorectum | FAP |  |
| ∗Top 15 enriched GO BP terms are showed in the bar plot of each disease state in each tissue. Each row represents a significant GO biological process which is colored according to the -log10(p.adjust). |
| Page: 1 2 3 4 5 6 7 8 9 |
| GO ID | Tissue | Disease Stage | Description | Gene Ratio | Bg Ratio | pvalue | p.adjust | Count |
| GO:00510989 | Breast | Precancer | regulation of binding | 44/1080 | 363/18723 | 2.59e-06 | 8.65e-05 | 44 |
| GO:00463946 | Breast | Precancer | carboxylic acid biosynthetic process | 32/1080 | 314/18723 | 1.30e-03 | 1.38e-02 | 32 |
| GO:00160536 | Breast | Precancer | organic acid biosynthetic process | 32/1080 | 316/18723 | 1.44e-03 | 1.50e-02 | 32 |
| GO:005109814 | Breast | IDC | regulation of binding | 57/1434 | 363/18723 | 1.59e-07 | 8.76e-06 | 57 |
| GO:001605313 | Breast | IDC | organic acid biosynthetic process | 39/1434 | 316/18723 | 2.13e-03 | 1.99e-02 | 39 |
| GO:004639413 | Breast | IDC | carboxylic acid biosynthetic process | 38/1434 | 314/18723 | 3.39e-03 | 2.83e-02 | 38 |
| GO:005109823 | Breast | DCIS | regulation of binding | 55/1390 | 363/18723 | 3.14e-07 | 1.48e-05 | 55 |
| GO:001605322 | Breast | DCIS | organic acid biosynthetic process | 38/1390 | 316/18723 | 2.22e-03 | 2.04e-02 | 38 |
| GO:004639422 | Breast | DCIS | carboxylic acid biosynthetic process | 37/1390 | 314/18723 | 3.56e-03 | 2.92e-02 | 37 |
| GO:0051098 | Colorectum | AD | regulation of binding | 126/3918 | 363/18723 | 6.01e-10 | 4.88e-08 | 126 |
| GO:0043393 | Colorectum | AD | regulation of protein binding | 68/3918 | 196/18723 | 5.17e-06 | 1.34e-04 | 68 |
| GO:0006066 | Colorectum | AD | alcohol metabolic process | 106/3918 | 353/18723 | 3.02e-05 | 5.57e-04 | 106 |
| GO:0006520 | Colorectum | AD | cellular amino acid metabolic process | 81/3918 | 284/18723 | 1.37e-03 | 1.19e-02 | 81 |
| GO:00510981 | Colorectum | SER | regulation of binding | 97/2897 | 363/18723 | 1.98e-08 | 1.43e-06 | 97 |
| GO:00433931 | Colorectum | SER | regulation of protein binding | 54/2897 | 196/18723 | 1.00e-05 | 3.31e-04 | 54 |
| GO:00060661 | Colorectum | SER | alcohol metabolic process | 79/2897 | 353/18723 | 3.50e-04 | 5.50e-03 | 79 |
| GO:00065201 | Colorectum | SER | cellular amino acid metabolic process | 61/2897 | 284/18723 | 4.20e-03 | 3.41e-02 | 61 |
| GO:00510982 | Colorectum | MSS | regulation of binding | 113/3467 | 363/18723 | 3.55e-09 | 2.41e-07 | 113 |
| GO:00433932 | Colorectum | MSS | regulation of protein binding | 62/3467 | 196/18723 | 6.44e-06 | 1.69e-04 | 62 |
| GO:00060662 | Colorectum | MSS | alcohol metabolic process | 92/3467 | 353/18723 | 2.57e-04 | 3.46e-03 | 92 |
| Page: 1 2 3 4 5 6 |
| Pathway ID | Tissue | Disease Stage | Description | Gene Ratio | Bg Ratio | pvalue | p.adjust | qvalue | Count |
| Page: 1 |
Top |
Cell-cell communication analysis |
| Identification of potential cell-cell interactions between two cell types and their ligand-receptor pairs for different disease states |
| Ligand | Receptor | LRpair | Pathway | Tissue | Disease Stage |
| Page: 1 |
Top |
Single-cell gene regulatory network inference analysis |
| Find out the significant the regulons (TFs) and the target genes of each regulon across cell types for different disease states |
| TF | Cell Type | Tissue | Disease Stage | Target Gene | RSS | Regulon Activity |
| ∗The dot plots of a searched regulon are shown for all cell subpopulations in each disease state of each tissue based on the regulon specific score inferred using pySCENIC and by calculating the average expression. |
| Page: 1 |
Top |
Somatic mutation of malignant transformation related genes |
| Annotation of somatic variants for genes involved in malignant transformation |
| Hugo Symbol | Variant Class | Variant Classification | dbSNP RS | HGVSc | HGVSp | HGVSp Short | SWISSPROT | BIOTYPE | SIFT | PolyPhen | Tumor Sample Barcode | Tissue | Histology | Sex | Age | Stage | Therapy Types | Drugs | Outcome |
| PCBD1 | insertion | Frame_Shift_Ins | novel | c.276_277insTCCTTGCTGTGGGATGTGCCAGTGTCCCC | p.Ala93SerfsTer17 | p.A93Sfs*17 | P61457 | protein_coding | TCGA-AN-A0FT-01 | Breast | breast invasive carcinoma | Female | <65 | I/II | Unknown | Unknown | SD | ||
| PCBD1 | SNV | Missense_Mutation | novel | c.280N>G | p.Ser94Gly | p.S94G | P61457 | protein_coding | tolerated(0.12) | benign(0.106) | TCGA-CM-6171-01 | Colorectum | colon adenocarcinoma | Female | >=65 | I/II | Unknown | Unknown | SD |
| PCBD1 | SNV | Missense_Mutation | novel | c.89N>T | p.Gly30Val | p.G30V | P61457 | protein_coding | deleterious(0) | possibly_damaging(0.846) | TCGA-A5-A0G2-01 | Endometrium | uterine corpus endometrioid carcinoma | Female | <65 | III/IV | Unknown | Unknown | SD |
| PCBD1 | SNV | Missense_Mutation | rs368664467 | c.250G>A | p.Gly84Ser | p.G84S | P61457 | protein_coding | deleterious(0) | probably_damaging(0.992) | TCGA-A5-A0GQ-01 | Endometrium | uterine corpus endometrioid carcinoma | Female | >=65 | I/II | Unknown | Unknown | SD |
| PCBD1 | SNV | Missense_Mutation | rs11554325 | c.91N>T | p.Arg31Cys | p.R31C | P61457 | protein_coding | deleterious(0) | probably_damaging(0.999) | TCGA-B5-A11E-01 | Endometrium | uterine corpus endometrioid carcinoma | Female | <65 | I/II | Unknown | Unknown | SD |
| PCBD1 | SNV | Missense_Mutation | novel | c.224T>C | p.Ile75Thr | p.I75T | P61457 | protein_coding | deleterious(0.03) | probably_damaging(0.989) | TCGA-B5-A11O-01 | Endometrium | uterine corpus endometrioid carcinoma | Female | <65 | I/II | Unknown | Unknown | PD |
| PCBD1 | SNV | Missense_Mutation | novel | c.65C>A | p.Ala22Asp | p.A22D | P61457 | protein_coding | tolerated(0.3) | benign(0.007) | TCGA-R5-A7ZI-01 | Stomach | stomach adenocarcinoma | Female | <65 | III/IV | Unknown | Unknown | SD |
| Page: 1 |
Top |
Related drugs of malignant transformation related genes |
| Identification of chemicals and drugs interact with genes involved in malignant transfromation |
| (DGIdb 4.0) |
| Entrez ID | Symbol | Category | Interaction Types | Drug Claim Name | Drug Name | PMIDs |
| 5092 | PCBD1 | ENZYME | H2O2 | 14530988 | ||
| 5092 | PCBD1 | ENZYME | ANTISERUM | 10403117 |
| Page: 1 |

Copyright 2023-Present -The University of Texas Health Science Center at Houston |