
|
|||||
|
 | |
| |
| |
| |
| |
| |
|
Gene: PBXIP1 |
Gene summary for PBXIP1 |
| Gene information | Species | Human | Gene symbol | PBXIP1 | Gene ID | 57326 |
| Gene name | PBX homeobox interacting protein 1 | |
| Gene Alias | HPIP | |
| Cytomap | 1q21.3 | |
| Gene Type | protein-coding | GO ID | GO:0001501 | UniProtAcc | Q96AQ6 |
Top |
Malignant transformation analysis |
| Identification of the aberrant gene expression in precancerous and cancerous lesions by comparing the gene expression of stem-like cells in diseased tissues with normal stem cells |
| Entrez ID | Symbol | Replicates | Species | Organ | Tissue | Adj P-value | Log2FC | Malignancy |
| 57326 | PBXIP1 | HTA11_3410_2000001011 | Human | Colorectum | AD | 4.62e-05 | 1.65e-01 | 0.0155 |
| 57326 | PBXIP1 | HTA11_2487_2000001011 | Human | Colorectum | SER | 3.25e-02 | 1.28e-01 | -0.1808 |
| 57326 | PBXIP1 | HTA11_1938_2000001011 | Human | Colorectum | AD | 4.24e-11 | 4.08e-01 | -0.0811 |
| 57326 | PBXIP1 | HTA11_347_2000001011 | Human | Colorectum | AD | 3.63e-12 | 2.56e-01 | -0.1954 |
| 57326 | PBXIP1 | HTA11_3361_2000001011 | Human | Colorectum | AD | 4.17e-09 | 2.96e-01 | -0.1207 |
| 57326 | PBXIP1 | HTA11_83_2000001011 | Human | Colorectum | SER | 9.83e-05 | 3.52e-01 | -0.1526 |
| 57326 | PBXIP1 | HTA11_696_2000001011 | Human | Colorectum | AD | 5.54e-08 | 2.47e-01 | -0.1464 |
| 57326 | PBXIP1 | HTA11_866_2000001011 | Human | Colorectum | AD | 4.36e-05 | 2.57e-01 | -0.1001 |
| 57326 | PBXIP1 | HTA11_1391_2000001011 | Human | Colorectum | AD | 7.88e-08 | 2.66e-01 | -0.059 |
| 57326 | PBXIP1 | HTA11_2992_2000001011 | Human | Colorectum | SER | 2.68e-04 | 2.44e-01 | -0.1706 |
| 57326 | PBXIP1 | HTA11_866_3004761011 | Human | Colorectum | AD | 6.58e-15 | 3.22e-01 | 0.096 |
| 57326 | PBXIP1 | HTA11_10711_2000001011 | Human | Colorectum | AD | 2.45e-09 | 2.77e-01 | 0.0338 |
| 57326 | PBXIP1 | HTA11_7696_3000711011 | Human | Colorectum | AD | 3.60e-11 | 3.05e-01 | 0.0674 |
| 57326 | PBXIP1 | HTA11_6818_2000001011 | Human | Colorectum | AD | 1.65e-04 | 4.61e-01 | 0.0112 |
| 57326 | PBXIP1 | HTA11_6818_2000001021 | Human | Colorectum | AD | 1.22e-04 | 2.56e-01 | 0.0588 |
| 57326 | PBXIP1 | HTA11_99999965062_69753 | Human | Colorectum | MSI-H | 1.29e-05 | 8.05e-01 | 0.3487 |
| 57326 | PBXIP1 | HTA11_99999971662_82457 | Human | Colorectum | MSS | 2.33e-07 | 3.47e-01 | 0.3859 |
| 57326 | PBXIP1 | HTA11_99999973899_84307 | Human | Colorectum | MSS | 3.08e-02 | 1.56e-01 | 0.2585 |
| 57326 | PBXIP1 | HTA11_99999974143_84620 | Human | Colorectum | MSS | 5.86e-07 | 2.31e-01 | 0.3005 |
| 57326 | PBXIP1 | LZE4T | Human | Esophagus | ESCC | 1.29e-04 | 2.01e-01 | 0.0811 |
| Page: 1 2 3 4 5 6 7 |
| Tissue | Expression Dynamics | Abbreviation |
| Colorectum (GSE201348) |  | FAP: Familial adenomatous polyposis |
| CRC: Colorectal cancer | ||
| Colorectum (HTA11) |  | AD: Adenomas |
| SER: Sessile serrated lesions | ||
| MSI-H: Microsatellite-high colorectal cancer | ||
| MSS: Microsatellite stable colorectal cancer | ||
| Esophagus | 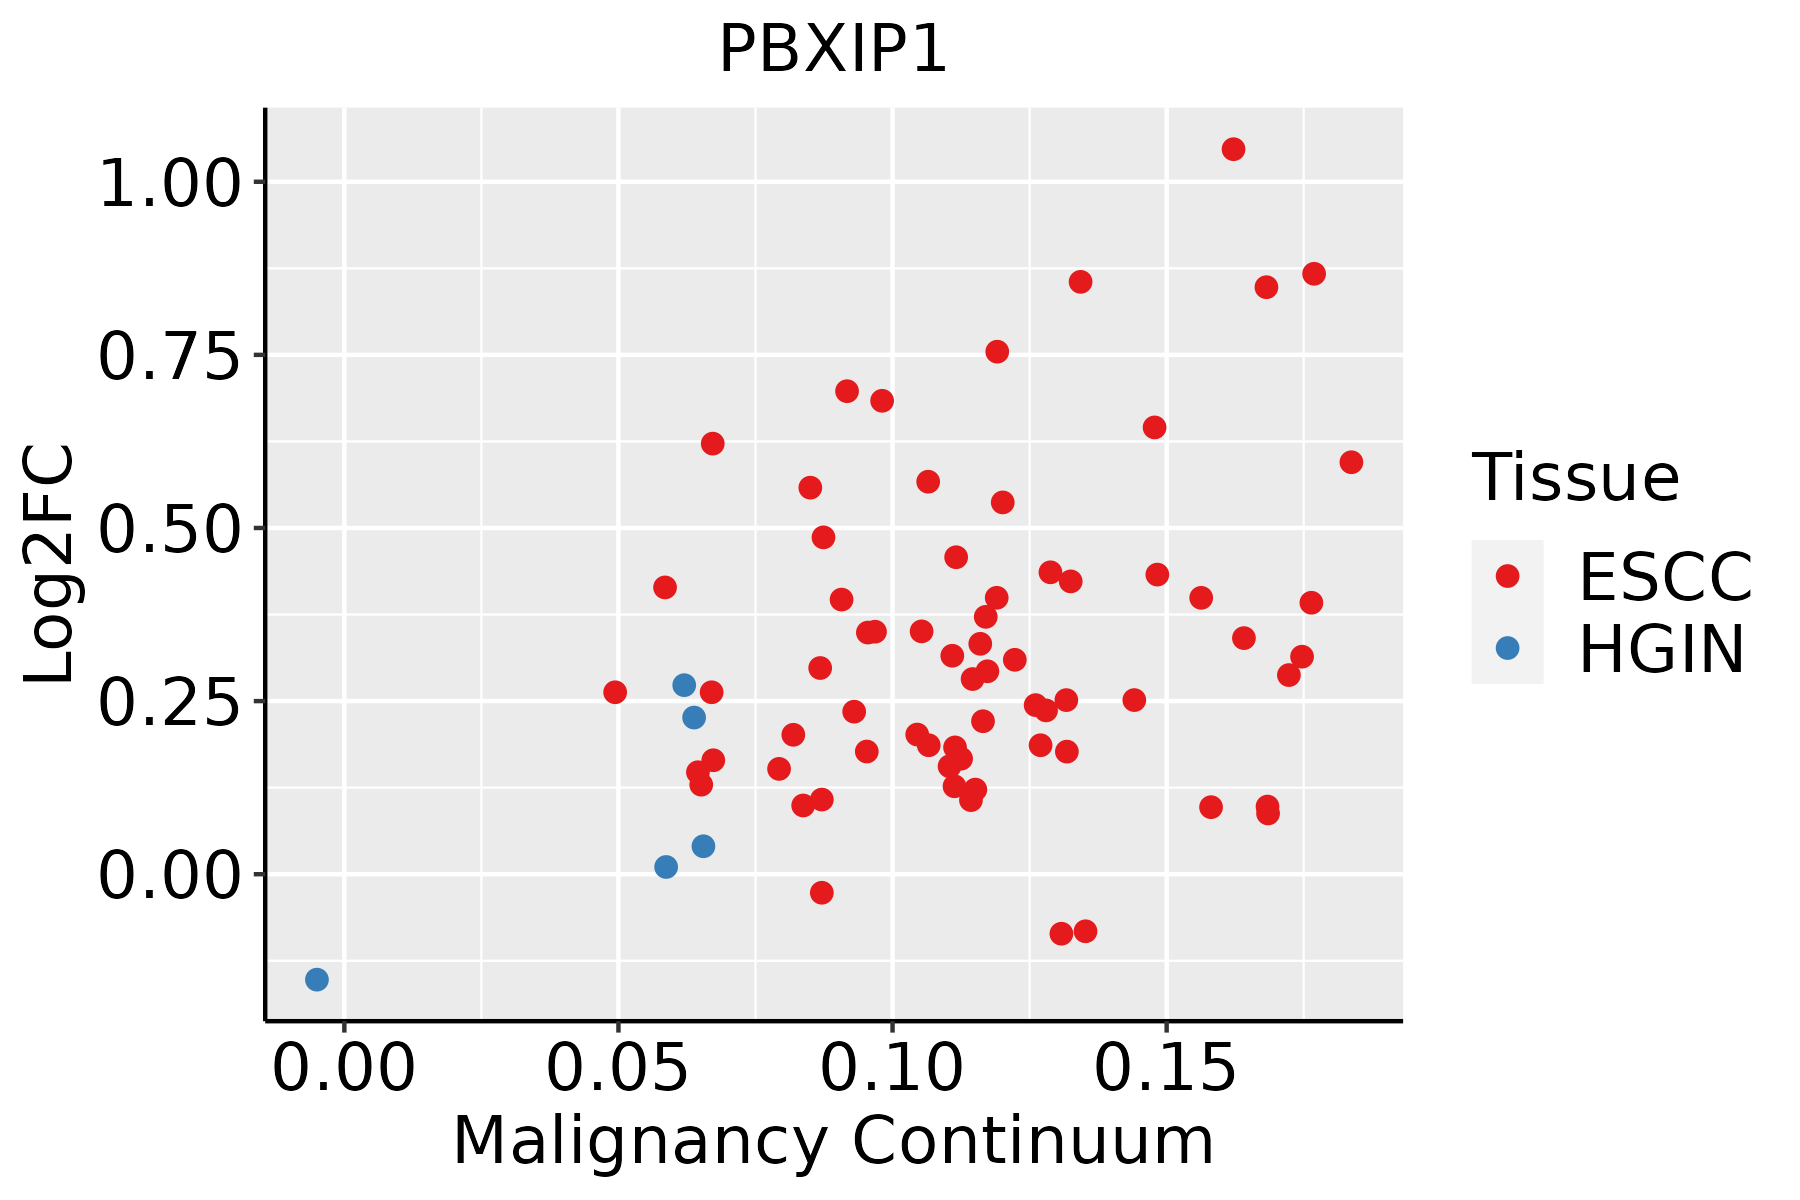 | ESCC: Esophageal squamous cell carcinoma |
| HGIN: High-grade intraepithelial neoplasias | ||
| LGIN: Low-grade intraepithelial neoplasias | ||
| Liver |  | HCC: Hepatocellular carcinoma |
| NAFLD: Non-alcoholic fatty liver disease | ||
| Oral Cavity |  | EOLP: Erosive Oral lichen planus |
| LP: leukoplakia | ||
| NEOLP: Non-erosive oral lichen planus | ||
| OSCC: Oral squamous cell carcinoma | ||
| Prostate | 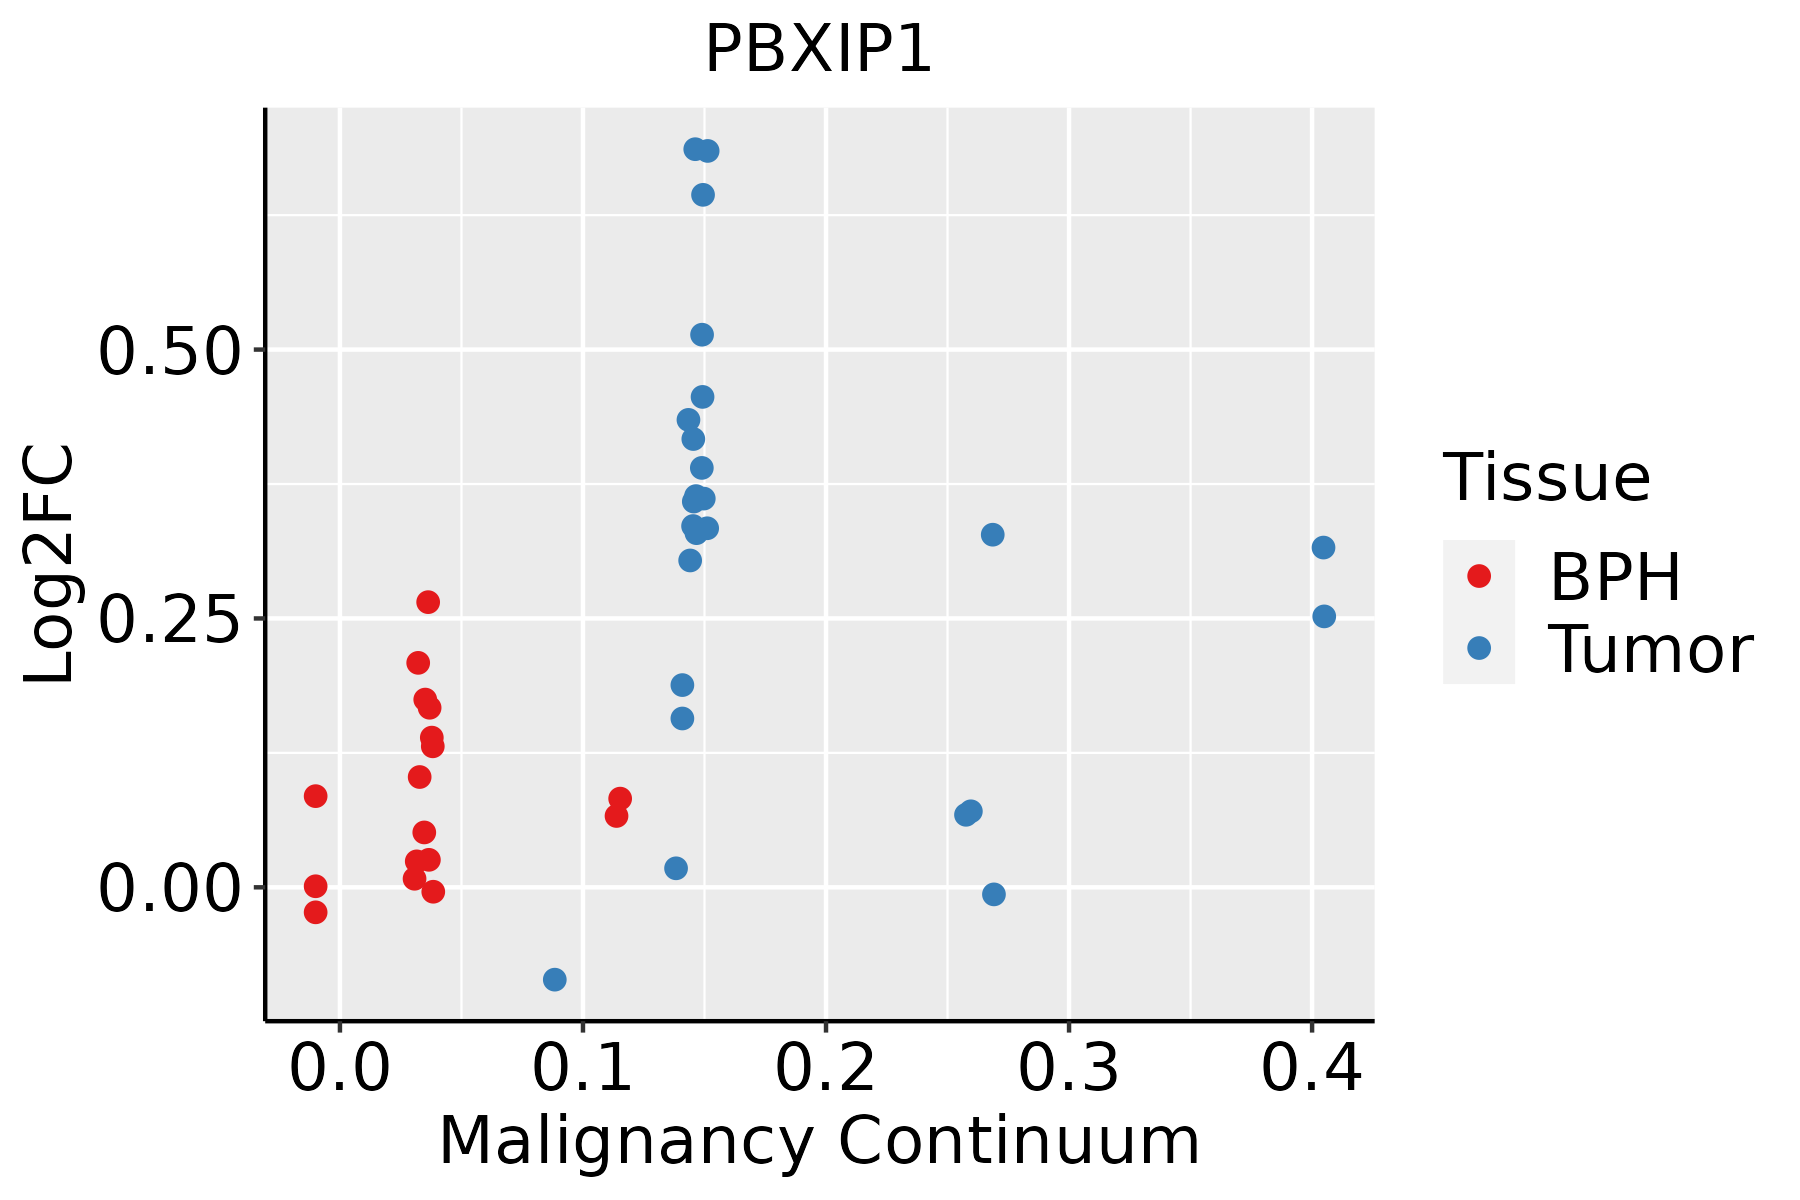 | BPH: Benign Prostatic Hyperplasia |
| Thyroid | 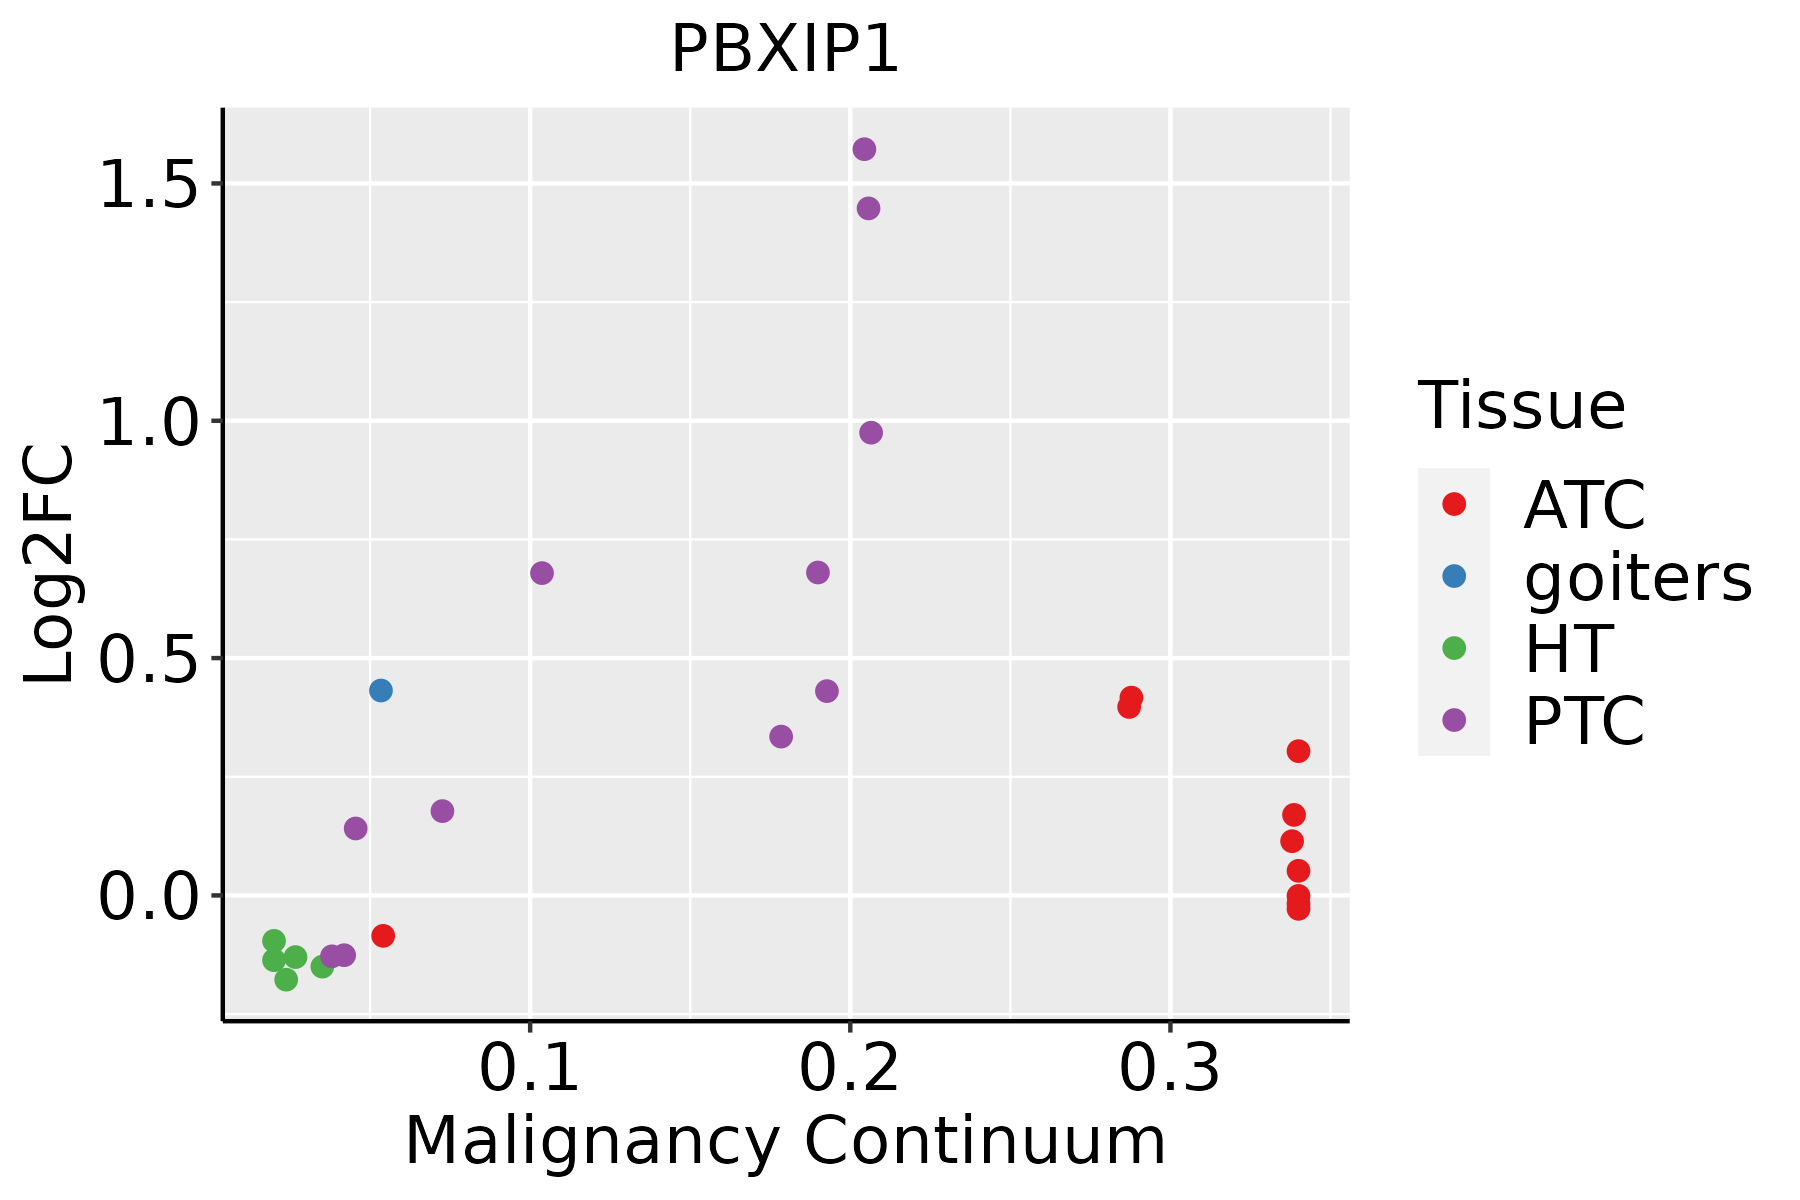 | ATC: Anaplastic thyroid cancer |
| HT: Hashimoto's thyroiditis | ||
| PTC: Papillary thyroid cancer |
| ∗log2FC in expression of this searched gene in stem-like cells from each diseased tissue sample relative to stem-like cells in normal samples in each tissue plotted against the malignancy continuum. Samples are colored based on if they are from different disease stage. |
Top |
Malignant transformation related pathway analysis |
| Find out the enriched GO biological processes and KEGG pathways involved in transition from healthy to precancer to cancer |
| Tissue | Disease Stage | Enriched GO biological Processes |
| Colorectum | AD |  |
| Colorectum | SER |  |
| Colorectum | MSS |  |
| Colorectum | MSI-H |  |
| Colorectum | FAP |  |
| ∗Top 15 enriched GO BP terms are showed in the bar plot of each disease state in each tissue. Each row represents a significant GO biological process which is colored according to the -log10(p.adjust). |
| Page: 1 2 3 4 5 6 7 8 9 |
| GO ID | Tissue | Disease Stage | Description | Gene Ratio | Bg Ratio | pvalue | p.adjust | Count |
| GO:0051098 | Colorectum | AD | regulation of binding | 126/3918 | 363/18723 | 6.01e-10 | 4.88e-08 | 126 |
| GO:0022411 | Colorectum | AD | cellular component disassembly | 147/3918 | 443/18723 | 8.53e-10 | 6.76e-08 | 147 |
| GO:0043087 | Colorectum | AD | regulation of GTPase activity | 110/3918 | 348/18723 | 1.64e-06 | 5.03e-05 | 110 |
| GO:0030111 | Colorectum | AD | regulation of Wnt signaling pathway | 102/3918 | 328/18723 | 8.51e-06 | 2.03e-04 | 102 |
| GO:0016055 | Colorectum | AD | Wnt signaling pathway | 130/3918 | 444/18723 | 1.60e-05 | 3.37e-04 | 130 |
| GO:0198738 | Colorectum | AD | cell-cell signaling by wnt | 130/3918 | 446/18723 | 2.02e-05 | 4.10e-04 | 130 |
| GO:0030177 | Colorectum | AD | positive regulation of Wnt signaling pathway | 45/3918 | 140/18723 | 1.23e-03 | 1.09e-02 | 45 |
| GO:00224111 | Colorectum | SER | cellular component disassembly | 114/2897 | 443/18723 | 1.17e-08 | 9.59e-07 | 114 |
| GO:00510981 | Colorectum | SER | regulation of binding | 97/2897 | 363/18723 | 1.98e-08 | 1.43e-06 | 97 |
| GO:00160551 | Colorectum | SER | Wnt signaling pathway | 97/2897 | 444/18723 | 2.02e-04 | 3.68e-03 | 97 |
| GO:01987381 | Colorectum | SER | cell-cell signaling by wnt | 97/2897 | 446/18723 | 2.39e-04 | 4.11e-03 | 97 |
| GO:00301111 | Colorectum | SER | regulation of Wnt signaling pathway | 75/2897 | 328/18723 | 2.47e-04 | 4.20e-03 | 75 |
| GO:00430871 | Colorectum | SER | regulation of GTPase activity | 77/2897 | 348/18723 | 5.90e-04 | 8.07e-03 | 77 |
| GO:00510982 | Colorectum | MSS | regulation of binding | 113/3467 | 363/18723 | 3.55e-09 | 2.41e-07 | 113 |
| GO:00224112 | Colorectum | MSS | cellular component disassembly | 130/3467 | 443/18723 | 1.44e-08 | 8.46e-07 | 130 |
| GO:00301112 | Colorectum | MSS | regulation of Wnt signaling pathway | 98/3467 | 328/18723 | 3.37e-07 | 1.36e-05 | 98 |
| GO:00160552 | Colorectum | MSS | Wnt signaling pathway | 124/3467 | 444/18723 | 6.06e-07 | 2.26e-05 | 124 |
| GO:01987382 | Colorectum | MSS | cell-cell signaling by wnt | 124/3467 | 446/18723 | 7.83e-07 | 2.77e-05 | 124 |
| GO:00430872 | Colorectum | MSS | regulation of GTPase activity | 101/3467 | 348/18723 | 1.00e-06 | 3.46e-05 | 101 |
| GO:00301771 | Colorectum | MSS | positive regulation of Wnt signaling pathway | 44/3467 | 140/18723 | 1.57e-04 | 2.28e-03 | 44 |
| Page: 1 2 3 4 5 6 7 8 9 |
| Pathway ID | Tissue | Disease Stage | Description | Gene Ratio | Bg Ratio | pvalue | p.adjust | qvalue | Count |
| Page: 1 |
Top |
Cell-cell communication analysis |
| Identification of potential cell-cell interactions between two cell types and their ligand-receptor pairs for different disease states |
| Ligand | Receptor | LRpair | Pathway | Tissue | Disease Stage |
| Page: 1 |
Top |
Single-cell gene regulatory network inference analysis |
| Find out the significant the regulons (TFs) and the target genes of each regulon across cell types for different disease states |
| TF | Cell Type | Tissue | Disease Stage | Target Gene | RSS | Regulon Activity |
| ∗The dot plots of a searched regulon are shown for all cell subpopulations in each disease state of each tissue based on the regulon specific score inferred using pySCENIC and by calculating the average expression. |
| Page: 1 |
Top |
Somatic mutation of malignant transformation related genes |
| Annotation of somatic variants for genes involved in malignant transformation |
| Hugo Symbol | Variant Class | Variant Classification | dbSNP RS | HGVSc | HGVSp | HGVSp Short | SWISSPROT | BIOTYPE | SIFT | PolyPhen | Tumor Sample Barcode | Tissue | Histology | Sex | Age | Stage | Therapy Types | Drugs | Outcome |
| PBXIP1 | SNV | Missense_Mutation | novel | c.129C>G | p.Ser43Arg | p.S43R | Q96AQ6 | protein_coding | deleterious(0.01) | benign(0.408) | TCGA-A7-A0CJ-01 | Breast | breast invasive carcinoma | Female | <65 | I/II | Chemotherapy | cytoxan | SD |
| PBXIP1 | SNV | Missense_Mutation | c.772C>G | p.Pro258Ala | p.P258A | Q96AQ6 | protein_coding | tolerated(0.13) | benign(0.085) | TCGA-A8-A083-01 | Breast | breast invasive carcinoma | Female | >=65 | I/II | Unknown | Unknown | SD | |
| PBXIP1 | SNV | Missense_Mutation | c.1937N>T | p.Asp646Val | p.D646V | Q96AQ6 | protein_coding | deleterious(0) | probably_damaging(0.992) | TCGA-AN-A0XO-01 | Breast | breast invasive carcinoma | Female | <65 | III/IV | Unknown | Unknown | SD | |
| PBXIP1 | SNV | Missense_Mutation | novel | c.1766N>T | p.Ser589Leu | p.S589L | Q96AQ6 | protein_coding | deleterious(0) | probably_damaging(0.998) | TCGA-C8-A8HQ-01 | Breast | breast invasive carcinoma | Female | <65 | I/II | Unknown | Unknown | SD |
| PBXIP1 | SNV | Missense_Mutation | novel | c.1112N>A | p.Pro371His | p.P371H | Q96AQ6 | protein_coding | tolerated(0.3) | benign(0) | TCGA-D8-A1XK-01 | Breast | breast invasive carcinoma | Female | <65 | I/II | Chemotherapy | doxorubicine+cyclophosphamide | SD |
| PBXIP1 | SNV | Missense_Mutation | c.101N>G | p.Ser34Cys | p.S34C | Q96AQ6 | protein_coding | deleterious(0.02) | possibly_damaging(0.694) | TCGA-E2-A10A-01 | Breast | breast invasive carcinoma | Female | <65 | I/II | Hormone Therapy | zoladex | SD | |
| PBXIP1 | insertion | Nonsense_Mutation | novel | c.126_127insTGTAATTAAGGTACTCCCAAAGGAAGGAG | p.Ser43CysfsTer3 | p.S43Cfs*3 | Q96AQ6 | protein_coding | TCGA-A7-A0CJ-01 | Breast | breast invasive carcinoma | Female | <65 | I/II | Chemotherapy | cytoxan | SD | ||
| PBXIP1 | SNV | Missense_Mutation | novel | c.335N>T | p.Thr112Ile | p.T112I | Q96AQ6 | protein_coding | tolerated(0.22) | benign(0.075) | TCGA-VS-A8QC-01 | Cervix | cervical & endocervical cancer | Female | <65 | I/II | Chemotherapy | paclitaxel | PD |
| PBXIP1 | SNV | Missense_Mutation | novel | c.497A>G | p.Glu166Gly | p.E166G | Q96AQ6 | protein_coding | tolerated(0.23) | benign(0.006) | TCGA-A6-5665-01 | Colorectum | colon adenocarcinoma | Female | >=65 | I/II | Unknown | Unknown | PD |
| PBXIP1 | SNV | Missense_Mutation | rs200704535 | c.1969C>T | p.Arg657Trp | p.R657W | Q96AQ6 | protein_coding | deleterious(0) | possibly_damaging(0.588) | TCGA-AA-3710-01 | Colorectum | colon adenocarcinoma | Female | >=65 | I/II | Unknown | Unknown | SD |
| Page: 1 2 3 4 5 6 7 8 |
Top |
Related drugs of malignant transformation related genes |
| Identification of chemicals and drugs interact with genes involved in malignant transfromation |
| (DGIdb 4.0) |
| Entrez ID | Symbol | Category | Interaction Types | Drug Claim Name | Drug Name | PMIDs |
| Page: 1 |

Copyright 2023-Present -The University of Texas Health Science Center at Houston |