
|
|||||
|
 | |
| |
| |
| |
| |
| |
|
Gene: PBX4 |
Gene summary for PBX4 |
| Gene information | Species | Human | Gene symbol | PBX4 | Gene ID | 80714 |
| Gene name | PBX homeobox 4 | |
| Gene Alias | PBX4 | |
| Cytomap | 19p13.11 | |
| Gene Type | protein-coding | GO ID | GO:0001654 | UniProtAcc | Q9BYU1 |
Top |
Malignant transformation analysis |
| Identification of the aberrant gene expression in precancerous and cancerous lesions by comparing the gene expression of stem-like cells in diseased tissues with normal stem cells |
| Entrez ID | Symbol | Replicates | Species | Organ | Tissue | Adj P-value | Log2FC | Malignancy |
| 80714 | PBX4 | AEH-subject4 | Human | Endometrium | AEH | 1.32e-04 | 1.70e-01 | -0.2657 |
| 80714 | PBX4 | PTC04 | Human | Thyroid | PTC | 2.53e-06 | 5.21e-02 | 0.1927 |
| 80714 | PBX4 | PTC07 | Human | Thyroid | PTC | 4.49e-05 | 2.20e-02 | 0.2044 |
| 80714 | PBX4 | ATC13 | Human | Thyroid | ATC | 3.60e-12 | 6.05e-02 | 0.34 |
| 80714 | PBX4 | ATC5 | Human | Thyroid | ATC | 1.83e-04 | 7.17e-02 | 0.34 |
| Page: 1 |
| Tissue | Expression Dynamics | Abbreviation |
| Endometrium |  | AEH: Atypical endometrial hyperplasia |
| EEC: Endometrioid Cancer | ||
| Thyroid | 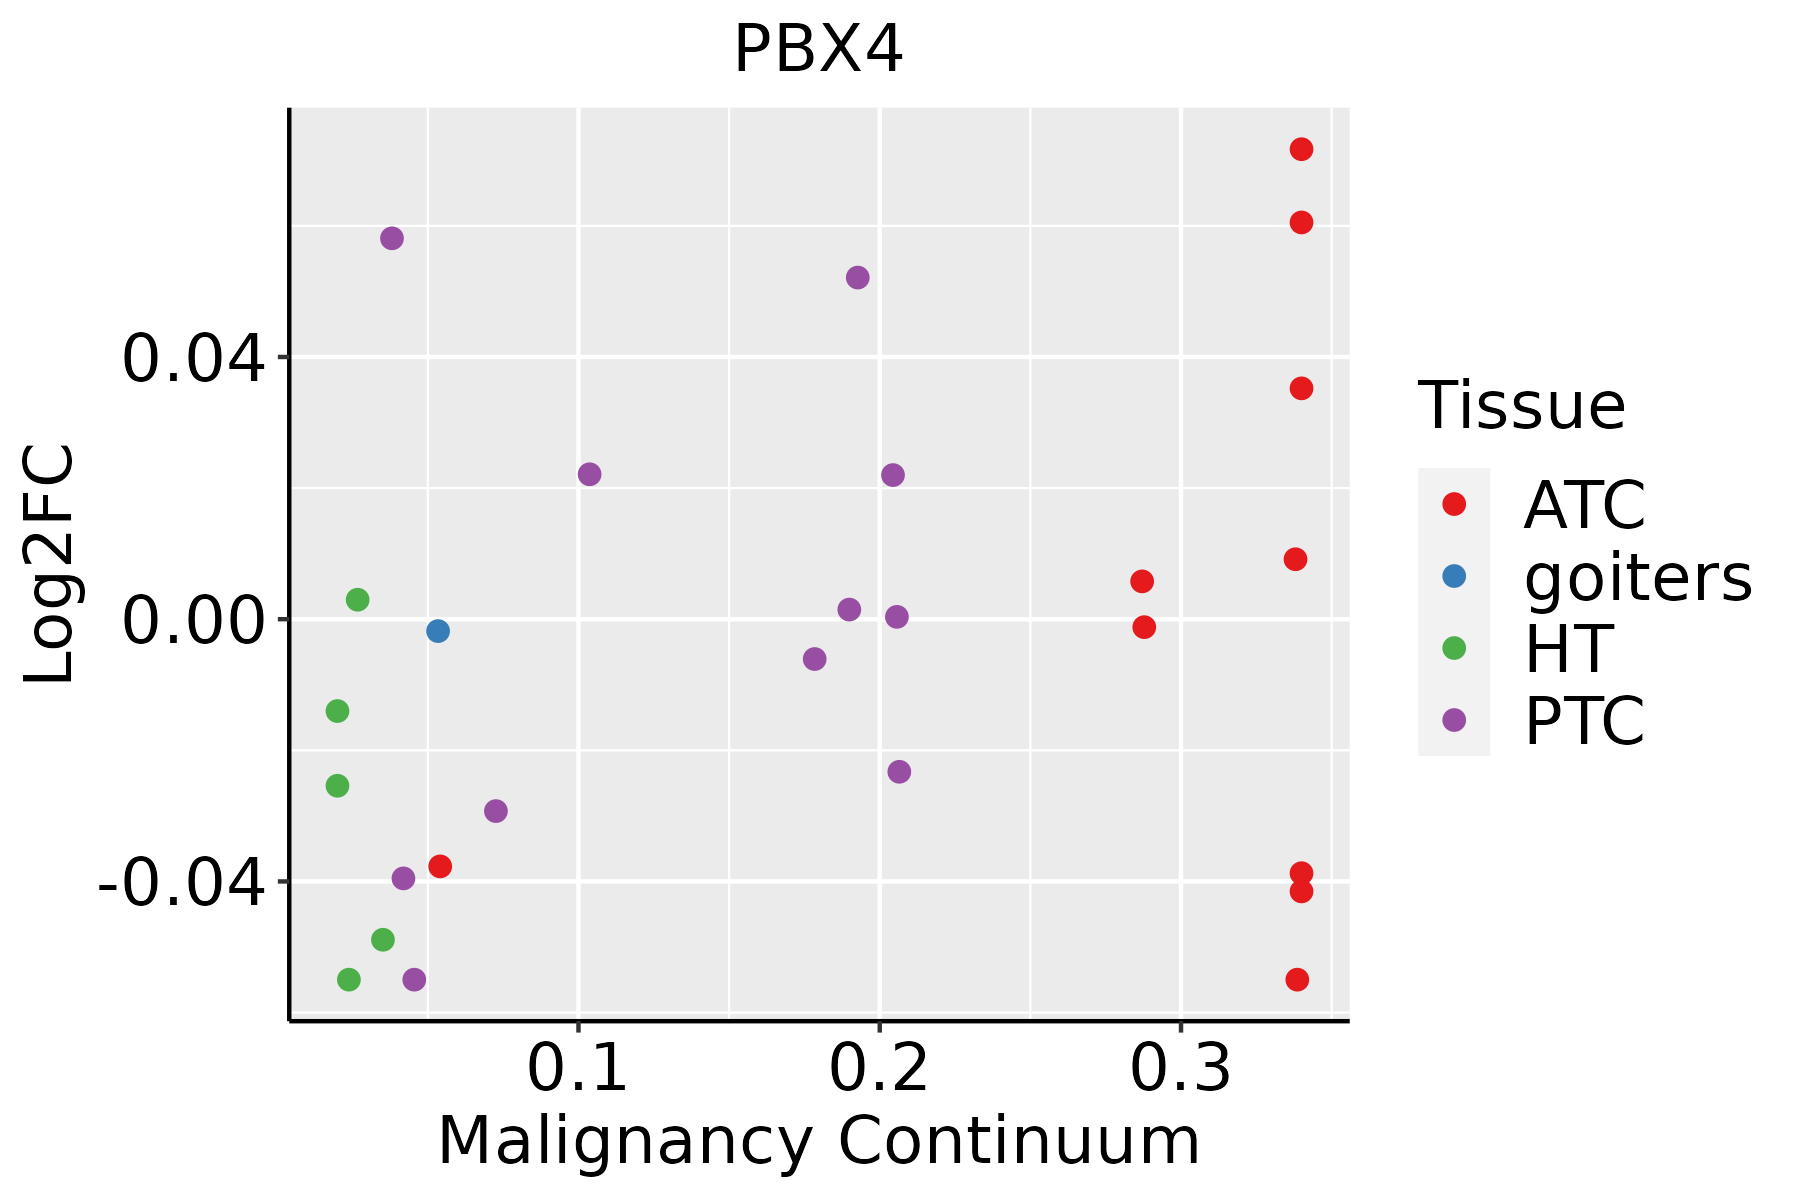 | ATC: Anaplastic thyroid cancer |
| HT: Hashimoto's thyroiditis | ||
| PTC: Papillary thyroid cancer |
| ∗log2FC in expression of this searched gene in stem-like cells from each diseased tissue sample relative to stem-like cells in normal samples in each tissue plotted against the malignancy continuum. Samples are colored based on if they are from different disease stage. |
Top |
Malignant transformation related pathway analysis |
| Find out the enriched GO biological processes and KEGG pathways involved in transition from healthy to precancer to cancer |
| Tissue | Disease Stage | Enriched GO biological Processes |
| Colorectum | AD |  |
| Colorectum | SER |  |
| Colorectum | MSS |  |
| Colorectum | MSI-H |  |
| Colorectum | FAP |  |
| ∗Top 15 enriched GO BP terms are showed in the bar plot of each disease state in each tissue. Each row represents a significant GO biological process which is colored according to the -log10(p.adjust). |
| Page: 1 2 3 4 5 6 7 8 9 |
| GO ID | Tissue | Disease Stage | Description | Gene Ratio | Bg Ratio | pvalue | p.adjust | Count |
| GO:00485688 | Thyroid | ATC | embryonic organ development | 172/6293 | 427/18723 | 2.08e-03 | 9.84e-03 | 172 |
| Page: 1 |
| Pathway ID | Tissue | Disease Stage | Description | Gene Ratio | Bg Ratio | pvalue | p.adjust | qvalue | Count |
| Page: 1 |
Top |
Cell-cell communication analysis |
| Identification of potential cell-cell interactions between two cell types and their ligand-receptor pairs for different disease states |
| Ligand | Receptor | LRpair | Pathway | Tissue | Disease Stage |
| Page: 1 |
Top |
Single-cell gene regulatory network inference analysis |
| Find out the significant the regulons (TFs) and the target genes of each regulon across cell types for different disease states |
| TF | Cell Type | Tissue | Disease Stage | Target Gene | RSS | Regulon Activity |
| PBX4 | LYMEND | Colorectum | Healthy | FYB1,ABCC3,CDH1, etc. | 6.93e-02 |  |
| PBX4 | QUIE | Esophagus | ADJ | PLA2G16,LDLRAD4,LTB, etc. | 1.26e-01 |  |
| PBX4 | PRO | Esophagus | ADJ | PLA2G16,LDLRAD4,LTB, etc. | 7.29e-02 | |
| PBX4 | QUIE | Esophagus | HGIN | PLA2G16,LDLRAD4,LTB, etc. | 8.69e-02 |  |
| PBX4 | MYOFIB | Esophagus | ADJ | PPFIBP2,TNFRSF18,CDS1, etc. | 0.00e+00 | |
| PBX4 | INCAF | Esophagus | ADJ | PPFIBP2,TNFRSF18,CDS1, etc. | 0.00e+00 | |
| PBX4 | FIB | Esophagus | ESCC | PPFIBP2,TNFRSF18,CDS1, etc. | 0.00e+00 |  |
| PBX4 | MYOFIB | Esophagus | Healthy | PPFIBP2,TNFRSF18,CDS1, etc. | 0.00e+00 |  |
| PBX4 | BAS | Lung | AAH | IL7R,CD6,SYTL3, etc. | 9.56e-02 |  |
| PBX4 | BAS | Lung | AIS | IL7R,CD6,SYTL3, etc. | 0.00e+00 |  |
| ∗The dot plots of a searched regulon are shown for all cell subpopulations in each disease state of each tissue based on the regulon specific score inferred using pySCENIC and by calculating the average expression. |
| Page: 1 2 |
Top |
Somatic mutation of malignant transformation related genes |
| Annotation of somatic variants for genes involved in malignant transformation |
| Hugo Symbol | Variant Class | Variant Classification | dbSNP RS | HGVSc | HGVSp | HGVSp Short | SWISSPROT | BIOTYPE | SIFT | PolyPhen | Tumor Sample Barcode | Tissue | Histology | Sex | Age | Stage | Therapy Types | Drugs | Outcome |
| PBX4 | SNV | Missense_Mutation | novel | c.503C>A | p.Pro168His | p.P168H | Q9BYU1 | protein_coding | deleterious(0) | probably_damaging(0.999) | TCGA-A2-A25A-01 | Breast | breast invasive carcinoma | Female | <65 | I/II | Unspecific | Cytoxan | SD |
| PBX4 | SNV | Missense_Mutation | rs762057005 | c.614N>T | p.Ser205Leu | p.S205L | Q9BYU1 | protein_coding | deleterious(0) | benign(0.015) | TCGA-AN-A046-01 | Breast | breast invasive carcinoma | Female | >=65 | I/II | Unknown | Unknown | SD |
| PBX4 | SNV | Missense_Mutation | rs139542458 | c.872C>T | p.Thr291Met | p.T291M | Q9BYU1 | protein_coding | deleterious(0.04) | possibly_damaging(0.761) | TCGA-AN-A0FJ-01 | Breast | breast invasive carcinoma | Female | <65 | III/IV | Unknown | Unknown | SD |
| PBX4 | SNV | Missense_Mutation | rs199673541 | c.662N>T | p.Ala221Val | p.A221V | Q9BYU1 | protein_coding | deleterious(0.01) | probably_damaging(0.998) | TCGA-2W-A8YY-01 | Cervix | cervical & endocervical cancer | Female | <65 | I/II | Chemotherapy | cisplatin | CR |
| PBX4 | SNV | Missense_Mutation | c.706N>A | p.Pro236Thr | p.P236T | Q9BYU1 | protein_coding | deleterious(0.02) | probably_damaging(0.924) | TCGA-VS-A9UH-01 | Cervix | cervical & endocervical cancer | Female | <65 | I/II | Chemotherapy | cisplatin | CR | |
| PBX4 | SNV | Missense_Mutation | rs550438529 | c.287N>T | p.Pro96Leu | p.P96L | Q9BYU1 | protein_coding | deleterious(0.01) | probably_damaging(0.999) | TCGA-AD-A5EK-01 | Colorectum | colon adenocarcinoma | Male | <65 | I/II | Unknown | Unknown | SD |
| PBX4 | SNV | Missense_Mutation | rs766502529 | c.610N>T | p.Arg204Cys | p.R204C | Q9BYU1 | protein_coding | deleterious(0.01) | benign(0.067) | TCGA-A5-A0GP-01 | Endometrium | uterine corpus endometrioid carcinoma | Female | <65 | I/II | Unknown | Unknown | SD |
| PBX4 | SNV | Missense_Mutation | rs762057005 | c.614C>T | p.Ser205Leu | p.S205L | Q9BYU1 | protein_coding | deleterious(0) | benign(0.015) | TCGA-AJ-A3EL-01 | Endometrium | uterine corpus endometrioid carcinoma | Female | <65 | I/II | Unknown | Unknown | SD |
| PBX4 | SNV | Missense_Mutation | novel | c.166G>A | p.Val56Met | p.V56M | Q9BYU1 | protein_coding | deleterious(0) | possibly_damaging(0.688) | TCGA-AJ-A8CT-01 | Endometrium | uterine corpus endometrioid carcinoma | Female | <65 | I/II | Unknown | Unknown | SD |
| PBX4 | SNV | Missense_Mutation | rs757291376 | c.640N>T | p.Arg214Trp | p.R214W | Q9BYU1 | protein_coding | deleterious(0.03) | benign(0.067) | TCGA-AP-A1DV-01 | Endometrium | uterine corpus endometrioid carcinoma | Female | <65 | I/II | Unknown | Unknown | SD |
| Page: 1 2 3 |
Top |
Related drugs of malignant transformation related genes |
| Identification of chemicals and drugs interact with genes involved in malignant transfromation |
| (DGIdb 4.0) |
| Entrez ID | Symbol | Category | Interaction Types | Drug Claim Name | Drug Name | PMIDs |
| Page: 1 |

Copyright 2023-Present -The University of Texas Health Science Center at Houston |