
|
|||||
|
 | |
| |
| |
| |
| |
| |
|
Gene: PBX2 |
Gene summary for PBX2 |
| Gene information | Species | Human | Gene symbol | PBX2 | Gene ID | 5089 |
| Gene name | PBX homeobox 2 | |
| Gene Alias | G17 | |
| Cytomap | 6p21.32 | |
| Gene Type | protein-coding | GO ID | GO:0001654 | UniProtAcc | A0A024RCR3 |
Top |
Malignant transformation analysis |
| Identification of the aberrant gene expression in precancerous and cancerous lesions by comparing the gene expression of stem-like cells in diseased tissues with normal stem cells |
| Entrez ID | Symbol | Replicates | Species | Organ | Tissue | Adj P-value | Log2FC | Malignancy |
| 5089 | PBX2 | LZE4T | Human | Esophagus | ESCC | 2.92e-04 | 1.11e-01 | 0.0811 |
| 5089 | PBX2 | LZE7T | Human | Esophagus | ESCC | 1.23e-03 | 1.54e-01 | 0.0667 |
| 5089 | PBX2 | LZE24T | Human | Esophagus | ESCC | 2.33e-17 | 3.38e-01 | 0.0596 |
| 5089 | PBX2 | LZE6T | Human | Esophagus | ESCC | 1.13e-02 | 1.47e-01 | 0.0845 |
| 5089 | PBX2 | P1T-E | Human | Esophagus | ESCC | 2.07e-09 | 3.90e-01 | 0.0875 |
| 5089 | PBX2 | P2T-E | Human | Esophagus | ESCC | 6.62e-13 | 3.04e-01 | 0.1177 |
| 5089 | PBX2 | P4T-E | Human | Esophagus | ESCC | 3.62e-06 | 1.81e-01 | 0.1323 |
| 5089 | PBX2 | P5T-E | Human | Esophagus | ESCC | 1.18e-07 | 1.08e-01 | 0.1327 |
| 5089 | PBX2 | P8T-E | Human | Esophagus | ESCC | 1.82e-17 | 2.64e-01 | 0.0889 |
| 5089 | PBX2 | P9T-E | Human | Esophagus | ESCC | 1.79e-04 | 1.34e-01 | 0.1131 |
| 5089 | PBX2 | P10T-E | Human | Esophagus | ESCC | 3.41e-12 | 1.46e-01 | 0.116 |
| 5089 | PBX2 | P12T-E | Human | Esophagus | ESCC | 2.80e-11 | 2.02e-01 | 0.1122 |
| 5089 | PBX2 | P15T-E | Human | Esophagus | ESCC | 1.55e-06 | 1.28e-01 | 0.1149 |
| 5089 | PBX2 | P16T-E | Human | Esophagus | ESCC | 6.52e-12 | 1.18e-01 | 0.1153 |
| 5089 | PBX2 | P17T-E | Human | Esophagus | ESCC | 7.38e-05 | 2.12e-01 | 0.1278 |
| 5089 | PBX2 | P19T-E | Human | Esophagus | ESCC | 2.31e-02 | 2.73e-01 | 0.1662 |
| 5089 | PBX2 | P20T-E | Human | Esophagus | ESCC | 3.94e-02 | 4.03e-02 | 0.1124 |
| 5089 | PBX2 | P21T-E | Human | Esophagus | ESCC | 7.54e-13 | 1.56e-01 | 0.1617 |
| 5089 | PBX2 | P22T-E | Human | Esophagus | ESCC | 8.78e-15 | 1.84e-01 | 0.1236 |
| 5089 | PBX2 | P23T-E | Human | Esophagus | ESCC | 8.73e-06 | 1.66e-01 | 0.108 |
| Page: 1 2 3 4 5 |
| Tissue | Expression Dynamics | Abbreviation |
| Esophagus | 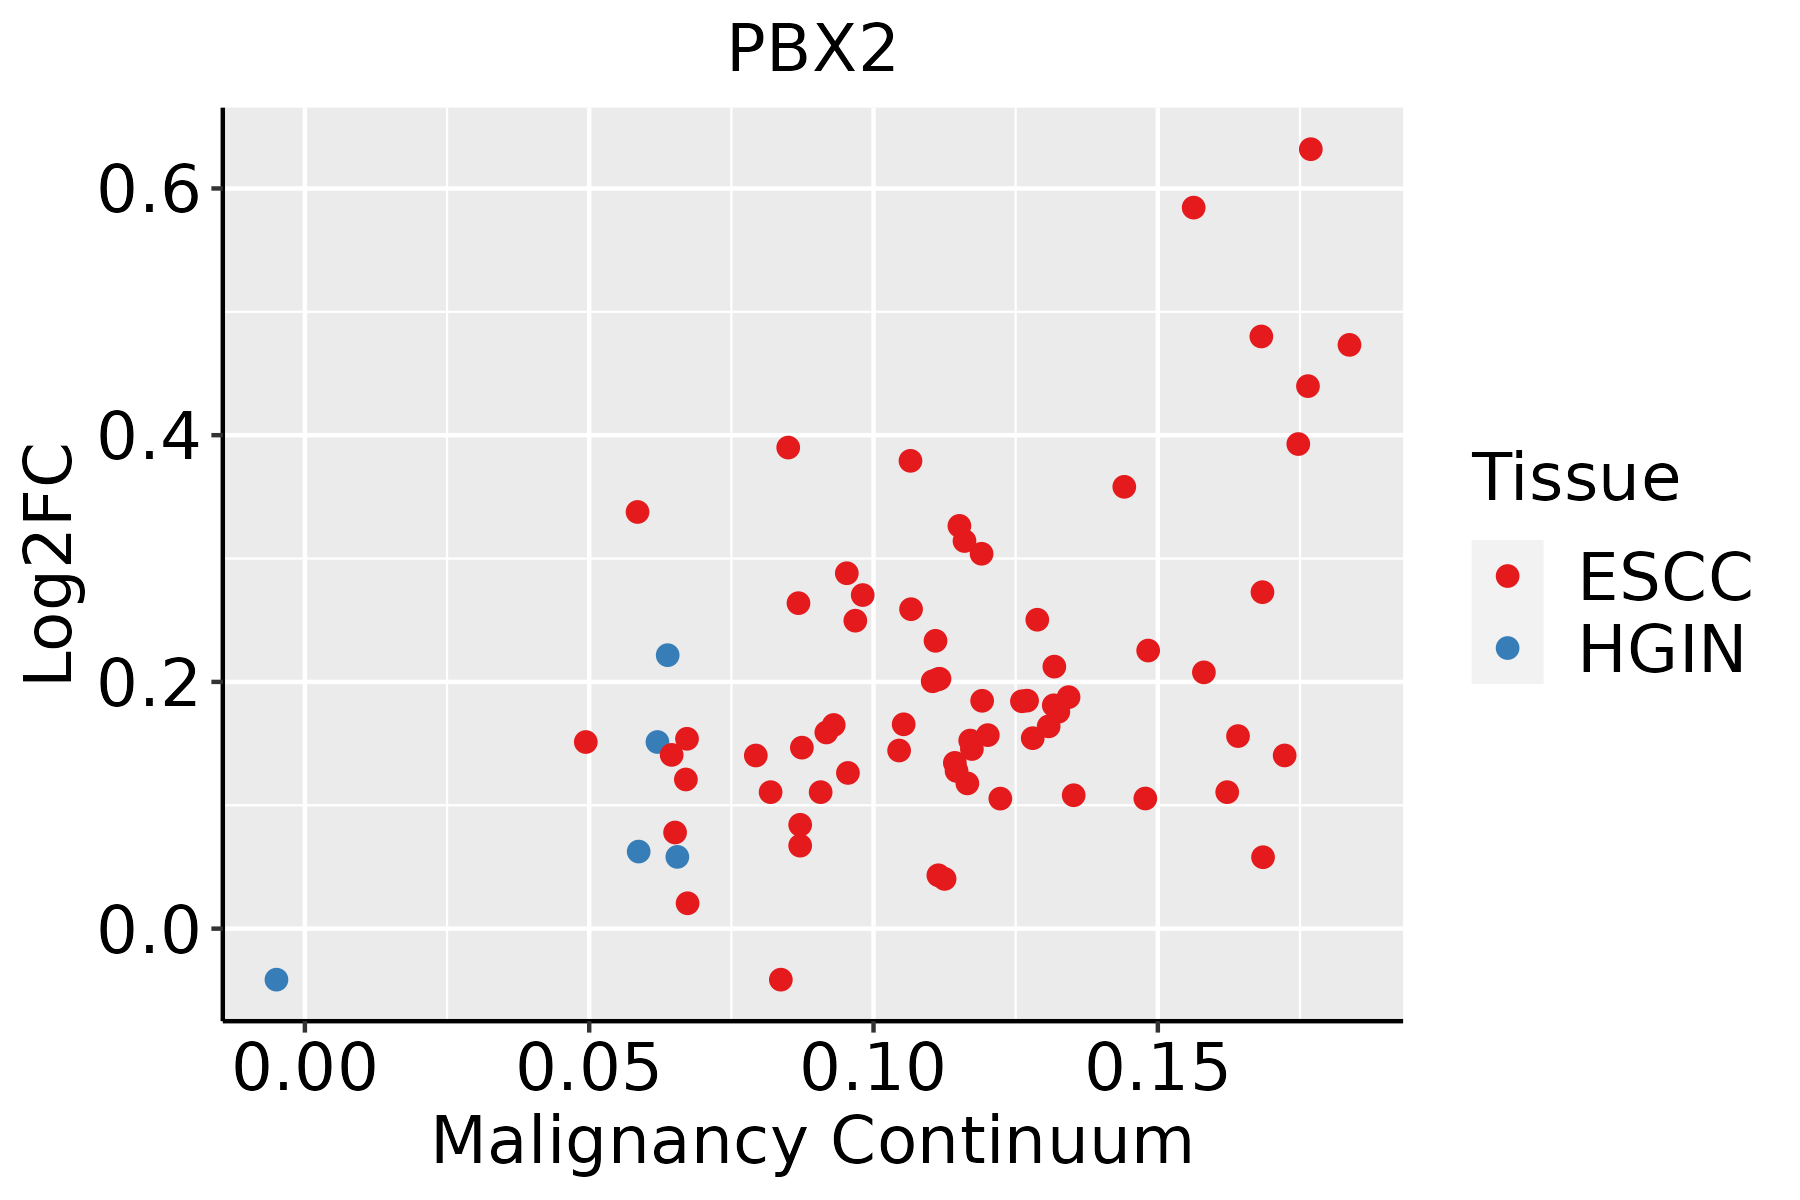 | ESCC: Esophageal squamous cell carcinoma |
| HGIN: High-grade intraepithelial neoplasias | ||
| LGIN: Low-grade intraepithelial neoplasias | ||
| Liver |  | HCC: Hepatocellular carcinoma |
| NAFLD: Non-alcoholic fatty liver disease | ||
| Oral Cavity | 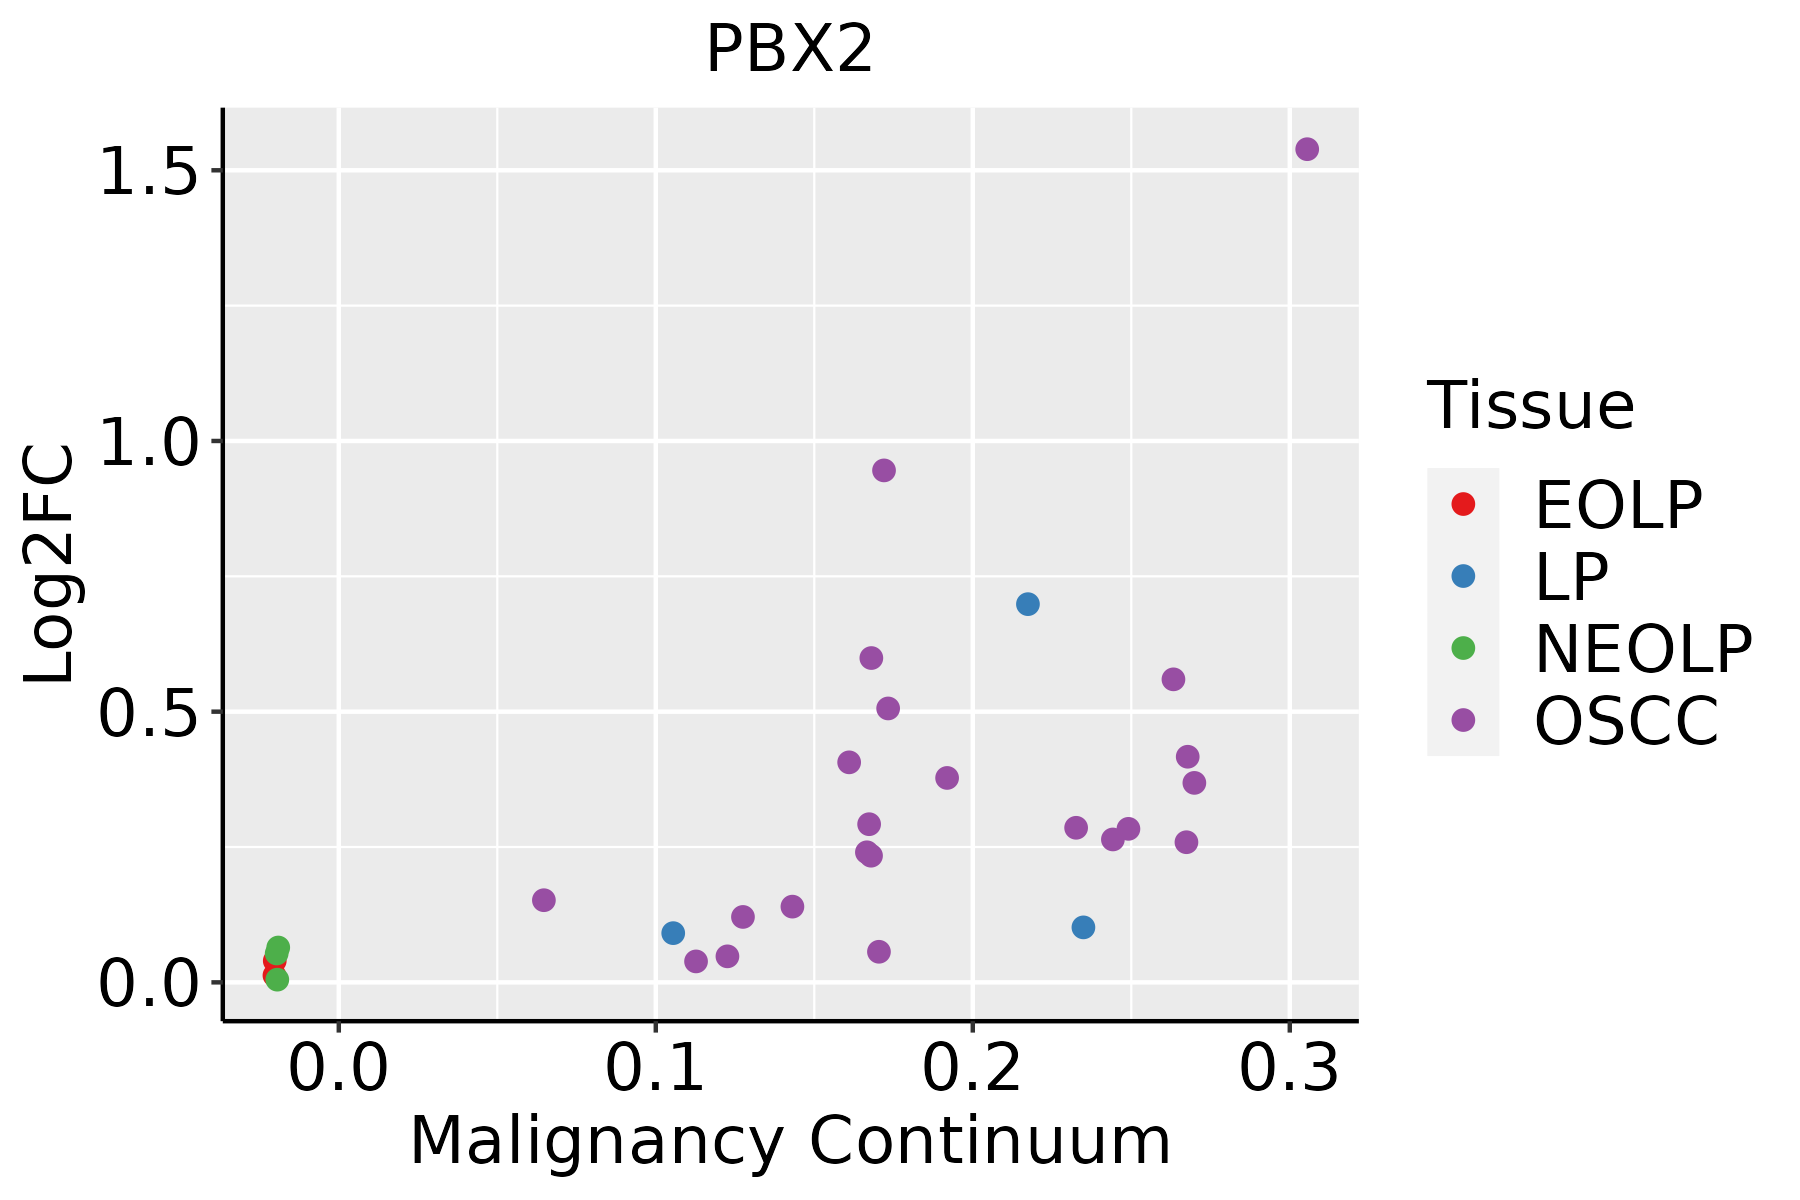 | EOLP: Erosive Oral lichen planus |
| LP: leukoplakia | ||
| NEOLP: Non-erosive oral lichen planus | ||
| OSCC: Oral squamous cell carcinoma | ||
| Thyroid |  | ATC: Anaplastic thyroid cancer |
| HT: Hashimoto's thyroiditis | ||
| PTC: Papillary thyroid cancer |
| ∗log2FC in expression of this searched gene in stem-like cells from each diseased tissue sample relative to stem-like cells in normal samples in each tissue plotted against the malignancy continuum. Samples are colored based on if they are from different disease stage. |
Top |
Malignant transformation related pathway analysis |
| Find out the enriched GO biological processes and KEGG pathways involved in transition from healthy to precancer to cancer |
| Tissue | Disease Stage | Enriched GO biological Processes |
| Colorectum | AD |  |
| Colorectum | SER |  |
| Colorectum | MSS |  |
| Colorectum | MSI-H |  |
| Colorectum | FAP |  |
| ∗Top 15 enriched GO BP terms are showed in the bar plot of each disease state in each tissue. Each row represents a significant GO biological process which is colored according to the -log10(p.adjust). |
| Page: 1 2 3 4 5 6 7 8 9 |
| GO ID | Tissue | Disease Stage | Description | Gene Ratio | Bg Ratio | pvalue | p.adjust | Count |
| GO:00485687 | Esophagus | ESCC | embryonic organ development | 228/8552 | 427/18723 | 7.28e-04 | 3.79e-03 | 228 |
| GO:00487367 | Esophagus | ESCC | appendage development | 98/8552 | 172/18723 | 1.83e-03 | 8.37e-03 | 98 |
| GO:00601737 | Esophagus | ESCC | limb development | 98/8552 | 172/18723 | 1.83e-03 | 8.37e-03 | 98 |
| GO:00485688 | Thyroid | ATC | embryonic organ development | 172/6293 | 427/18723 | 2.08e-03 | 9.84e-03 | 172 |
| GO:00351074 | Thyroid | ATC | appendage morphogenesis | 63/6293 | 138/18723 | 2.13e-03 | 1.00e-02 | 63 |
| GO:00351084 | Thyroid | ATC | limb morphogenesis | 63/6293 | 138/18723 | 2.13e-03 | 1.00e-02 | 63 |
| GO:00487368 | Thyroid | ATC | appendage development | 76/6293 | 172/18723 | 2.41e-03 | 1.12e-02 | 76 |
| GO:00601738 | Thyroid | ATC | limb development | 76/6293 | 172/18723 | 2.41e-03 | 1.12e-02 | 76 |
| GO:00303262 | Thyroid | ATC | embryonic limb morphogenesis | 52/6293 | 116/18723 | 7.67e-03 | 3.00e-02 | 52 |
| GO:00351132 | Thyroid | ATC | embryonic appendage morphogenesis | 52/6293 | 116/18723 | 7.67e-03 | 3.00e-02 | 52 |
| Page: 1 |
| Pathway ID | Tissue | Disease Stage | Description | Gene Ratio | Bg Ratio | pvalue | p.adjust | qvalue | Count |
| Page: 1 |
Top |
Cell-cell communication analysis |
| Identification of potential cell-cell interactions between two cell types and their ligand-receptor pairs for different disease states |
| Ligand | Receptor | LRpair | Pathway | Tissue | Disease Stage |
| Page: 1 |
Top |
Single-cell gene regulatory network inference analysis |
| Find out the significant the regulons (TFs) and the target genes of each regulon across cell types for different disease states |
| TF | Cell Type | Tissue | Disease Stage | Target Gene | RSS | Regulon Activity |
| PBX2 | MAIT | Liver | Healthy | HACD1,PABPN1,EIF2AK3, etc. | 1.01e-02 |  |
| PBX2 | MON | Liver | Healthy | HACD1,PABPN1,EIF2AK3, etc. | 1.39e-02 | |
| PBX2 | BN | Liver | NAFLD | HACD1,PABPN1,EIF2AK3, etc. | 1.75e-01 |  |
| PBX2 | M1MAC | Oral cavity | ADJ | ASS1,TPD52L1,ASNS, etc. | 2.80e-01 |  |
| PBX2 | CD8TEXINT | Oral cavity | ADJ | ASS1,TPD52L1,ASNS, etc. | 3.84e-03 | |
| PBX2 | M1MAC | Oral cavity | Healthy | ASS1,TPD52L1,ASNS, etc. | 3.14e-01 |  |
| PBX2 | M1MAC | Oral cavity | LP | ASS1,TPD52L1,ASNS, etc. | 2.61e-01 |  |
| PBX2 | MAST | Oral cavity | LP | ASS1,TPD52L1,ASNS, etc. | 1.16e-01 | |
| PBX2 | M1MAC | Oral cavity | OSCC | ASS1,TPD52L1,ASNS, etc. | 1.29e-01 |  |
| PBX2 | NEUT | Pancreas | ADJ | ALAS1,CSF3R,SAP25, etc. | 4.01e-01 |  |
| ∗The dot plots of a searched regulon are shown for all cell subpopulations in each disease state of each tissue based on the regulon specific score inferred using pySCENIC and by calculating the average expression. |
| Page: 1 2 |
Top |
Somatic mutation of malignant transformation related genes |
| Annotation of somatic variants for genes involved in malignant transformation |
| Hugo Symbol | Variant Class | Variant Classification | dbSNP RS | HGVSc | HGVSp | HGVSp Short | SWISSPROT | BIOTYPE | SIFT | PolyPhen | Tumor Sample Barcode | Tissue | Histology | Sex | Age | Stage | Therapy Types | Drugs | Outcome |
| PBX2 | SNV | Missense_Mutation | c.705G>A | p.Met235Ile | p.M235I | P40425 | protein_coding | tolerated(0.09) | possibly_damaging(0.759) | TCGA-A8-A09N-01 | Breast | breast invasive carcinoma | Female | <65 | III/IV | Unknown | Unknown | SD | |
| PBX2 | SNV | Missense_Mutation | c.1215N>C | p.Trp405Cys | p.W405C | P40425 | protein_coding | deleterious(0) | benign(0.111) | TCGA-E2-A1LS-01 | Breast | breast invasive carcinoma | Female | <65 | I/II | Unspecific | Cyclophosphamide | SD | |
| PBX2 | SNV | Missense_Mutation | novel | c.1037C>G | p.Ser346Cys | p.S346C | P40425 | protein_coding | deleterious(0.03) | probably_damaging(0.971) | TCGA-C5-A2LZ-01 | Cervix | cervical & endocervical cancer | Female | >=65 | III/IV | Unknown | Unknown | PD |
| PBX2 | SNV | Missense_Mutation | rs774240386 | c.49N>A | p.Gly17Ser | p.G17S | P40425 | protein_coding | tolerated_low_confidence(0.17) | benign(0.003) | TCGA-A6-6650-01 | Colorectum | colon adenocarcinoma | Female | >=65 | I/II | Unknown | Unknown | SD |
| PBX2 | SNV | Missense_Mutation | c.1253N>T | p.Thr418Met | p.T418M | P40425 | protein_coding | deleterious_low_confidence(0.01) | possibly_damaging(0.551) | TCGA-A6-6781-01 | Colorectum | colon adenocarcinoma | Male | <65 | III/IV | Chemotherapy | oxaliplatin | SD | |
| PBX2 | SNV | Missense_Mutation | rs763303454 | c.1114N>A | p.Val372Met | p.V372M | P40425 | protein_coding | tolerated_low_confidence(0.07) | benign(0.058) | TCGA-AA-3867-01 | Colorectum | colon adenocarcinoma | Male | >=65 | III/IV | Unknown | Unknown | PD |
| PBX2 | SNV | Missense_Mutation | novel | c.1054N>G | p.Ser352Ala | p.S352A | P40425 | protein_coding | tolerated(0.25) | benign(0.013) | TCGA-AA-3984-01 | Colorectum | colon adenocarcinoma | Female | <65 | I/II | Unknown | Unknown | SD |
| PBX2 | SNV | Missense_Mutation | novel | c.278N>G | p.Glu93Gly | p.E93G | P40425 | protein_coding | deleterious(0) | possibly_damaging(0.756) | TCGA-AA-A010-01 | Colorectum | colon adenocarcinoma | Female | <65 | I/II | Chemotherapy | folinic | CR |
| PBX2 | SNV | Missense_Mutation | c.1013N>G | p.Pro338Arg | p.P338R | P40425 | protein_coding | deleterious(0) | possibly_damaging(0.862) | TCGA-NH-A6GC-01 | Colorectum | colon adenocarcinoma | Female | >=65 | I/II | Chemotherapy | fluorouracil | SD | |
| PBX2 | SNV | Missense_Mutation | novel | c.531G>T | p.Glu177Asp | p.E177D | P40425 | protein_coding | deleterious(0.03) | possibly_damaging(0.836) | TCGA-F5-6814-01 | Colorectum | rectum adenocarcinoma | Male | <65 | I/II | Unknown | Unknown | SD |
| Page: 1 2 3 4 5 |
Top |
Related drugs of malignant transformation related genes |
| Identification of chemicals and drugs interact with genes involved in malignant transfromation |
| (DGIdb 4.0) |
| Entrez ID | Symbol | Category | Interaction Types | Drug Claim Name | Drug Name | PMIDs |
| Page: 1 |

Copyright 2023-Present -The University of Texas Health Science Center at Houston |