
|
|||||
|
 | |
| |
| |
| |
| |
| |
|
Gene: PBX1 |
Gene summary for PBX1 |
| Gene information | Species | Human | Gene symbol | PBX1 | Gene ID | 5087 |
| Gene name | PBX homeobox 1 | |
| Gene Alias | CAKUHED | |
| Cytomap | 1q23.3 | |
| Gene Type | protein-coding | GO ID | GO:0000003 | UniProtAcc | A8K5V0 |
Top |
Malignant transformation analysis |
| Identification of the aberrant gene expression in precancerous and cancerous lesions by comparing the gene expression of stem-like cells in diseased tissues with normal stem cells |
| Entrez ID | Symbol | Replicates | Species | Organ | Tissue | Adj P-value | Log2FC | Malignancy |
| 5087 | PBX1 | GSM4909281 | Human | Breast | IDC | 2.40e-04 | 2.61e-01 | 0.21 |
| 5087 | PBX1 | GSM4909285 | Human | Breast | IDC | 1.64e-04 | 1.89e-01 | 0.21 |
| 5087 | PBX1 | GSM4909286 | Human | Breast | IDC | 3.80e-05 | 2.45e-01 | 0.1081 |
| 5087 | PBX1 | GSM4909290 | Human | Breast | IDC | 2.00e-06 | 3.54e-01 | 0.2096 |
| 5087 | PBX1 | GSM4909291 | Human | Breast | IDC | 7.85e-27 | 7.88e-01 | 0.1753 |
| 5087 | PBX1 | GSM4909293 | Human | Breast | IDC | 1.41e-63 | 1.01e+00 | 0.1581 |
| 5087 | PBX1 | GSM4909297 | Human | Breast | IDC | 3.19e-10 | 3.07e-01 | 0.1517 |
| 5087 | PBX1 | GSM4909298 | Human | Breast | IDC | 1.15e-60 | 9.19e-01 | 0.1551 |
| 5087 | PBX1 | GSM4909301 | Human | Breast | IDC | 4.04e-17 | 5.74e-01 | 0.1577 |
| 5087 | PBX1 | GSM4909302 | Human | Breast | IDC | 1.81e-04 | 3.03e-01 | 0.1545 |
| 5087 | PBX1 | GSM4909303 | Human | Breast | IDC | 1.81e-03 | 4.42e-01 | 0.0438 |
| 5087 | PBX1 | GSM4909305 | Human | Breast | IDC | 1.32e-02 | 2.47e-01 | 0.0436 |
| 5087 | PBX1 | GSM4909306 | Human | Breast | IDC | 2.26e-16 | 5.99e-01 | 0.1564 |
| 5087 | PBX1 | GSM4909307 | Human | Breast | IDC | 1.76e-38 | 8.53e-01 | 0.1569 |
| 5087 | PBX1 | GSM4909308 | Human | Breast | IDC | 2.34e-63 | 9.63e-01 | 0.158 |
| 5087 | PBX1 | GSM4909309 | Human | Breast | IDC | 3.60e-06 | 3.63e-01 | 0.0483 |
| 5087 | PBX1 | GSM4909311 | Human | Breast | IDC | 7.25e-14 | 3.06e-02 | 0.1534 |
| 5087 | PBX1 | GSM4909312 | Human | Breast | IDC | 8.46e-43 | 8.14e-01 | 0.1552 |
| 5087 | PBX1 | GSM4909313 | Human | Breast | IDC | 1.84e-19 | 6.51e-01 | 0.0391 |
| 5087 | PBX1 | GSM4909317 | Human | Breast | IDC | 2.09e-45 | 9.58e-01 | 0.1355 |
| Page: 1 2 3 4 5 6 7 8 9 10 11 |
| Tissue | Expression Dynamics | Abbreviation |
| Breast | 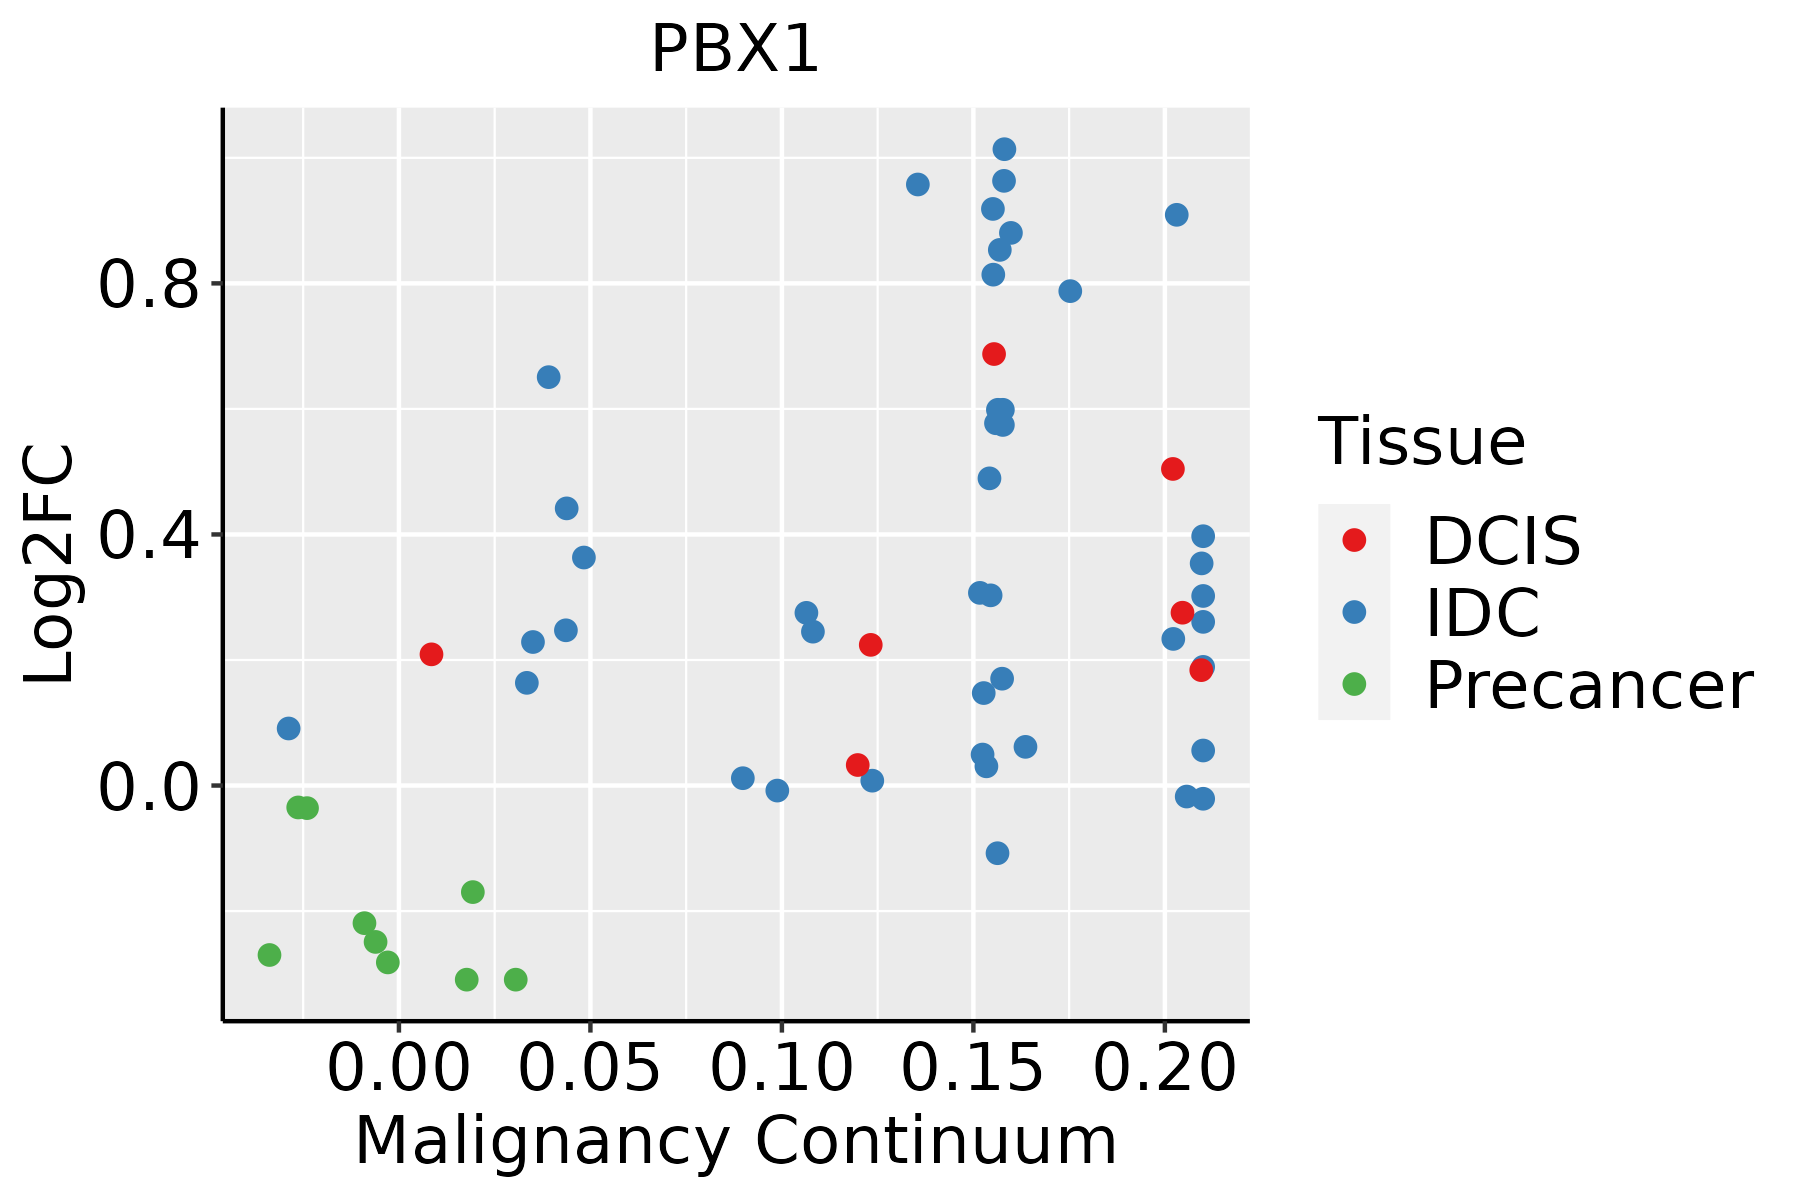 | IDC: Invasive ductal carcinoma |
| DCIS: Ductal carcinoma in situ | ||
| Precancer(BRCA1-mut): Precancerous lesion from BRCA1 mutation carriers | ||
| Cervix |  | CC: Cervix cancer |
| HSIL_HPV: HPV-infected high-grade squamous intraepithelial lesions | ||
| N_HPV: HPV-infected normal cervix | ||
| Colorectum (GSE201348) |  | FAP: Familial adenomatous polyposis |
| CRC: Colorectal cancer | ||
| Colorectum (HTA11) |  | AD: Adenomas |
| SER: Sessile serrated lesions | ||
| MSI-H: Microsatellite-high colorectal cancer | ||
| MSS: Microsatellite stable colorectal cancer | ||
| Endometrium | 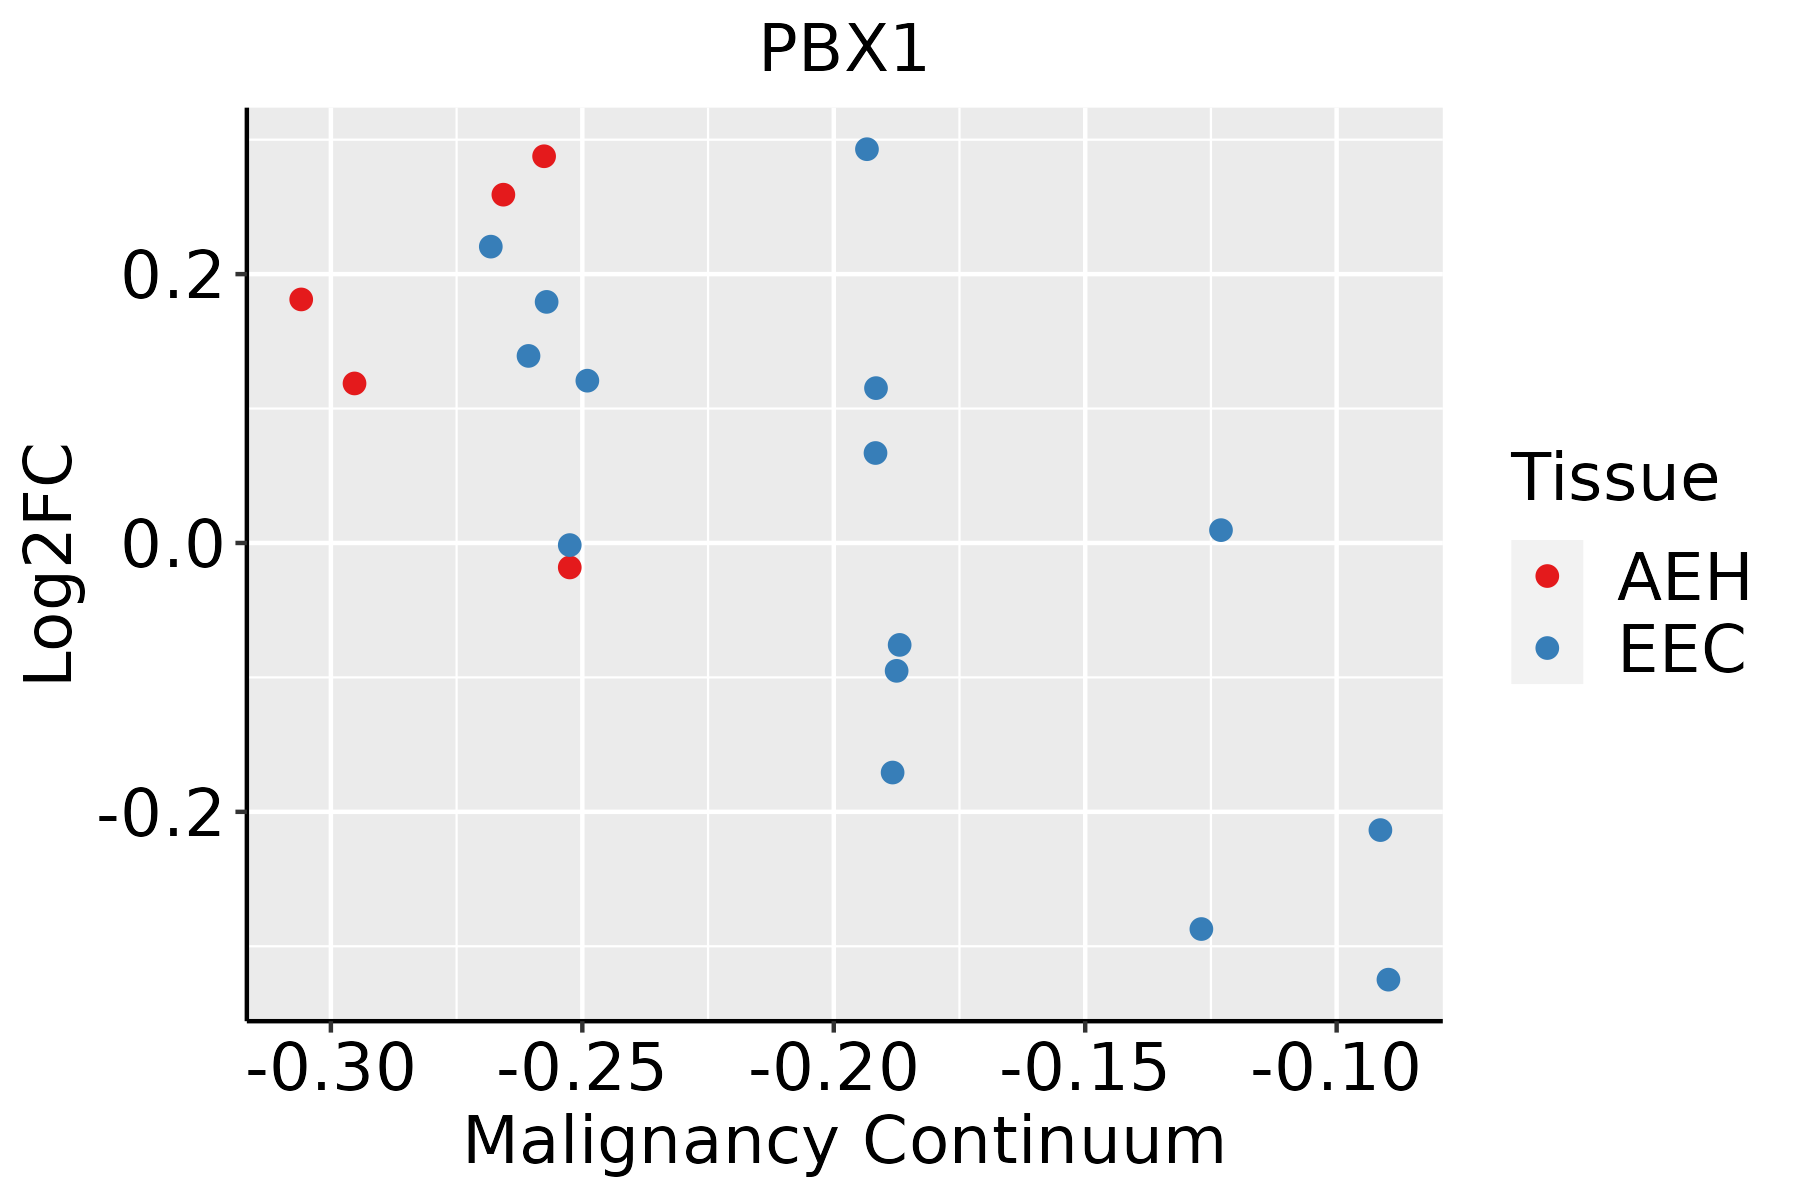 | AEH: Atypical endometrial hyperplasia |
| EEC: Endometrioid Cancer | ||
| Esophagus |  | ESCC: Esophageal squamous cell carcinoma |
| HGIN: High-grade intraepithelial neoplasias | ||
| LGIN: Low-grade intraepithelial neoplasias | ||
| Lung | 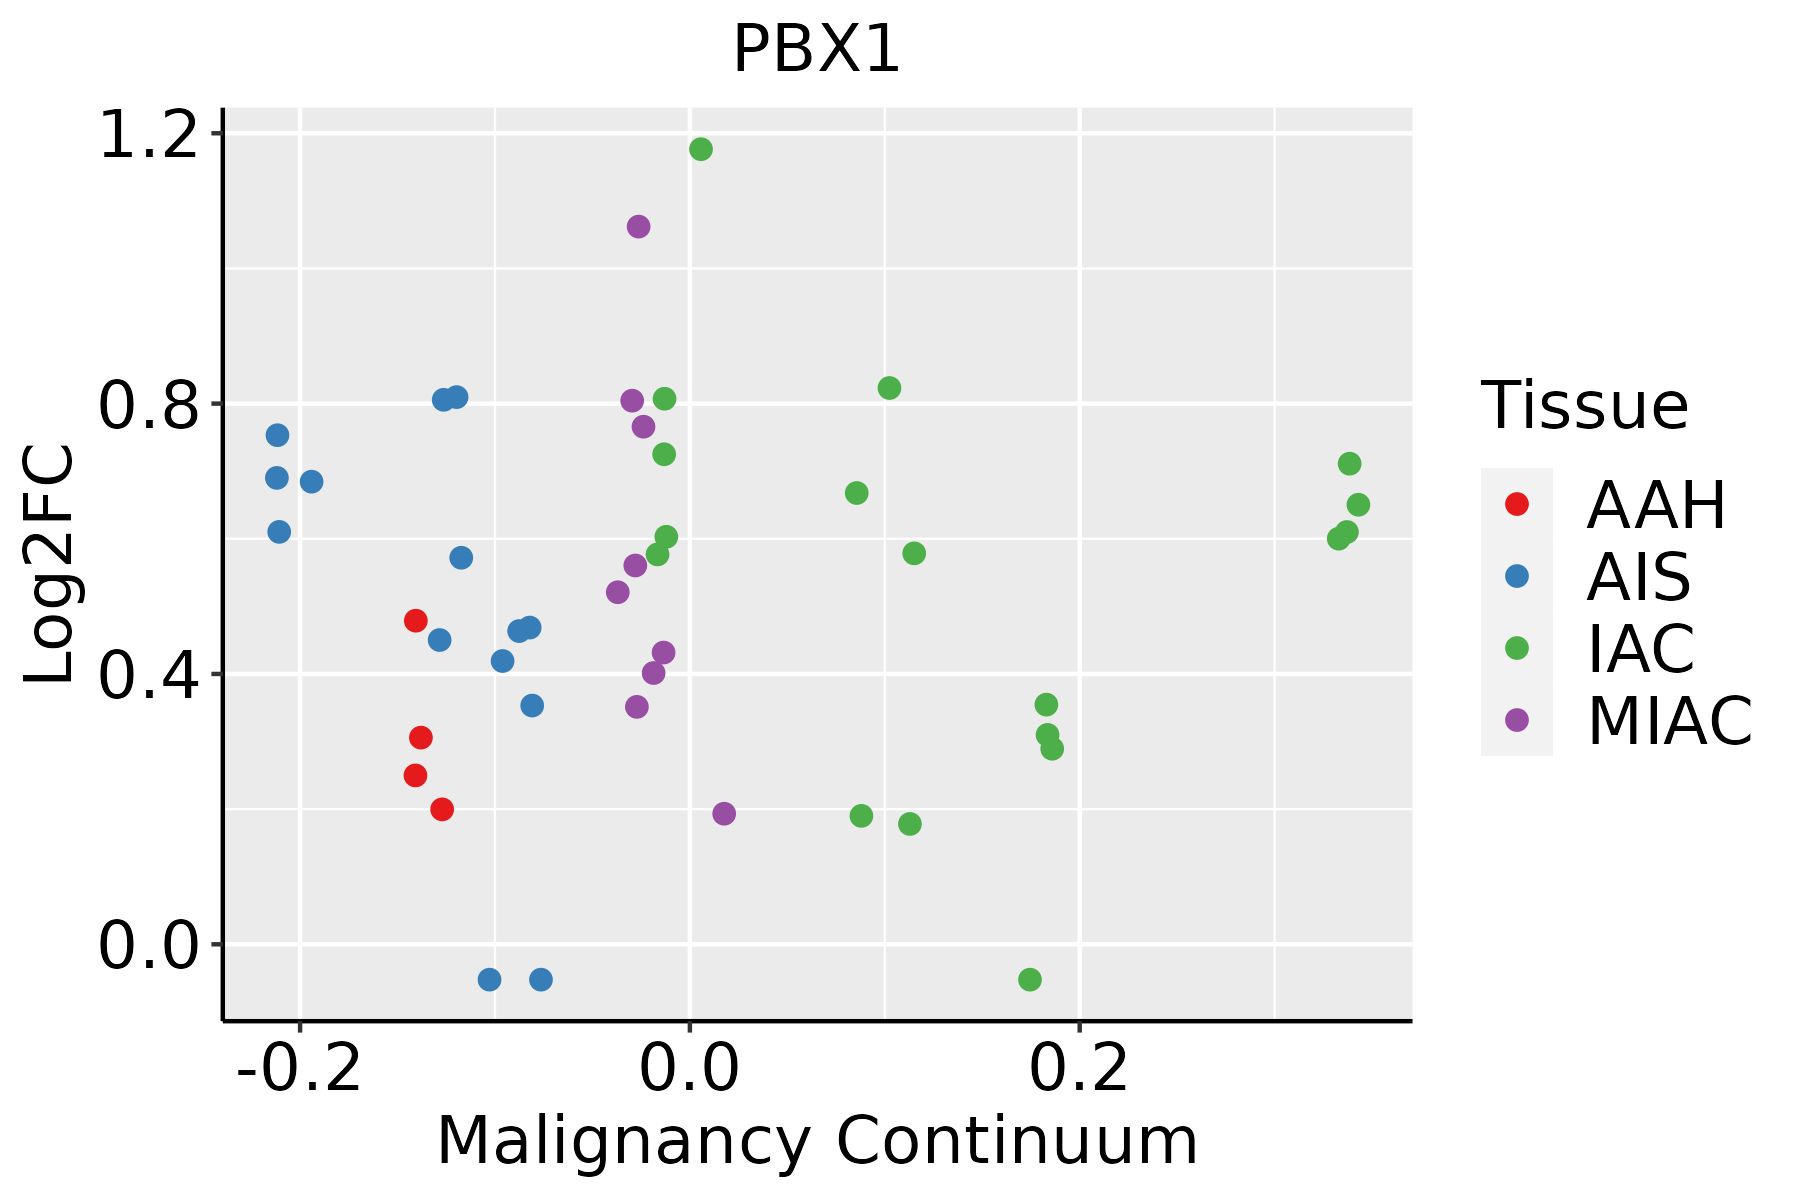 | AAH: Atypical adenomatous hyperplasia |
| AIS: Adenocarcinoma in situ | ||
| IAC: Invasive lung adenocarcinoma | ||
| MIA: Minimally invasive adenocarcinoma | ||
| Oral Cavity |  | EOLP: Erosive Oral lichen planus |
| LP: leukoplakia | ||
| NEOLP: Non-erosive oral lichen planus | ||
| OSCC: Oral squamous cell carcinoma | ||
| Prostate | 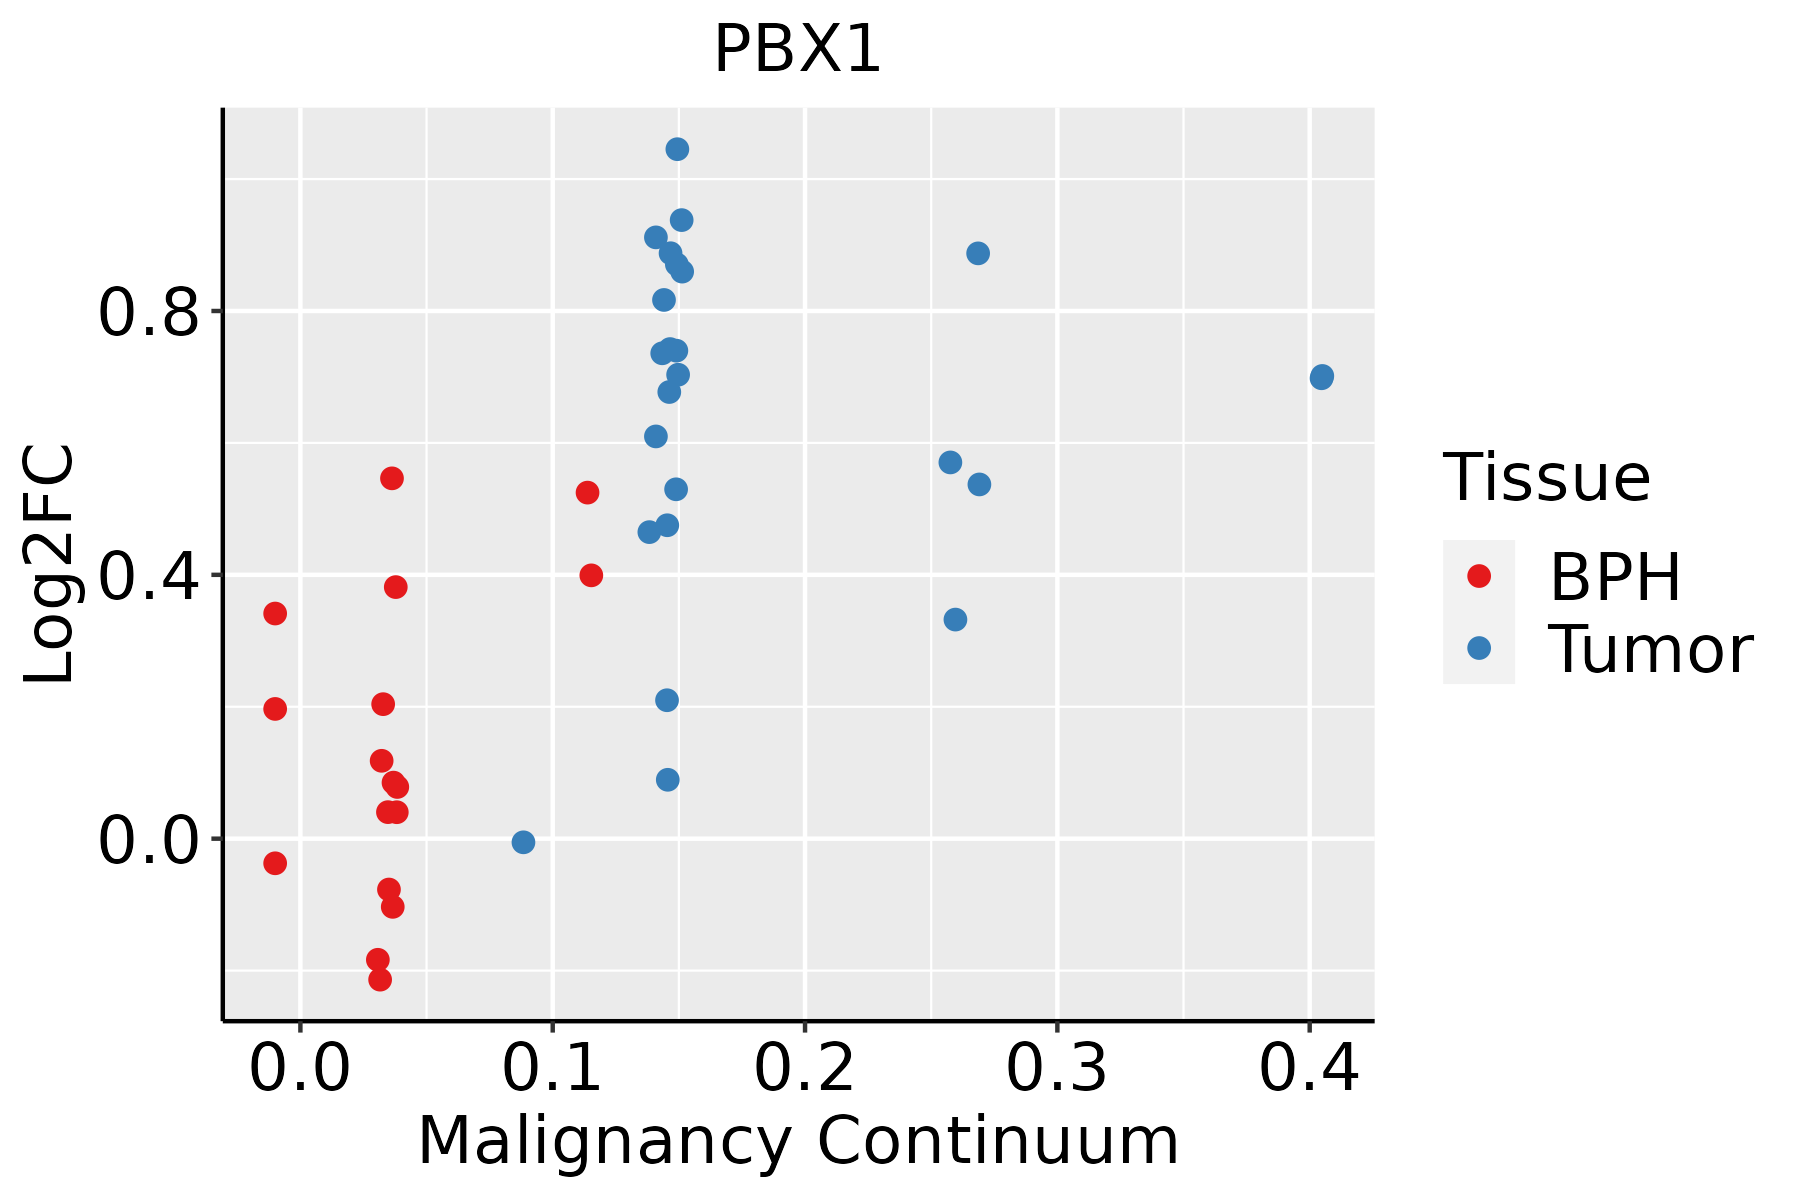 | BPH: Benign Prostatic Hyperplasia |
| Thyroid | 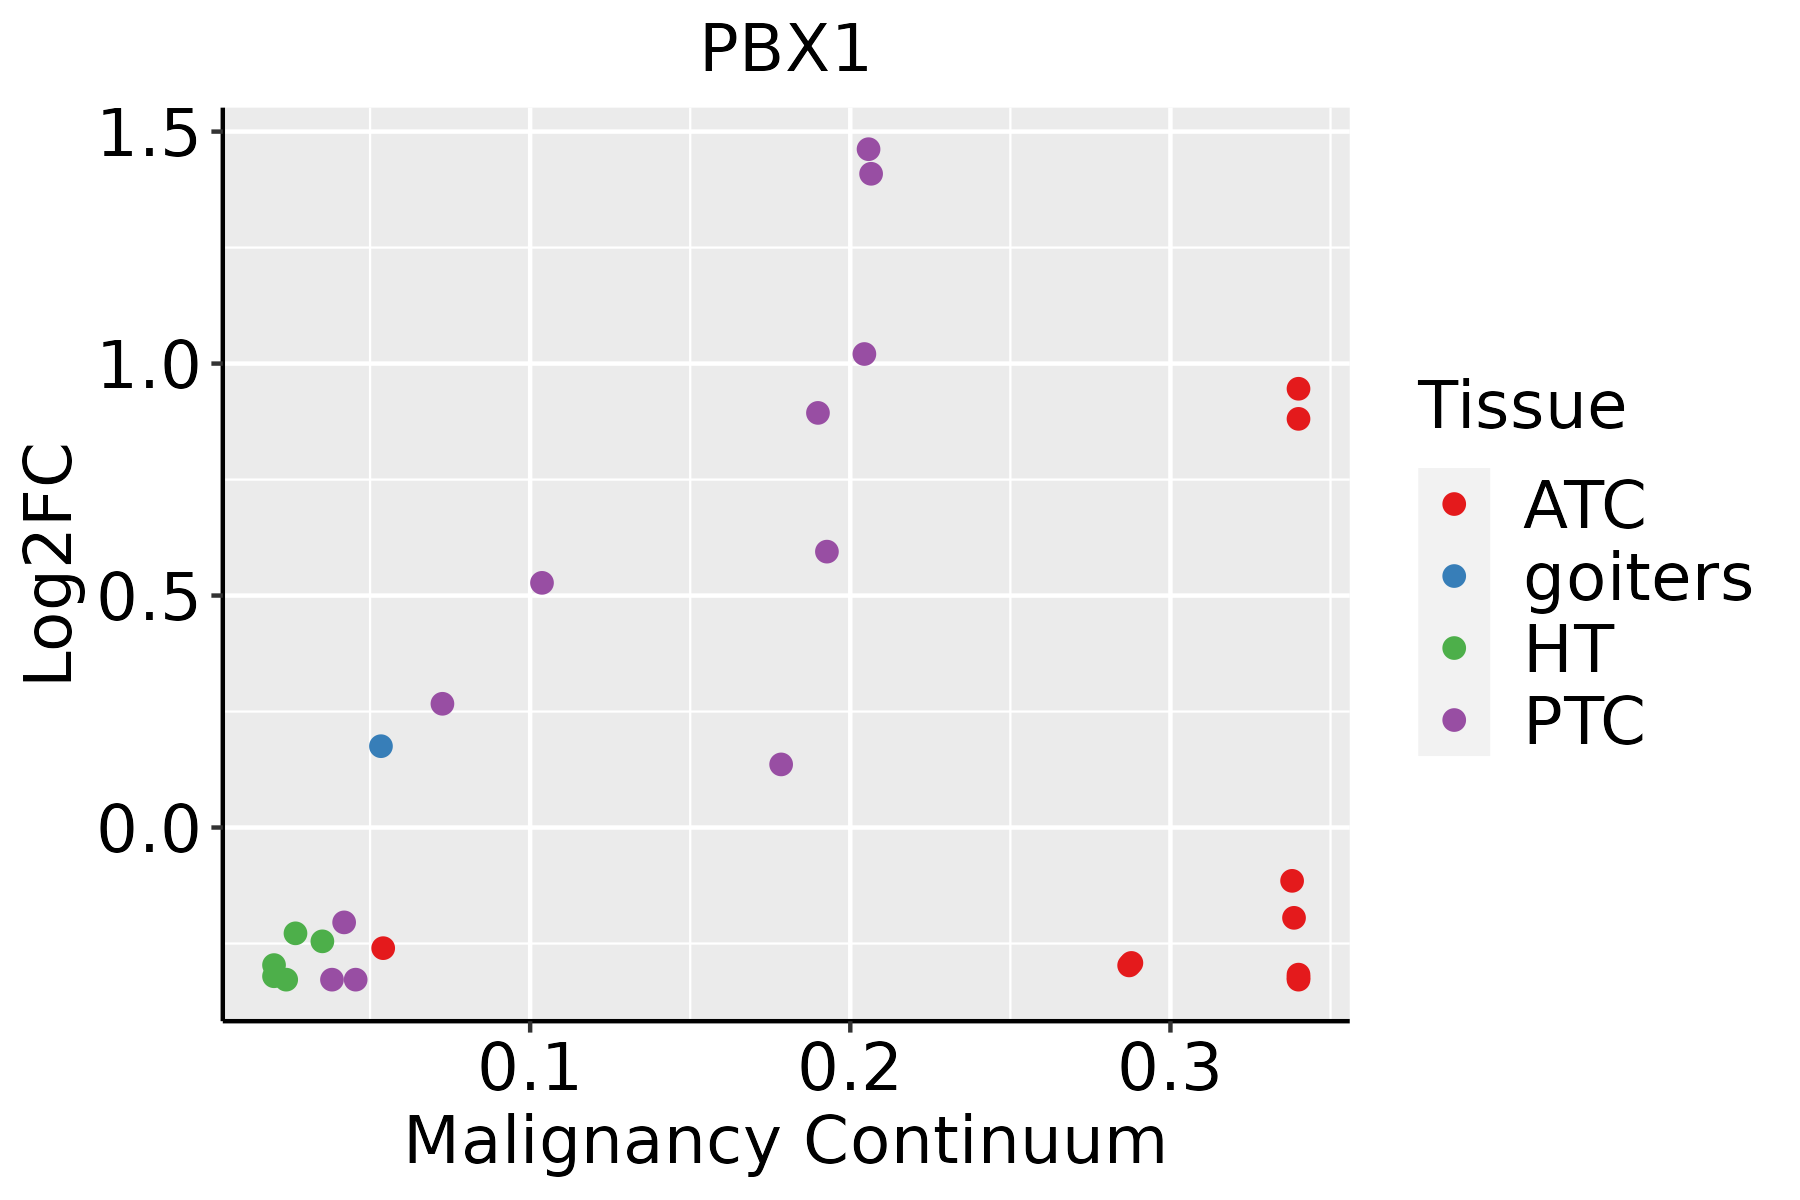 | ATC: Anaplastic thyroid cancer |
| HT: Hashimoto's thyroiditis | ||
| PTC: Papillary thyroid cancer |
| ∗log2FC in expression of this searched gene in stem-like cells from each diseased tissue sample relative to stem-like cells in normal samples in each tissue plotted against the malignancy continuum. Samples are colored based on if they are from different disease stage. |
Top |
Malignant transformation related pathway analysis |
| Find out the enriched GO biological processes and KEGG pathways involved in transition from healthy to precancer to cancer |
| Tissue | Disease Stage | Enriched GO biological Processes |
| Colorectum | AD |  |
| Colorectum | SER |  |
| Colorectum | MSS |  |
| Colorectum | MSI-H |  |
| Colorectum | FAP |  |
| ∗Top 15 enriched GO BP terms are showed in the bar plot of each disease state in each tissue. Each row represents a significant GO biological process which is colored according to the -log10(p.adjust). |
| Page: 1 2 3 4 5 6 7 8 9 |
| GO ID | Tissue | Disease Stage | Description | Gene Ratio | Bg Ratio | pvalue | p.adjust | Count |
| GO:00487329 | Breast | Precancer | gland development | 49/1080 | 436/18723 | 6.11e-06 | 1.73e-04 | 49 |
| GO:19031313 | Breast | Precancer | mononuclear cell differentiation | 43/1080 | 426/18723 | 2.61e-04 | 3.84e-03 | 43 |
| GO:0048538 | Breast | Precancer | thymus development | 9/1080 | 45/18723 | 9.22e-04 | 1.05e-02 | 9 |
| GO:0030098 | Breast | Precancer | lymphocyte differentiation | 36/1080 | 374/18723 | 1.85e-03 | 1.81e-02 | 36 |
| GO:00605625 | Breast | Precancer | epithelial tube morphogenesis | 31/1080 | 325/18723 | 4.21e-03 | 3.31e-02 | 31 |
| GO:00720735 | Breast | Precancer | kidney epithelium development | 16/1080 | 136/18723 | 5.21e-03 | 3.88e-02 | 16 |
| GO:00016572 | Breast | Precancer | ureteric bud development | 12/1080 | 91/18723 | 5.97e-03 | 4.22e-02 | 12 |
| GO:00720803 | Breast | Precancer | nephron tubule development | 12/1080 | 91/18723 | 5.97e-03 | 4.22e-02 | 12 |
| GO:00721632 | Breast | Precancer | mesonephric epithelium development | 12/1080 | 92/18723 | 6.51e-03 | 4.51e-02 | 12 |
| GO:00721642 | Breast | Precancer | mesonephric tubule development | 12/1080 | 92/18723 | 6.51e-03 | 4.51e-02 | 12 |
| GO:0072078 | Breast | Precancer | nephron tubule morphogenesis | 10/1080 | 71/18723 | 7.33e-03 | 4.88e-02 | 10 |
| GO:00015036 | Breast | Precancer | ossification | 36/1080 | 408/18723 | 7.53e-03 | 4.98e-02 | 36 |
| GO:004873214 | Breast | IDC | gland development | 64/1434 | 436/18723 | 3.47e-07 | 1.74e-05 | 64 |
| GO:006056212 | Breast | IDC | epithelial tube morphogenesis | 44/1434 | 325/18723 | 1.58e-04 | 2.73e-03 | 44 |
| GO:00611383 | Breast | IDC | morphogenesis of a branching epithelium | 28/1434 | 182/18723 | 3.05e-04 | 4.60e-03 | 28 |
| GO:00017635 | Breast | IDC | morphogenesis of a branching structure | 29/1434 | 196/18723 | 4.68e-04 | 6.26e-03 | 29 |
| GO:000150311 | Breast | IDC | ossification | 50/1434 | 408/18723 | 6.51e-04 | 8.04e-03 | 50 |
| GO:190313111 | Breast | IDC | mononuclear cell differentiation | 51/1434 | 426/18723 | 9.81e-04 | 1.11e-02 | 51 |
| GO:00066944 | Breast | IDC | steroid biosynthetic process | 25/1434 | 173/18723 | 1.56e-03 | 1.56e-02 | 25 |
| GO:00485381 | Breast | IDC | thymus development | 10/1434 | 45/18723 | 1.80e-03 | 1.74e-02 | 10 |
| Page: 1 2 3 4 5 6 7 8 9 10 11 12 13 14 15 16 17 18 19 20 21 22 23 24 25 26 27 |
| Pathway ID | Tissue | Disease Stage | Description | Gene Ratio | Bg Ratio | pvalue | p.adjust | qvalue | Count |
| hsa05202 | Colorectum | FAP | Transcriptional misregulation in cancer | 45/1404 | 193/8465 | 9.19e-03 | 3.33e-02 | 2.03e-02 | 45 |
| hsa052021 | Colorectum | FAP | Transcriptional misregulation in cancer | 45/1404 | 193/8465 | 9.19e-03 | 3.33e-02 | 2.03e-02 | 45 |
| hsa052028 | Esophagus | ESCC | Transcriptional misregulation in cancer | 116/4205 | 193/8465 | 2.08e-03 | 5.95e-03 | 3.05e-03 | 116 |
| hsa0520213 | Esophagus | ESCC | Transcriptional misregulation in cancer | 116/4205 | 193/8465 | 2.08e-03 | 5.95e-03 | 3.05e-03 | 116 |
| hsa052026 | Lung | IAC | Transcriptional misregulation in cancer | 40/1053 | 193/8465 | 6.90e-04 | 5.90e-03 | 3.92e-03 | 40 |
| hsa0520211 | Lung | IAC | Transcriptional misregulation in cancer | 40/1053 | 193/8465 | 6.90e-04 | 5.90e-03 | 3.92e-03 | 40 |
| hsa052022 | Lung | AIS | Transcriptional misregulation in cancer | 39/961 | 193/8465 | 2.15e-04 | 2.41e-03 | 1.54e-03 | 39 |
| hsa052023 | Lung | AIS | Transcriptional misregulation in cancer | 39/961 | 193/8465 | 2.15e-04 | 2.41e-03 | 1.54e-03 | 39 |
| hsa052024 | Lung | MIAC | Transcriptional misregulation in cancer | 22/507 | 193/8465 | 2.64e-03 | 2.26e-02 | 1.64e-02 | 22 |
| hsa052025 | Lung | MIAC | Transcriptional misregulation in cancer | 22/507 | 193/8465 | 2.64e-03 | 2.26e-02 | 1.64e-02 | 22 |
| hsa052027 | Prostate | BPH | Transcriptional misregulation in cancer | 53/1718 | 193/8465 | 9.56e-03 | 2.92e-02 | 1.81e-02 | 53 |
| hsa0520212 | Prostate | BPH | Transcriptional misregulation in cancer | 53/1718 | 193/8465 | 9.56e-03 | 2.92e-02 | 1.81e-02 | 53 |
| hsa0520221 | Prostate | Tumor | Transcriptional misregulation in cancer | 59/1791 | 193/8465 | 1.22e-03 | 5.26e-03 | 3.26e-03 | 59 |
| hsa0520231 | Prostate | Tumor | Transcriptional misregulation in cancer | 59/1791 | 193/8465 | 1.22e-03 | 5.26e-03 | 3.26e-03 | 59 |
| Page: 1 |
Top |
Cell-cell communication analysis |
| Identification of potential cell-cell interactions between two cell types and their ligand-receptor pairs for different disease states |
| Ligand | Receptor | LRpair | Pathway | Tissue | Disease Stage |
| Page: 1 |
Top |
Single-cell gene regulatory network inference analysis |
| Find out the significant the regulons (TFs) and the target genes of each regulon across cell types for different disease states |
| TF | Cell Type | Tissue | Disease Stage | Target Gene | RSS | Regulon Activity |
| PBX1 | CT | Colorectum | ADJ | SPATA6L,DACH1,NCKAP5, etc. | 9.26e-02 |  |
| PBX1 | CT | Colorectum | Healthy | MEIS1,PRUNE2,UNC5C, etc. | 1.49e-01 |  |
| PBX1 | GLAN | Endometrium | Healthy | EMX2,PALLD,DPYSL3, etc. | 6.12e-01 |  |
| PBX1 | QUIE | Esophagus | LGIN | KIT,BEX2,METTL7A, etc. | 4.02e-01 |  |
| PBX1 | ECM | Esophagus | ESCC | IGF1,TCF21,A2M, etc. | 1.44e-01 |  |
| PBX1 | ICAF | Esophagus | Healthy | IGF1,TCF21,A2M, etc. | 1.38e-01 |  |
| PBX1 | ABP | Lung | Healthy | CENPW,CKS2,IFI6, etc. | 9.80e-02 |  |
| PBX1 | STM | Oral cavity | ADJ | ZBTB7C,NFIB,METTL7A, etc. | 7.24e-01 |  |
| PBX1 | STM | Oral cavity | Healthy | SUCO,MPPED2,SIPA1L2, etc. | 4.17e-01 |  |
| PBX1 | MAST | Oral cavity | ADJ | GATA2,NFIB,ELF3, etc. | 3.00e-02 | |
| ∗The dot plots of a searched regulon are shown for all cell subpopulations in each disease state of each tissue based on the regulon specific score inferred using pySCENIC and by calculating the average expression. |
| Page: 1 2 3 4 5 |
Top |
Somatic mutation of malignant transformation related genes |
| Annotation of somatic variants for genes involved in malignant transformation |
| Hugo Symbol | Variant Class | Variant Classification | dbSNP RS | HGVSc | HGVSp | HGVSp Short | SWISSPROT | BIOTYPE | SIFT | PolyPhen | Tumor Sample Barcode | Tissue | Histology | Sex | Age | Stage | Therapy Types | Drugs | Outcome |
| PBX1 | SNV | Missense_Mutation | c.1273N>A | p.His425Asn | p.H425N | P40424 | protein_coding | tolerated(0.27) | benign(0.005) | TCGA-A2-A0YH-01 | Breast | breast invasive carcinoma | Female | <65 | III/IV | Chemotherapy | adriamycin | SD | |
| PBX1 | SNV | Missense_Mutation | c.772N>T | p.Asn258Tyr | p.N258Y | P40424 | protein_coding | deleterious(0.01) | probably_damaging(0.916) | TCGA-AO-A03O-01 | Breast | breast invasive carcinoma | Female | >=65 | I/II | Chemotherapy | doxorubicin | SD | |
| PBX1 | SNV | Missense_Mutation | novel | c.446N>T | p.Asp149Val | p.D149V | P40424 | protein_coding | deleterious(0) | probably_damaging(0.996) | TCGA-C8-A8HP-01 | Breast | breast invasive carcinoma | Female | <65 | III/IV | Chemotherapy | 5-fluorouracil | CR |
| PBX1 | SNV | Missense_Mutation | novel | c.704N>A | p.Arg235Gln | p.R235Q | P40424 | protein_coding | deleterious(0) | probably_damaging(0.951) | TCGA-EA-A410-01 | Cervix | cervical & endocervical cancer | Female | <65 | I/II | Unknown | Unknown | SD |
| PBX1 | SNV | Missense_Mutation | novel | c.199G>T | p.Ala67Ser | p.A67S | P40424 | protein_coding | tolerated(0.15) | benign(0.091) | TCGA-EK-A2R9-01 | Cervix | cervical & endocervical cancer | Female | <65 | I/II | Unknown | Unknown | SD |
| PBX1 | SNV | Missense_Mutation | c.361N>C | p.Glu121Gln | p.E121Q | P40424 | protein_coding | tolerated(0.08) | possibly_damaging(0.714) | TCGA-IR-A3LI-01 | Cervix | cervical & endocervical cancer | Female | <65 | I/II | Chemotherapy | cisplatin | CR | |
| PBX1 | SNV | Missense_Mutation | rs541105414 | c.1165G>A | p.Ala389Thr | p.A389T | P40424 | protein_coding | tolerated(0.53) | benign(0) | TCGA-AZ-4315-01 | Colorectum | colon adenocarcinoma | Male | <65 | I/II | Unknown | Unknown | SD |
| PBX1 | SNV | Missense_Mutation | rs201029742 | c.1160N>T | p.Gly387Val | p.G387V | P40424 | protein_coding | deleterious(0.03) | benign(0.003) | TCGA-AZ-6598-01 | Colorectum | colon adenocarcinoma | Female | >=65 | I/II | Unknown | Unknown | SD |
| PBX1 | SNV | Missense_Mutation | c.614A>G | p.His205Arg | p.H205R | P40424 | protein_coding | tolerated(0.14) | benign(0.225) | TCGA-CM-4743-01 | Colorectum | colon adenocarcinoma | Male | >=65 | I/II | Chemotherapy | capecitabine | SD | |
| PBX1 | SNV | Missense_Mutation | c.868C>T | p.Arg290Trp | p.R290W | P40424 | protein_coding | deleterious(0.01) | probably_damaging(1) | TCGA-D5-6531-01 | Colorectum | colon adenocarcinoma | Male | >=65 | I/II | Unknown | Unknown | SD |
| Page: 1 2 3 4 5 6 7 |
Top |
Related drugs of malignant transformation related genes |
| Identification of chemicals and drugs interact with genes involved in malignant transfromation |
| (DGIdb 4.0) |
| Entrez ID | Symbol | Category | Interaction Types | Drug Claim Name | Drug Name | PMIDs |
| Page: 1 |

Copyright 2023-Present -The University of Texas Health Science Center at Houston |