
|
|||||
|
 | |
| |
| |
| |
| |
| |
|
Gene: PBRM1 |
Gene summary for PBRM1 |
| Gene information | Species | Human | Gene symbol | PBRM1 | Gene ID | 55193 |
| Gene name | polybromo 1 | |
| Gene Alias | BAF180 | |
| Cytomap | 3p21.1 | |
| Gene Type | protein-coding | GO ID | GO:0000278 | UniProtAcc | Q86U86 |
Top |
Malignant transformation analysis |
| Identification of the aberrant gene expression in precancerous and cancerous lesions by comparing the gene expression of stem-like cells in diseased tissues with normal stem cells |
| Entrez ID | Symbol | Replicates | Species | Organ | Tissue | Adj P-value | Log2FC | Malignancy |
| 55193 | PBRM1 | HTA11_3410_2000001011 | Human | Colorectum | AD | 3.43e-13 | -5.34e-01 | 0.0155 |
| 55193 | PBRM1 | HTA11_866_3004761011 | Human | Colorectum | AD | 1.82e-05 | -4.32e-01 | 0.096 |
| 55193 | PBRM1 | HTA11_7696_3000711011 | Human | Colorectum | AD | 1.80e-03 | -3.16e-01 | 0.0674 |
| 55193 | PBRM1 | HTA11_6818_2000001021 | Human | Colorectum | AD | 1.38e-04 | -4.57e-01 | 0.0588 |
| 55193 | PBRM1 | HTA11_99999973899_84307 | Human | Colorectum | MSS | 1.17e-02 | -5.27e-01 | 0.2585 |
| 55193 | PBRM1 | HTA11_99999974143_84620 | Human | Colorectum | MSS | 8.84e-09 | -4.44e-01 | 0.3005 |
| 55193 | PBRM1 | A001-C-207 | Human | Colorectum | FAP | 3.61e-02 | -1.53e-01 | 0.1278 |
| 55193 | PBRM1 | A015-C-203 | Human | Colorectum | FAP | 2.22e-25 | -2.96e-01 | -0.1294 |
| 55193 | PBRM1 | A015-C-204 | Human | Colorectum | FAP | 4.35e-05 | -2.05e-01 | -0.0228 |
| 55193 | PBRM1 | A014-C-040 | Human | Colorectum | FAP | 1.75e-04 | -3.89e-01 | -0.1184 |
| 55193 | PBRM1 | A002-C-201 | Human | Colorectum | FAP | 1.27e-14 | -2.71e-01 | 0.0324 |
| 55193 | PBRM1 | A002-C-203 | Human | Colorectum | FAP | 1.23e-04 | -1.45e-01 | 0.2786 |
| 55193 | PBRM1 | A001-C-119 | Human | Colorectum | FAP | 5.29e-06 | -2.59e-01 | -0.1557 |
| 55193 | PBRM1 | A001-C-108 | Human | Colorectum | FAP | 5.43e-16 | -9.82e-02 | -0.0272 |
| 55193 | PBRM1 | A002-C-205 | Human | Colorectum | FAP | 1.41e-20 | -2.44e-01 | -0.1236 |
| 55193 | PBRM1 | A015-C-006 | Human | Colorectum | FAP | 3.93e-15 | -3.28e-01 | -0.0994 |
| 55193 | PBRM1 | A015-C-106 | Human | Colorectum | FAP | 2.14e-11 | -1.81e-01 | -0.0511 |
| 55193 | PBRM1 | A002-C-114 | Human | Colorectum | FAP | 2.83e-17 | -1.46e-01 | -0.1561 |
| 55193 | PBRM1 | A015-C-104 | Human | Colorectum | FAP | 2.48e-31 | -2.17e-01 | -0.1899 |
| 55193 | PBRM1 | A001-C-014 | Human | Colorectum | FAP | 1.47e-13 | -1.36e-01 | 0.0135 |
| Page: 1 2 3 4 5 6 7 8 9 |
| Tissue | Expression Dynamics | Abbreviation |
| Colorectum (GSE201348) |  | FAP: Familial adenomatous polyposis |
| CRC: Colorectal cancer | ||
| Colorectum (HTA11) |  | AD: Adenomas |
| SER: Sessile serrated lesions | ||
| MSI-H: Microsatellite-high colorectal cancer | ||
| MSS: Microsatellite stable colorectal cancer | ||
| Esophagus | 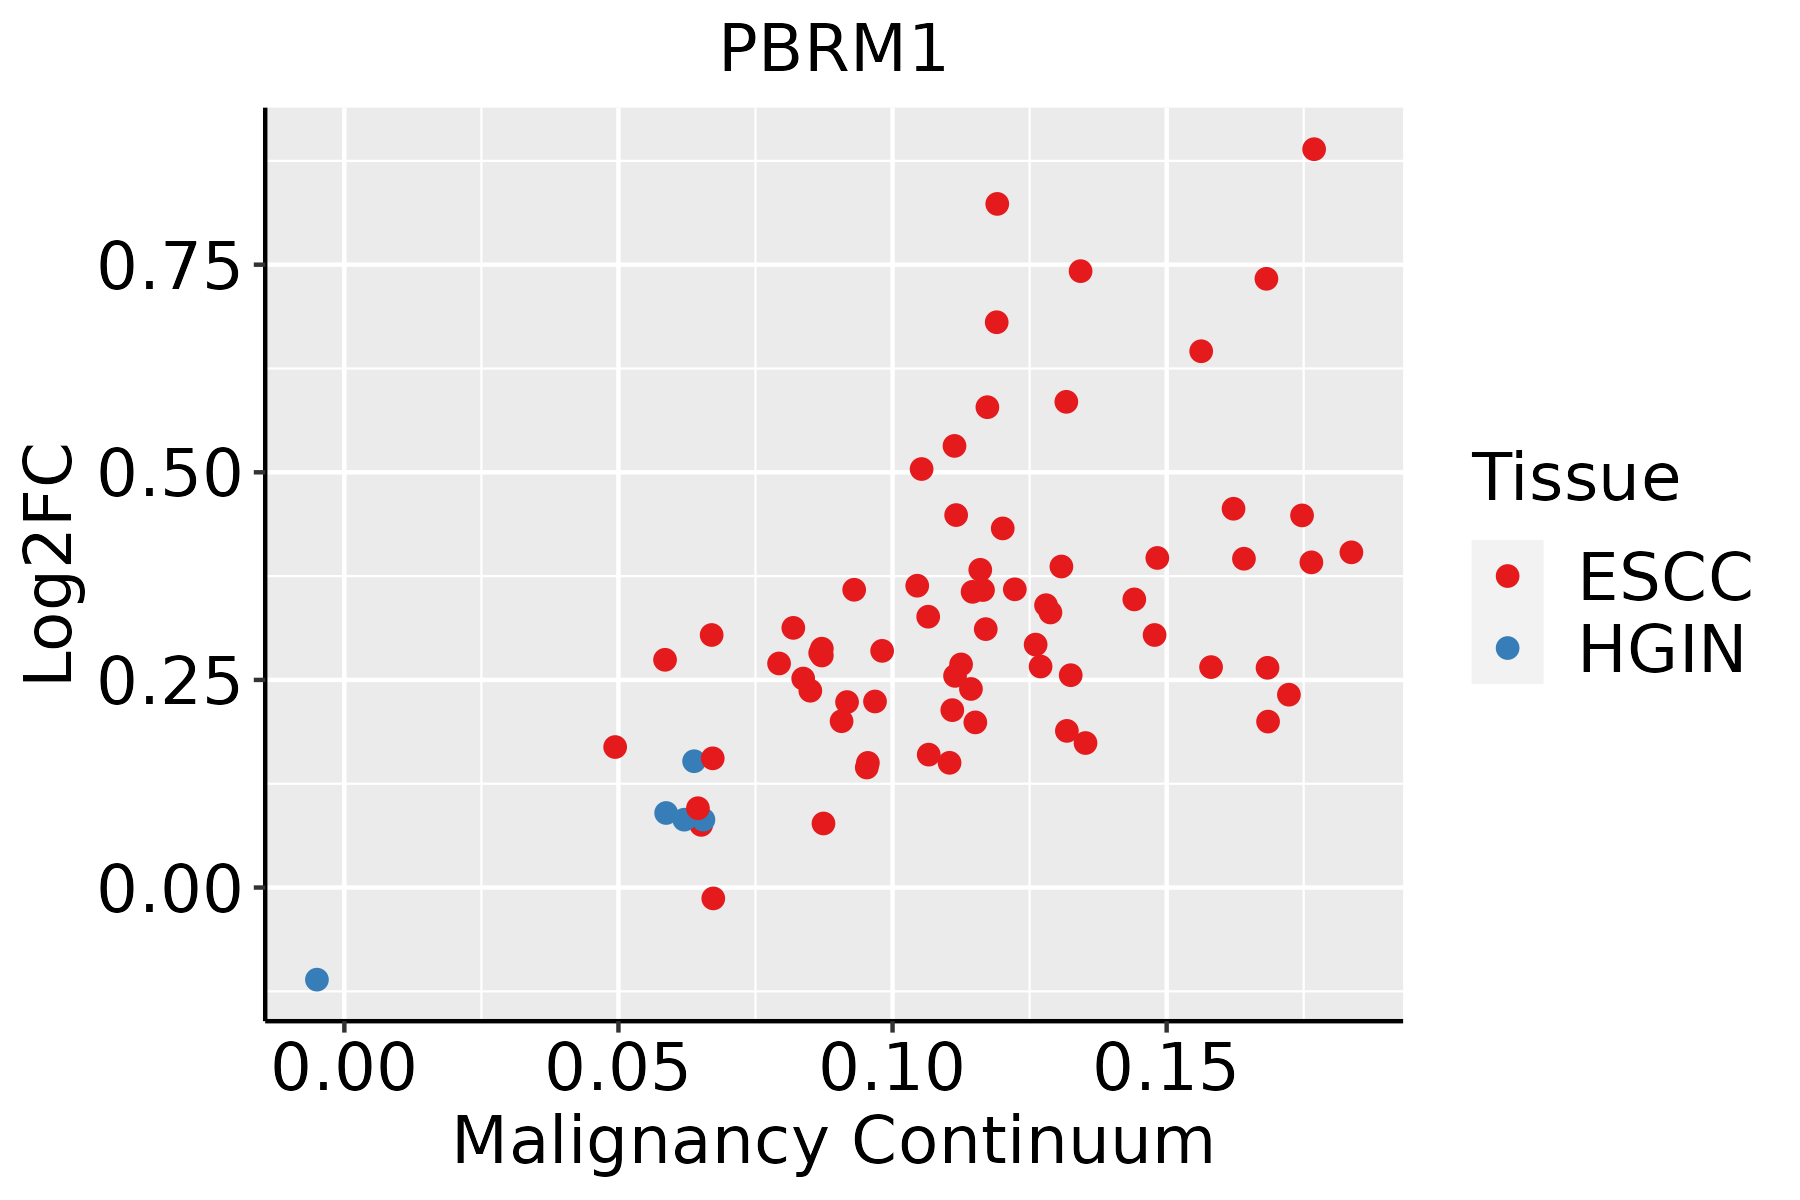 | ESCC: Esophageal squamous cell carcinoma |
| HGIN: High-grade intraepithelial neoplasias | ||
| LGIN: Low-grade intraepithelial neoplasias | ||
| Liver |  | HCC: Hepatocellular carcinoma |
| NAFLD: Non-alcoholic fatty liver disease | ||
| Lung |  | AAH: Atypical adenomatous hyperplasia |
| AIS: Adenocarcinoma in situ | ||
| IAC: Invasive lung adenocarcinoma | ||
| MIA: Minimally invasive adenocarcinoma | ||
| Oral Cavity | 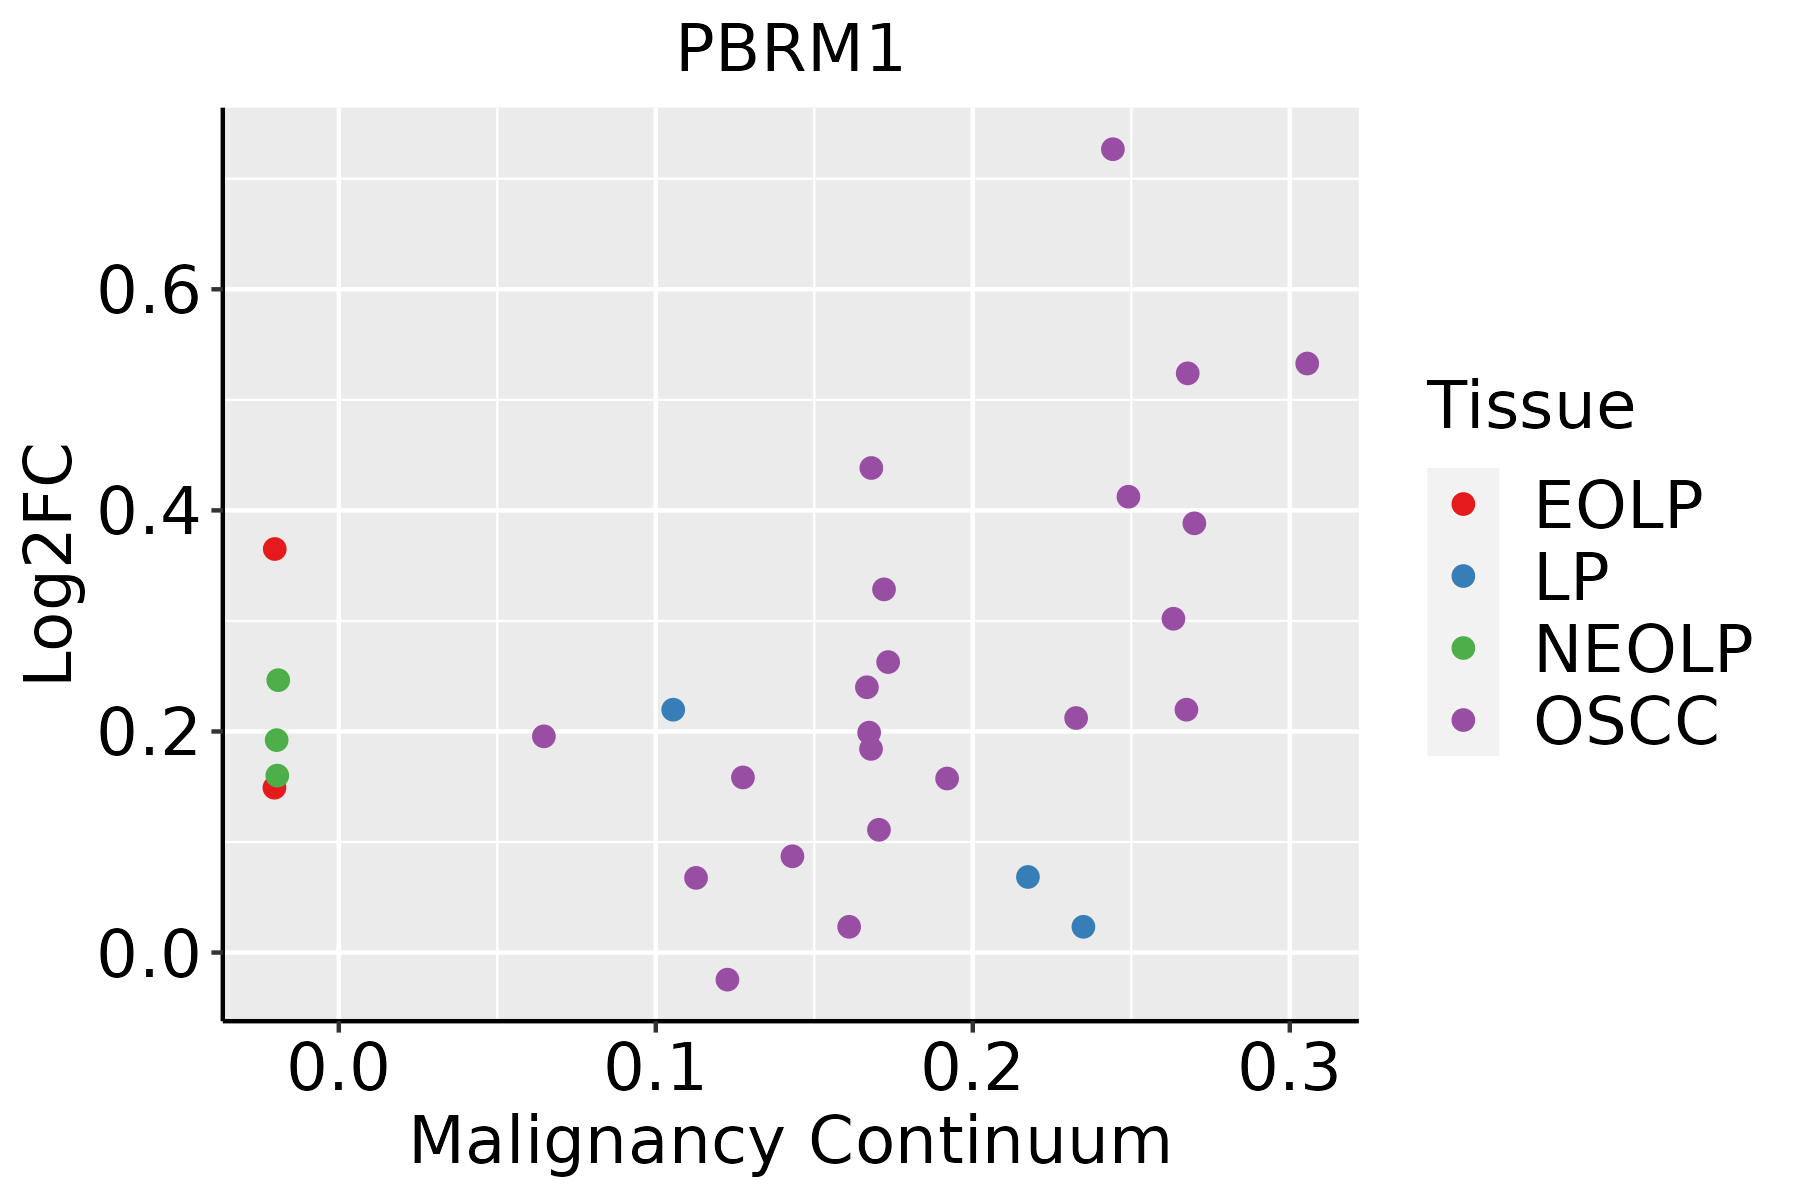 | EOLP: Erosive Oral lichen planus |
| LP: leukoplakia | ||
| NEOLP: Non-erosive oral lichen planus | ||
| OSCC: Oral squamous cell carcinoma | ||
| Prostate | 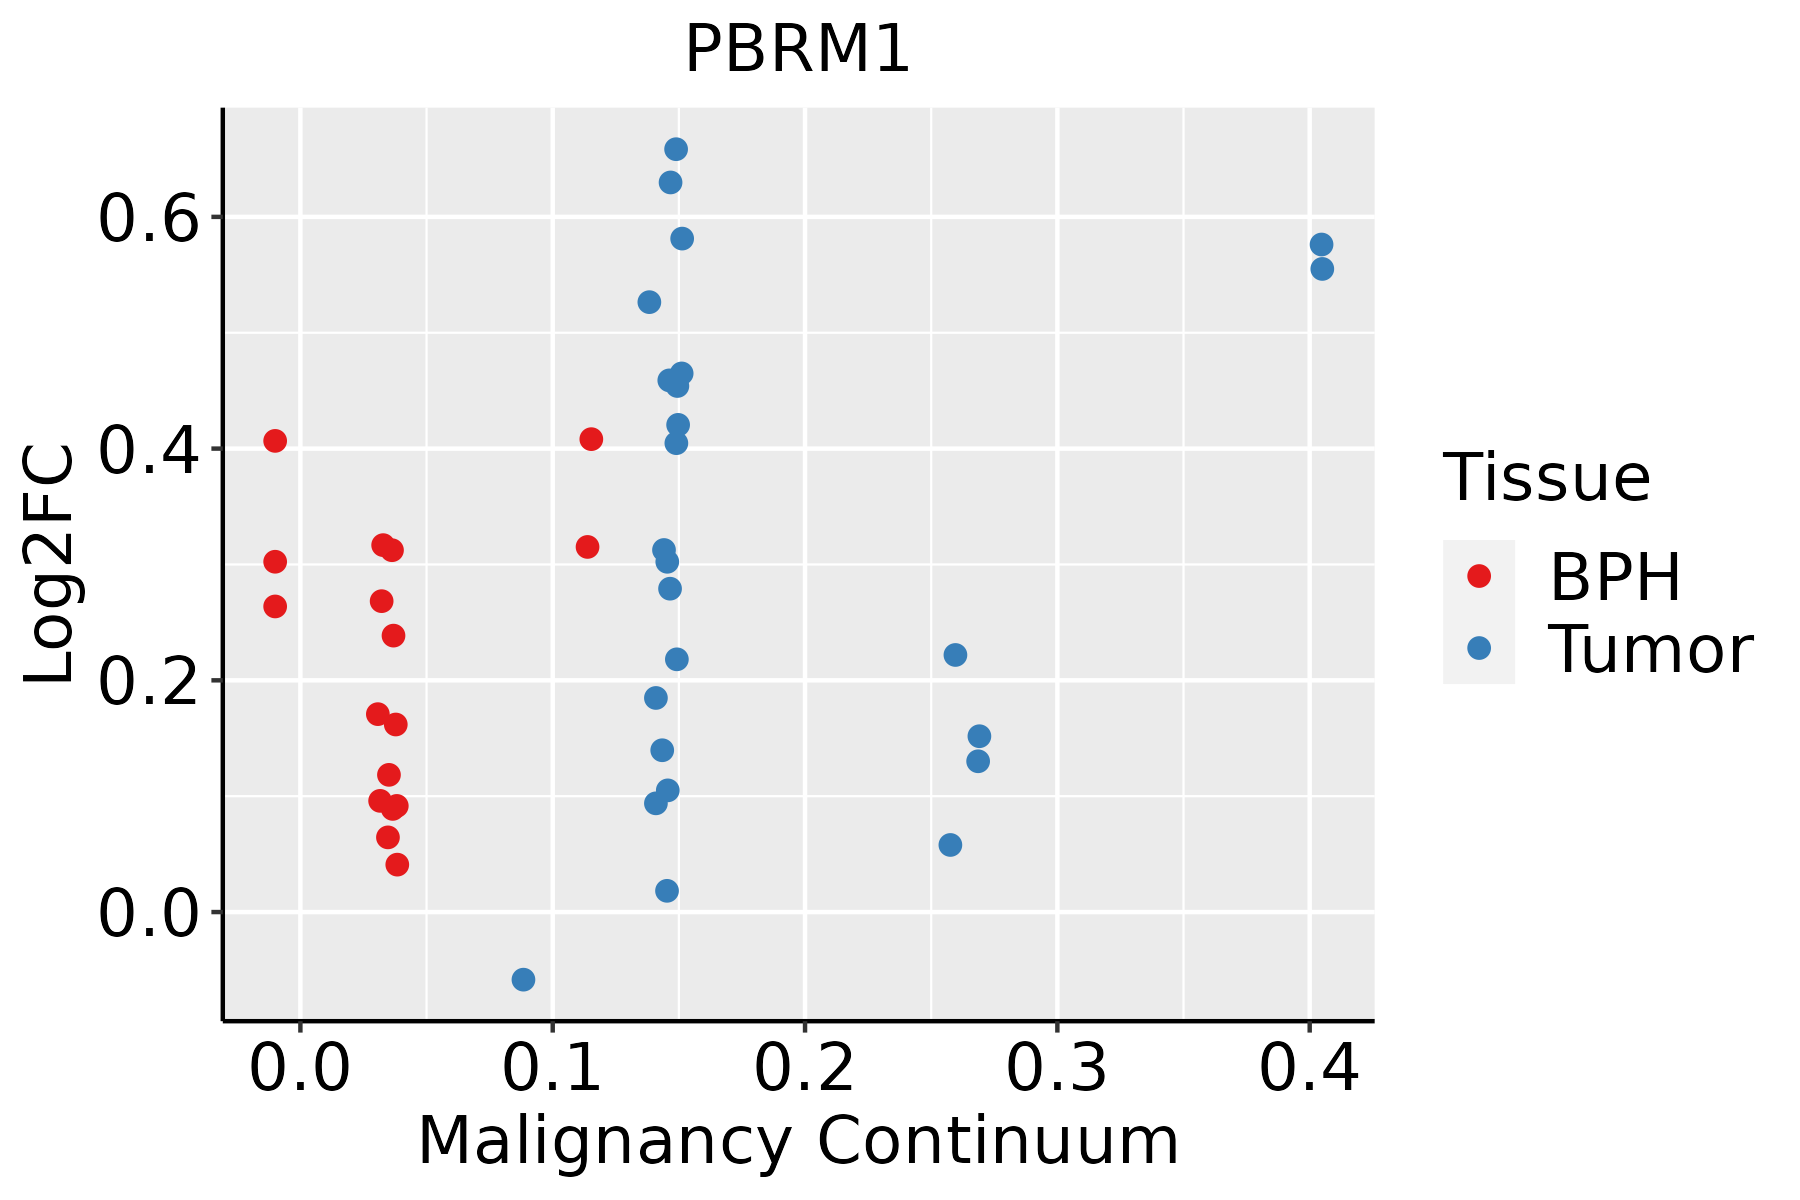 | BPH: Benign Prostatic Hyperplasia |
| Skin | 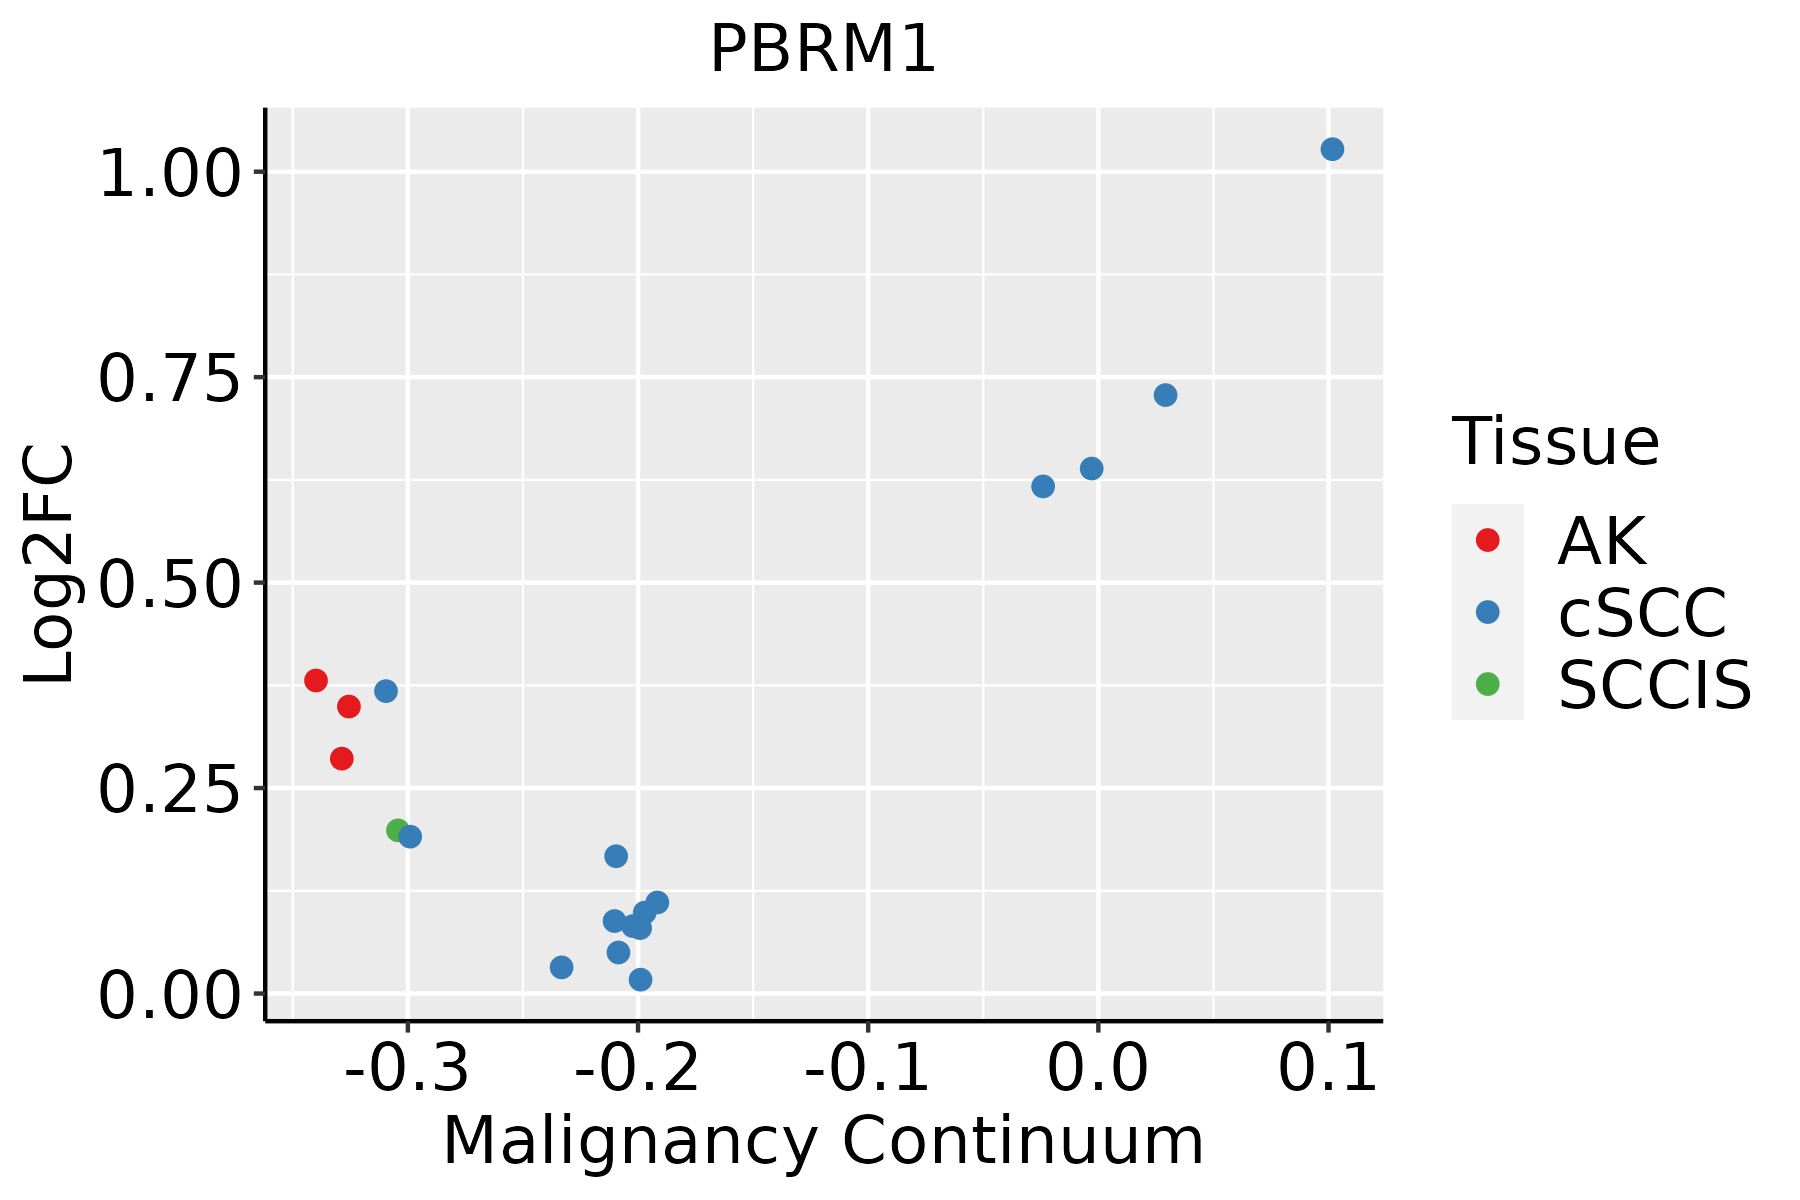 | AK: Actinic keratosis |
| cSCC: Cutaneous squamous cell carcinoma | ||
| SCCIS:squamous cell carcinoma in situ | ||
| Thyroid |  | ATC: Anaplastic thyroid cancer |
| HT: Hashimoto's thyroiditis | ||
| PTC: Papillary thyroid cancer |
| ∗log2FC in expression of this searched gene in stem-like cells from each diseased tissue sample relative to stem-like cells in normal samples in each tissue plotted against the malignancy continuum. Samples are colored based on if they are from different disease stage. |
Top |
Malignant transformation related pathway analysis |
| Find out the enriched GO biological processes and KEGG pathways involved in transition from healthy to precancer to cancer |
| Tissue | Disease Stage | Enriched GO biological Processes |
| Colorectum | AD |  |
| Colorectum | SER |  |
| Colorectum | MSS |  |
| Colorectum | MSI-H |  |
| Colorectum | FAP |  |
| ∗Top 15 enriched GO BP terms are showed in the bar plot of each disease state in each tissue. Each row represents a significant GO biological process which is colored according to the -log10(p.adjust). |
| Page: 1 2 3 4 5 6 7 8 9 |
| GO ID | Tissue | Disease Stage | Description | Gene Ratio | Bg Ratio | pvalue | p.adjust | Count |
| GO:0006325 | Colorectum | AD | chromatin organization | 119/3918 | 409/18723 | 4.85e-05 | 8.33e-04 | 119 |
| GO:0006338 | Colorectum | AD | chromatin remodeling | 70/3918 | 255/18723 | 7.44e-03 | 4.53e-02 | 70 |
| GO:00063252 | Colorectum | MSS | chromatin organization | 107/3467 | 409/18723 | 7.22e-05 | 1.21e-03 | 107 |
| GO:00063253 | Colorectum | FAP | chromatin organization | 84/2622 | 409/18723 | 1.62e-04 | 2.47e-03 | 84 |
| GO:00063254 | Colorectum | CRC | chromatin organization | 74/2078 | 409/18723 | 1.48e-05 | 4.61e-04 | 74 |
| GO:000632517 | Esophagus | ESCC | chromatin organization | 240/8552 | 409/18723 | 6.52e-08 | 1.14e-06 | 240 |
| GO:00063255 | Liver | NAFLD | chromatin organization | 64/1882 | 409/18723 | 2.31e-04 | 3.89e-03 | 64 |
| GO:000632511 | Liver | HCC | chromatin organization | 206/7958 | 409/18723 | 7.23e-04 | 4.41e-03 | 206 |
| GO:00063256 | Lung | IAC | chromatin organization | 69/2061 | 409/18723 | 2.01e-04 | 3.53e-03 | 69 |
| GO:000632512 | Lung | AIS | chromatin organization | 62/1849 | 409/18723 | 4.24e-04 | 7.29e-03 | 62 |
| GO:000632510 | Oral cavity | OSCC | chromatin organization | 190/7305 | 409/18723 | 1.17e-03 | 5.97e-03 | 190 |
| GO:000632515 | Oral cavity | EOLP | chromatin organization | 84/2218 | 409/18723 | 2.68e-07 | 8.16e-06 | 84 |
| GO:00063383 | Oral cavity | EOLP | chromatin remodeling | 46/2218 | 255/18723 | 2.34e-03 | 1.44e-02 | 46 |
| GO:00063259 | Prostate | BPH | chromatin organization | 101/3107 | 409/18723 | 1.52e-05 | 1.94e-04 | 101 |
| GO:00063382 | Prostate | BPH | chromatin remodeling | 62/3107 | 255/18723 | 9.47e-04 | 5.97e-03 | 62 |
| GO:000632514 | Prostate | Tumor | chromatin organization | 104/3246 | 409/18723 | 2.02e-05 | 2.62e-04 | 104 |
| GO:000633811 | Prostate | Tumor | chromatin remodeling | 63/3246 | 255/18723 | 1.73e-03 | 1.02e-02 | 63 |
| GO:000632518 | Skin | AK | chromatin organization | 73/1910 | 409/18723 | 1.40e-06 | 4.26e-05 | 73 |
| GO:00063384 | Skin | AK | chromatin remodeling | 51/1910 | 255/18723 | 1.95e-06 | 5.73e-05 | 51 |
| GO:000632519 | Skin | cSCC | chromatin organization | 147/4864 | 409/18723 | 4.41e-06 | 6.52e-05 | 147 |
| Page: 1 2 |
| Pathway ID | Tissue | Disease Stage | Description | Gene Ratio | Bg Ratio | pvalue | p.adjust | qvalue | Count |
| hsa05225 | Colorectum | AD | Hepatocellular carcinoma | 59/2092 | 168/8465 | 1.50e-03 | 8.69e-03 | 5.54e-03 | 59 |
| hsa052251 | Colorectum | AD | Hepatocellular carcinoma | 59/2092 | 168/8465 | 1.50e-03 | 8.69e-03 | 5.54e-03 | 59 |
| hsa052252 | Colorectum | MSS | Hepatocellular carcinoma | 56/1875 | 168/8465 | 5.04e-04 | 3.45e-03 | 2.11e-03 | 56 |
| hsa052253 | Colorectum | MSS | Hepatocellular carcinoma | 56/1875 | 168/8465 | 5.04e-04 | 3.45e-03 | 2.11e-03 | 56 |
| hsa052254 | Colorectum | FAP | Hepatocellular carcinoma | 43/1404 | 168/8465 | 1.78e-03 | 8.99e-03 | 5.47e-03 | 43 |
| hsa052255 | Colorectum | FAP | Hepatocellular carcinoma | 43/1404 | 168/8465 | 1.78e-03 | 8.99e-03 | 5.47e-03 | 43 |
| hsa052256 | Colorectum | CRC | Hepatocellular carcinoma | 37/1091 | 168/8465 | 6.38e-04 | 5.89e-03 | 3.99e-03 | 37 |
| hsa052257 | Colorectum | CRC | Hepatocellular carcinoma | 37/1091 | 168/8465 | 6.38e-04 | 5.89e-03 | 3.99e-03 | 37 |
| hsa0522518 | Esophagus | ESCC | Hepatocellular carcinoma | 109/4205 | 168/8465 | 4.27e-05 | 1.88e-04 | 9.64e-05 | 109 |
| hsa0522519 | Esophagus | ESCC | Hepatocellular carcinoma | 109/4205 | 168/8465 | 4.27e-05 | 1.88e-04 | 9.64e-05 | 109 |
| hsa052258 | Liver | HCC | Hepatocellular carcinoma | 106/4020 | 168/8465 | 2.87e-05 | 1.85e-04 | 1.03e-04 | 106 |
| hsa0522511 | Liver | HCC | Hepatocellular carcinoma | 106/4020 | 168/8465 | 2.87e-05 | 1.85e-04 | 1.03e-04 | 106 |
| hsa052259 | Lung | IAC | Hepatocellular carcinoma | 33/1053 | 168/8465 | 4.77e-03 | 2.15e-02 | 1.43e-02 | 33 |
| hsa0522512 | Lung | IAC | Hepatocellular carcinoma | 33/1053 | 168/8465 | 4.77e-03 | 2.15e-02 | 1.43e-02 | 33 |
| hsa0522521 | Lung | AIS | Hepatocellular carcinoma | 31/961 | 168/8465 | 4.11e-03 | 2.15e-02 | 1.38e-02 | 31 |
| hsa0522531 | Lung | AIS | Hepatocellular carcinoma | 31/961 | 168/8465 | 4.11e-03 | 2.15e-02 | 1.38e-02 | 31 |
| hsa0522541 | Lung | MIAC | Hepatocellular carcinoma | 20/507 | 168/8465 | 2.44e-03 | 2.16e-02 | 1.56e-02 | 20 |
| hsa0522551 | Lung | MIAC | Hepatocellular carcinoma | 20/507 | 168/8465 | 2.44e-03 | 2.16e-02 | 1.56e-02 | 20 |
| hsa0522516 | Oral cavity | OSCC | Hepatocellular carcinoma | 97/3704 | 168/8465 | 1.63e-04 | 5.52e-04 | 2.81e-04 | 97 |
| hsa0522517 | Oral cavity | OSCC | Hepatocellular carcinoma | 97/3704 | 168/8465 | 1.63e-04 | 5.52e-04 | 2.81e-04 | 97 |
| Page: 1 2 |
Top |
Cell-cell communication analysis |
| Identification of potential cell-cell interactions between two cell types and their ligand-receptor pairs for different disease states |
| Ligand | Receptor | LRpair | Pathway | Tissue | Disease Stage |
| Page: 1 |
Top |
Single-cell gene regulatory network inference analysis |
| Find out the significant the regulons (TFs) and the target genes of each regulon across cell types for different disease states |
| TF | Cell Type | Tissue | Disease Stage | Target Gene | RSS | Regulon Activity |
| ∗The dot plots of a searched regulon are shown for all cell subpopulations in each disease state of each tissue based on the regulon specific score inferred using pySCENIC and by calculating the average expression. |
| Page: 1 |
Top |
Somatic mutation of malignant transformation related genes |
| Annotation of somatic variants for genes involved in malignant transformation |
| Hugo Symbol | Variant Class | Variant Classification | dbSNP RS | HGVSc | HGVSp | HGVSp Short | SWISSPROT | BIOTYPE | SIFT | PolyPhen | Tumor Sample Barcode | Tissue | Histology | Sex | Age | Stage | Therapy Types | Drugs | Outcome |
| PBRM1 | SNV | Missense_Mutation | c.1758G>A | p.Met586Ile | p.M586I | Q86U86 | protein_coding | tolerated(0.18) | possibly_damaging(0.718) | TCGA-A2-A0D2-01 | Breast | breast invasive carcinoma | Female | <65 | I/II | Chemotherapy | adriamycin | SD | |
| PBRM1 | SNV | Missense_Mutation | c.1182G>C | p.Arg394Ser | p.R394S | Q86U86 | protein_coding | deleterious(0) | probably_damaging(0.987) | TCGA-AR-A0TX-01 | Breast | breast invasive carcinoma | Female | <65 | I/II | Unknown | Unknown | SD | |
| PBRM1 | SNV | Missense_Mutation | c.2908G>C | p.Glu970Gln | p.E970Q | Q86U86 | protein_coding | deleterious(0) | probably_damaging(0.986) | TCGA-BH-A0W7-01 | Breast | breast invasive carcinoma | Female | <65 | I/II | Chemotherapy | taxotere | CR | |
| PBRM1 | SNV | Missense_Mutation | c.4339G>C | p.Gly1447Arg | p.G1447R | Q86U86 | protein_coding | deleterious(0.02) | benign(0.405) | TCGA-D8-A1J9-01 | Breast | breast invasive carcinoma | Female | <65 | I/II | Unknown | Unknown | SD | |
| PBRM1 | SNV | Missense_Mutation | c.4296N>A | p.Met1432Ile | p.M1432I | Q86U86 | protein_coding | tolerated(0.4) | benign(0) | TCGA-E2-A1LG-01 | Breast | breast invasive carcinoma | Female | <65 | I/II | Chemotherapy | doxorubicin | SD | |
| PBRM1 | insertion | Nonsense_Mutation | novel | c.422_423insAACCC | p.Trp141Ter | p.W141* | Q86U86 | protein_coding | TCGA-A2-A0CQ-01 | Breast | breast invasive carcinoma | Female | <65 | I/II | Chemotherapy | adriamycin | SD | ||
| PBRM1 | insertion | Frame_Shift_Ins | novel | c.420_421insGGGAGGCTGAGGCAGGAGAATCGCT | p.Trp141GlyfsTer18 | p.W141Gfs*18 | Q86U86 | protein_coding | TCGA-A2-A0CQ-01 | Breast | breast invasive carcinoma | Female | <65 | I/II | Chemotherapy | adriamycin | SD | ||
| PBRM1 | insertion | Frame_Shift_Ins | novel | c.3486_3487insTTAGGGCACAACCAAACCTTTCACCTCAGCCTTCCAAGTT | p.Ala1163LeufsTer31 | p.A1163Lfs*31 | Q86U86 | protein_coding | TCGA-A7-A0CJ-01 | Breast | breast invasive carcinoma | Female | <65 | I/II | Chemotherapy | cytoxan | SD | ||
| PBRM1 | insertion | Frame_Shift_Ins | novel | c.773dupA | p.Asn258LysfsTer6 | p.N258Kfs*6 | Q86U86 | protein_coding | TCGA-A8-A09Z-01 | Breast | breast invasive carcinoma | Female | >=65 | I/II | Unknown | Unknown | SD | ||
| PBRM1 | insertion | Nonsense_Mutation | novel | c.2011_2012insGCTTATCCACAATCTTTTTGTGTCAGTCATGAGT | p.Asn671SerfsTer11 | p.N671Sfs*11 | Q86U86 | protein_coding | TCGA-AN-A0FZ-01 | Breast | breast invasive carcinoma | Female | <65 | III/IV | Unknown | Unknown | SD |
| Page: 1 2 3 4 5 6 7 8 9 10 11 12 13 14 15 |
Top |
Related drugs of malignant transformation related genes |
| Identification of chemicals and drugs interact with genes involved in malignant transfromation |
| (DGIdb 4.0) |
| Entrez ID | Symbol | Category | Interaction Types | Drug Claim Name | Drug Name | PMIDs |
| 55193 | PBRM1 | CLINICALLY ACTIONABLE | inhibitor | 249565598 | ||
| 55193 | PBRM1 | CLINICALLY ACTIONABLE | ALPRAZOLAM | ALPRAZOLAM | 22137933 | |
| 55193 | PBRM1 | CLINICALLY ACTIONABLE | ATEZOLIZUMAB | ATEZOLIZUMAB | 29301960 | |
| 55193 | PBRM1 | CLINICALLY ACTIONABLE | CTLA-4 INHIBITOR | 29301960 | ||
| 55193 | PBRM1 | CLINICALLY ACTIONABLE | ANTI-PD-L1 MONOCLONAL ANTIBODY | 29301960 | ||
| 55193 | PBRM1 | CLINICALLY ACTIONABLE | NIVOLUMAB | NIVOLUMAB | 29301960,31486842 | |
| 55193 | PBRM1 | CLINICALLY ACTIONABLE | EVEROLIMUS | EVEROLIMUS | 27751729 | |
| 55193 | PBRM1 | CLINICALLY ACTIONABLE | IPILIMUMAB | IPILIMUMAB | 29301960 | |
| 55193 | PBRM1 | CLINICALLY ACTIONABLE | TRIAZOLAM | TRIAZOLAM | 22137933 | |
| 55193 | PBRM1 | CLINICALLY ACTIONABLE | SUNITINIB | SUNITINIB | 27751729 |
| Page: 1 2 |

Copyright 2023-Present -The University of Texas Health Science Center at Houston |