
|
|||||
|
 | |
| |
| |
| |
| |
| |
|
Gene: PAXX |
Gene summary for PAXX |
| Gene information | Species | Human | Gene symbol | PAXX | Gene ID | 286257 |
| Gene name | PAXX non-homologous end joining factor | |
| Gene Alias | C9orf142 | |
| Cytomap | 9q34.3 | |
| Gene Type | protein-coding | GO ID | GO:0006139 | UniProtAcc | Q9BUH6 |
Top |
Malignant transformation analysis |
| Identification of the aberrant gene expression in precancerous and cancerous lesions by comparing the gene expression of stem-like cells in diseased tissues with normal stem cells |
| Entrez ID | Symbol | Replicates | Species | Organ | Tissue | Adj P-value | Log2FC | Malignancy |
| 286257 | PAXX | AEH-subject1 | Human | Endometrium | AEH | 2.47e-26 | 4.33e-01 | -0.3059 |
| 286257 | PAXX | AEH-subject2 | Human | Endometrium | AEH | 3.79e-17 | 3.76e-01 | -0.2525 |
| 286257 | PAXX | AEH-subject3 | Human | Endometrium | AEH | 1.31e-19 | 4.05e-01 | -0.2576 |
| 286257 | PAXX | AEH-subject4 | Human | Endometrium | AEH | 6.21e-07 | 2.26e-01 | -0.2657 |
| 286257 | PAXX | AEH-subject5 | Human | Endometrium | AEH | 8.49e-10 | 2.02e-01 | -0.2953 |
| 286257 | PAXX | EEC-subject1 | Human | Endometrium | EEC | 1.78e-10 | 2.82e-01 | -0.2682 |
| 286257 | PAXX | EEC-subject2 | Human | Endometrium | EEC | 4.96e-33 | 5.90e-01 | -0.2607 |
| 286257 | PAXX | EEC-subject4 | Human | Endometrium | EEC | 4.50e-21 | 4.16e-01 | -0.2571 |
| 286257 | PAXX | EEC-subject5 | Human | Endometrium | EEC | 8.21e-22 | 3.84e-01 | -0.249 |
| 286257 | PAXX | GSM5276934 | Human | Endometrium | EEC | 7.40e-03 | 1.07e-01 | -0.0913 |
| 286257 | PAXX | GSM5276935 | Human | Endometrium | EEC | 2.82e-42 | 5.54e-01 | -0.123 |
| 286257 | PAXX | GSM5276937 | Human | Endometrium | EEC | 4.74e-09 | 2.14e-01 | -0.0897 |
| 286257 | PAXX | GSM6177620_NYU_UCEC1_lib3_lib3 | Human | Endometrium | EEC | 8.95e-03 | 2.09e-01 | -0.1883 |
| 286257 | PAXX | GSM6177623_NYU_UCEC3_Vis | Human | Endometrium | EEC | 4.51e-35 | 6.85e-01 | -0.1269 |
| 286257 | PAXX | LZE2T | Human | Esophagus | ESCC | 1.80e-11 | 7.78e-01 | 0.082 |
| 286257 | PAXX | LZE3D | Human | Esophagus | HGIN | 3.66e-03 | 7.66e-01 | 0.0668 |
| 286257 | PAXX | LZE4T | Human | Esophagus | ESCC | 4.82e-28 | 6.74e-01 | 0.0811 |
| 286257 | PAXX | LZE5T | Human | Esophagus | ESCC | 1.40e-06 | 4.15e-01 | 0.0514 |
| 286257 | PAXX | LZE7T | Human | Esophagus | ESCC | 1.18e-25 | 8.80e-01 | 0.0667 |
| 286257 | PAXX | LZE8T | Human | Esophagus | ESCC | 8.94e-21 | 6.10e-01 | 0.067 |
| Page: 1 2 3 4 |
| Tissue | Expression Dynamics | Abbreviation |
| Endometrium | 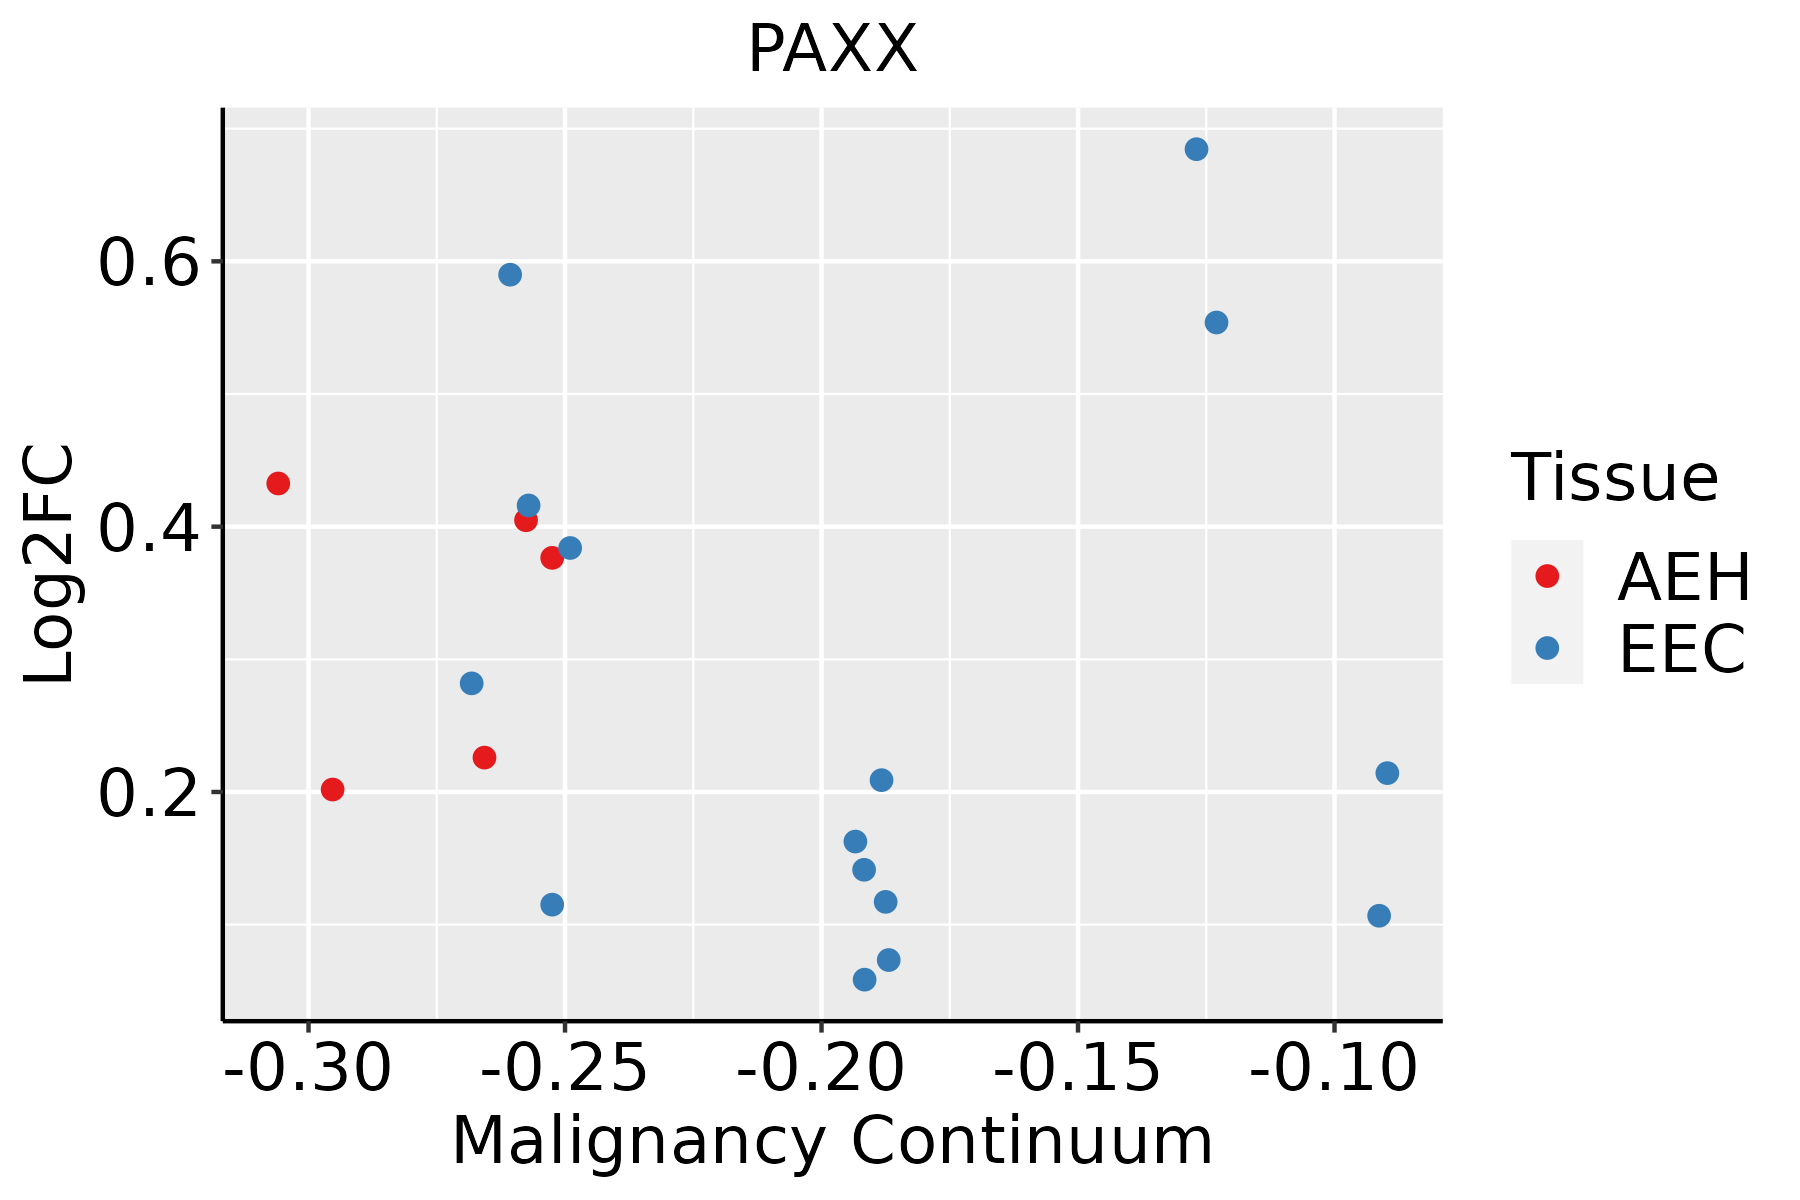 | AEH: Atypical endometrial hyperplasia |
| EEC: Endometrioid Cancer | ||
| Esophagus |  | ESCC: Esophageal squamous cell carcinoma |
| HGIN: High-grade intraepithelial neoplasias | ||
| LGIN: Low-grade intraepithelial neoplasias | ||
| GC | 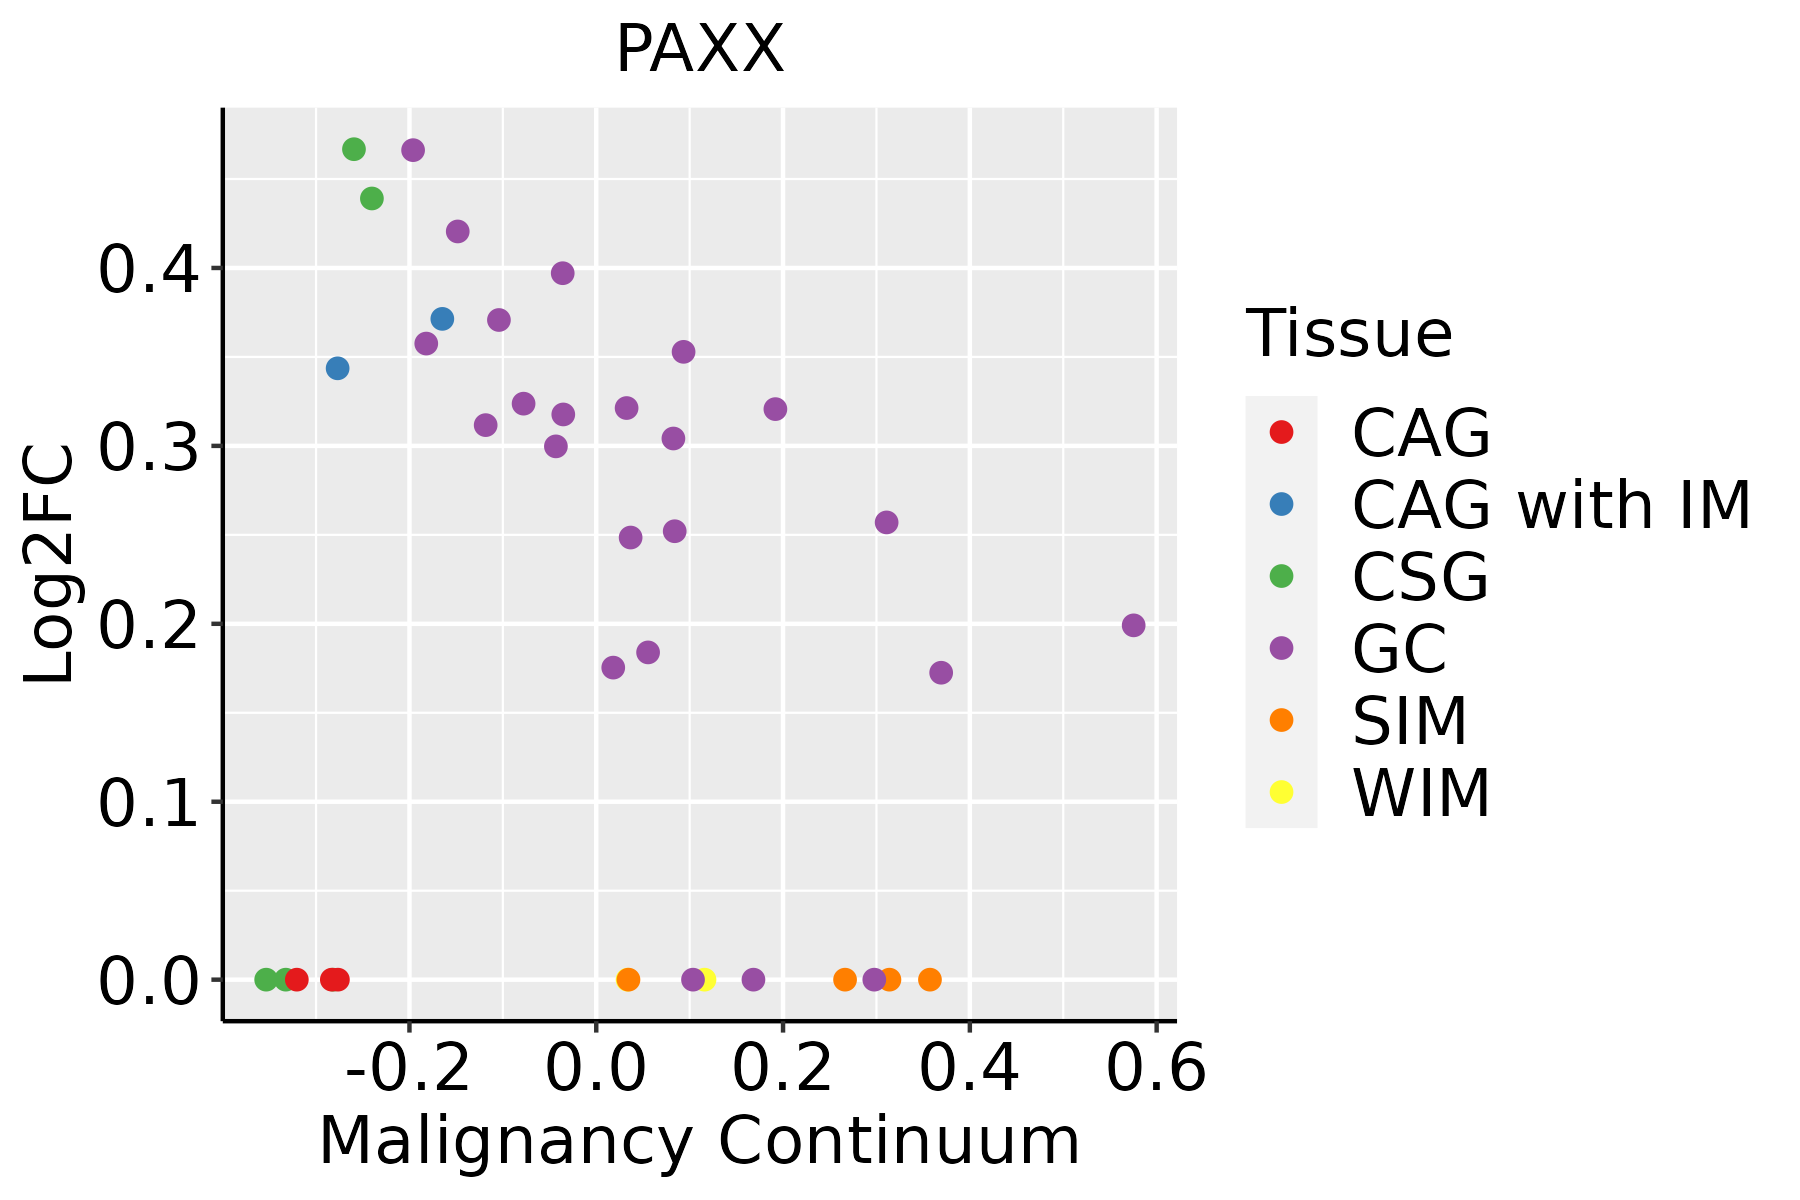 | CAG: Chronic atrophic gastritis |
| CAG with IM: Chronic atrophic gastritis with intestinal metaplasia | ||
| CSG: Chronic superficial gastritis | ||
| GC: Gastric cancer | ||
| SIM: Severe intestinal metaplasia | ||
| WIM: Wild intestinal metaplasia | ||
| Liver | 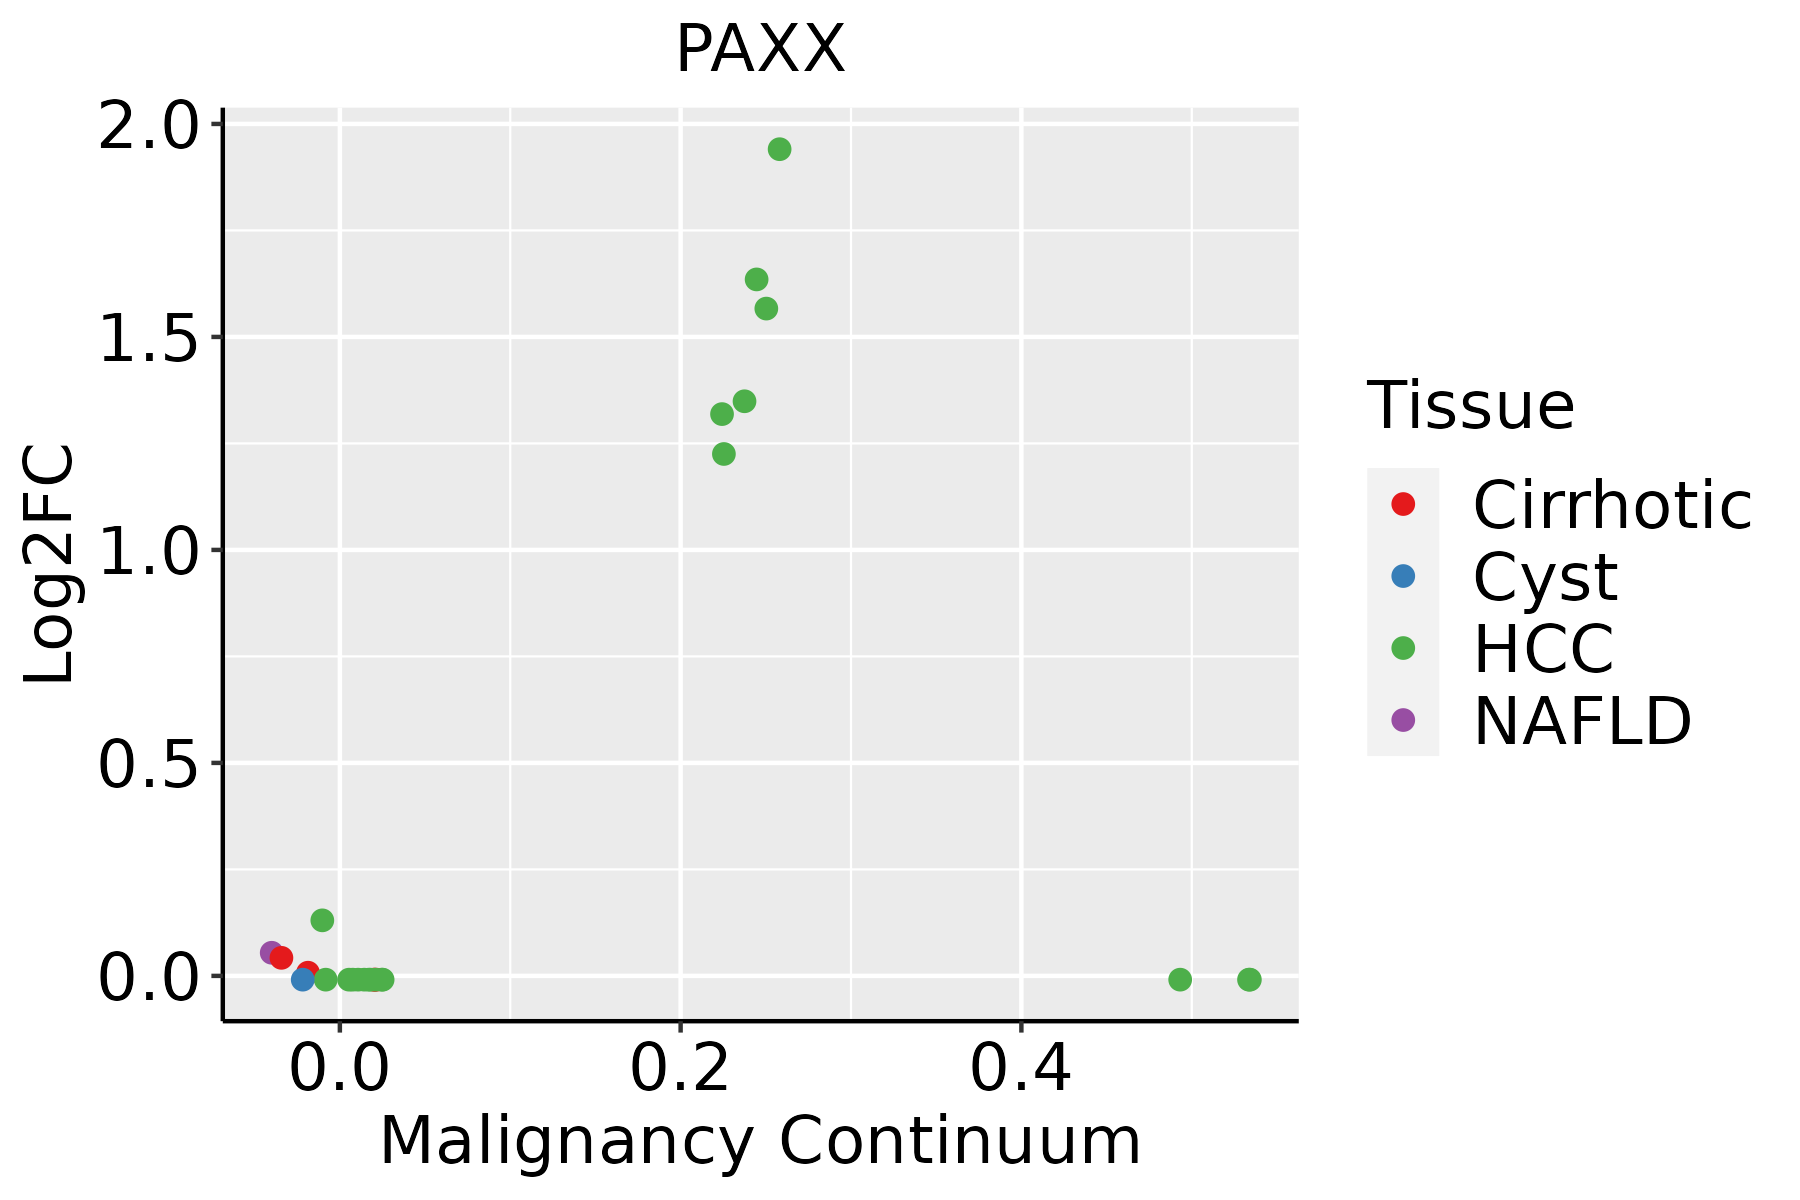 | HCC: Hepatocellular carcinoma |
| NAFLD: Non-alcoholic fatty liver disease | ||
| Thyroid | 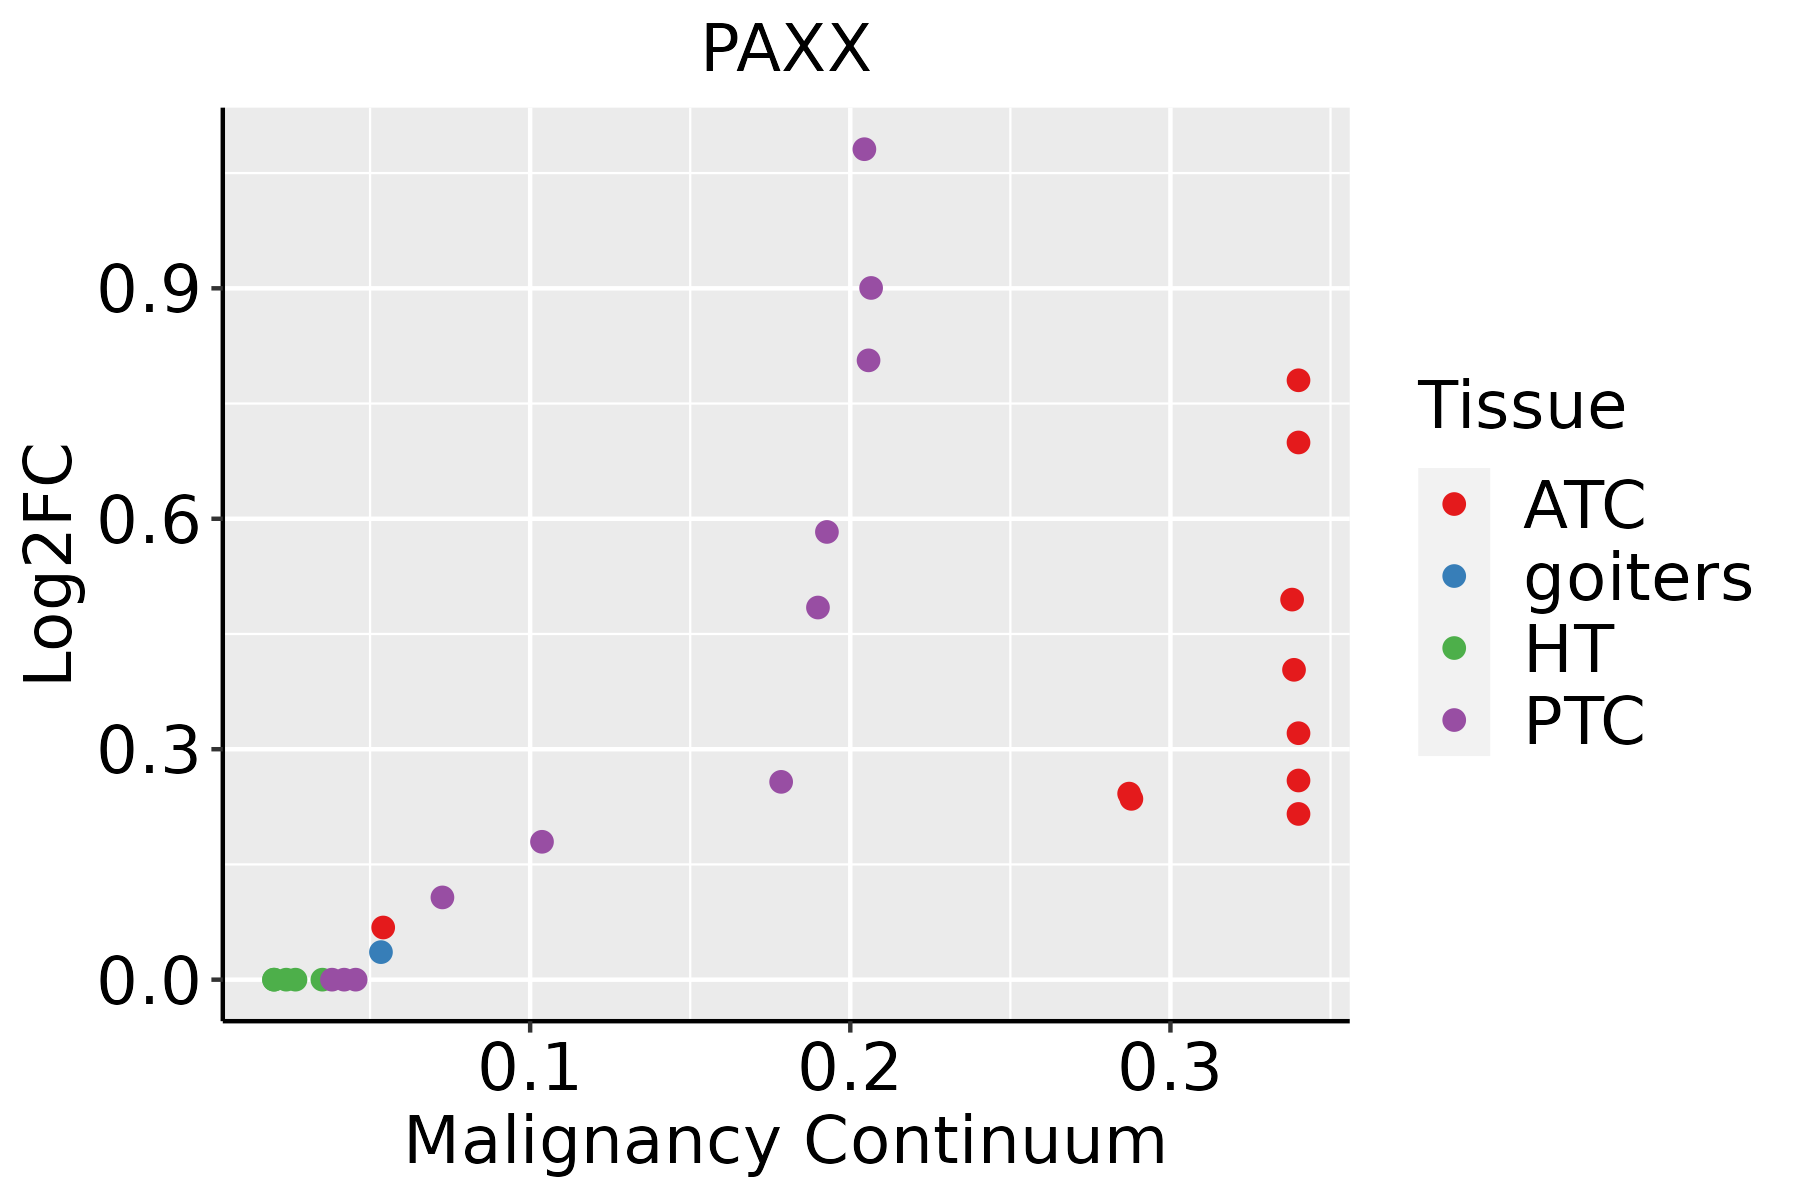 | ATC: Anaplastic thyroid cancer |
| HT: Hashimoto's thyroiditis | ||
| PTC: Papillary thyroid cancer |
| ∗log2FC in expression of this searched gene in stem-like cells from each diseased tissue sample relative to stem-like cells in normal samples in each tissue plotted against the malignancy continuum. Samples are colored based on if they are from different disease stage. |
Top |
Malignant transformation related pathway analysis |
| Find out the enriched GO biological processes and KEGG pathways involved in transition from healthy to precancer to cancer |
| Tissue | Disease Stage | Enriched GO biological Processes |
| Colorectum | AD |  |
| Colorectum | SER |  |
| Colorectum | MSS |  |
| Colorectum | MSI-H |  |
| Colorectum | FAP |  |
| ∗Top 15 enriched GO BP terms are showed in the bar plot of each disease state in each tissue. Each row represents a significant GO biological process which is colored according to the -log10(p.adjust). |
| Page: 1 2 3 4 5 6 7 8 9 |
| GO ID | Tissue | Disease Stage | Description | Gene Ratio | Bg Ratio | pvalue | p.adjust | Count |
| GO:00063024 | Esophagus | ESCC | double-strand break repair | 152/8552 | 251/18723 | 1.33e-06 | 1.62e-05 | 152 |
| GO:0006303 | Esophagus | ESCC | double-strand break repair via nonhomologous end joining | 43/8552 | 66/18723 | 1.10e-03 | 5.53e-03 | 43 |
| GO:00063021 | Liver | HCC | double-strand break repair | 131/7958 | 251/18723 | 1.17e-03 | 6.54e-03 | 131 |
| GO:00063026 | Thyroid | PTC | double-strand break repair | 103/5968 | 251/18723 | 1.30e-03 | 7.40e-03 | 103 |
| GO:00063032 | Thyroid | PTC | double-strand break repair via nonhomologous end joining | 32/5968 | 66/18723 | 3.55e-03 | 1.71e-02 | 32 |
| GO:000630212 | Thyroid | ATC | double-strand break repair | 110/6293 | 251/18723 | 4.48e-04 | 2.65e-03 | 110 |
| GO:00063031 | Thyroid | ATC | double-strand break repair via nonhomologous end joining | 33/6293 | 66/18723 | 4.27e-03 | 1.80e-02 | 33 |
| Page: 1 |
| Pathway ID | Tissue | Disease Stage | Description | Gene Ratio | Bg Ratio | pvalue | p.adjust | qvalue | Count |
| Page: 1 |
Top |
Cell-cell communication analysis |
| Identification of potential cell-cell interactions between two cell types and their ligand-receptor pairs for different disease states |
| Ligand | Receptor | LRpair | Pathway | Tissue | Disease Stage |
| Page: 1 |
Top |
Single-cell gene regulatory network inference analysis |
| Find out the significant the regulons (TFs) and the target genes of each regulon across cell types for different disease states |
| TF | Cell Type | Tissue | Disease Stage | Target Gene | RSS | Regulon Activity |
| ∗The dot plots of a searched regulon are shown for all cell subpopulations in each disease state of each tissue based on the regulon specific score inferred using pySCENIC and by calculating the average expression. |
| Page: 1 |
Top |
Somatic mutation of malignant transformation related genes |
| Annotation of somatic variants for genes involved in malignant transformation |
| Hugo Symbol | Variant Class | Variant Classification | dbSNP RS | HGVSc | HGVSp | HGVSp Short | SWISSPROT | BIOTYPE | SIFT | PolyPhen | Tumor Sample Barcode | Tissue | Histology | Sex | Age | Stage | Therapy Types | Drugs | Outcome |
| Page: 1 |
Top |
Related drugs of malignant transformation related genes |
| Identification of chemicals and drugs interact with genes involved in malignant transfromation |
| (DGIdb 4.0) |
| Entrez ID | Symbol | Category | Interaction Types | Drug Claim Name | Drug Name | PMIDs |
| Page: 1 |

Copyright 2023-Present -The University of Texas Health Science Center at Houston |