
|
|||||
|
 | |
| |
| |
| |
| |
| |
|
Gene: PAXBP1 |
Gene summary for PAXBP1 |
| Gene information | Species | Human | Gene symbol | PAXBP1 | Gene ID | 94104 |
| Gene name | PAX3 and PAX7 binding protein 1 | |
| Gene Alias | BM020 | |
| Cytomap | 21q22.11 | |
| Gene Type | protein-coding | GO ID | GO:0000375 | UniProtAcc | Q8N6E6 |
Top |
Malignant transformation analysis |
| Identification of the aberrant gene expression in precancerous and cancerous lesions by comparing the gene expression of stem-like cells in diseased tissues with normal stem cells |
| Entrez ID | Symbol | Replicates | Species | Organ | Tissue | Adj P-value | Log2FC | Malignancy |
| 94104 | PAXBP1 | CA_HPV_1 | Human | Cervix | CC | 4.74e-03 | -5.24e-02 | 0.0264 |
| 94104 | PAXBP1 | CCI_2 | Human | Cervix | CC | 8.92e-04 | 6.28e-01 | 0.5249 |
| 94104 | PAXBP1 | CCI_3 | Human | Cervix | CC | 4.78e-06 | 6.21e-01 | 0.516 |
| 94104 | PAXBP1 | HTA11_3410_2000001011 | Human | Colorectum | AD | 2.02e-15 | -6.08e-01 | 0.0155 |
| 94104 | PAXBP1 | HTA11_2487_2000001011 | Human | Colorectum | SER | 6.71e-05 | -5.51e-01 | -0.1808 |
| 94104 | PAXBP1 | HTA11_78_2000001011 | Human | Colorectum | AD | 2.19e-02 | -4.08e-01 | -0.1088 |
| 94104 | PAXBP1 | HTA11_347_2000001011 | Human | Colorectum | AD | 1.25e-02 | -3.44e-01 | -0.1954 |
| 94104 | PAXBP1 | HTA11_3361_2000001011 | Human | Colorectum | AD | 2.55e-07 | -6.56e-01 | -0.1207 |
| 94104 | PAXBP1 | HTA11_696_2000001011 | Human | Colorectum | AD | 9.73e-23 | -5.96e-01 | -0.1464 |
| 94104 | PAXBP1 | HTA11_866_2000001011 | Human | Colorectum | AD | 3.30e-14 | -5.22e-01 | -0.1001 |
| 94104 | PAXBP1 | HTA11_1391_2000001011 | Human | Colorectum | AD | 3.52e-05 | -4.52e-01 | -0.059 |
| 94104 | PAXBP1 | HTA11_2992_2000001011 | Human | Colorectum | SER | 4.38e-03 | -7.10e-01 | -0.1706 |
| 94104 | PAXBP1 | HTA11_5212_2000001011 | Human | Colorectum | AD | 1.35e-02 | -6.67e-01 | -0.2061 |
| 94104 | PAXBP1 | HTA11_866_3004761011 | Human | Colorectum | AD | 1.60e-11 | -6.18e-01 | 0.096 |
| 94104 | PAXBP1 | HTA11_8622_2000001021 | Human | Colorectum | SER | 9.42e-04 | -6.95e-01 | 0.0528 |
| 94104 | PAXBP1 | HTA11_10711_2000001011 | Human | Colorectum | AD | 2.99e-08 | -6.12e-01 | 0.0338 |
| 94104 | PAXBP1 | HTA11_7696_3000711011 | Human | Colorectum | AD | 9.28e-13 | -5.01e-01 | 0.0674 |
| 94104 | PAXBP1 | HTA11_6818_2000001011 | Human | Colorectum | AD | 8.36e-04 | -6.62e-01 | 0.0112 |
| 94104 | PAXBP1 | HTA11_11156_2000001011 | Human | Colorectum | AD | 2.53e-02 | -7.66e-01 | 0.0397 |
| 94104 | PAXBP1 | HTA11_99999971662_82457 | Human | Colorectum | MSS | 2.89e-05 | -3.39e-01 | 0.3859 |
| Page: 1 2 3 4 5 6 |
| Tissue | Expression Dynamics | Abbreviation |
| Cervix | 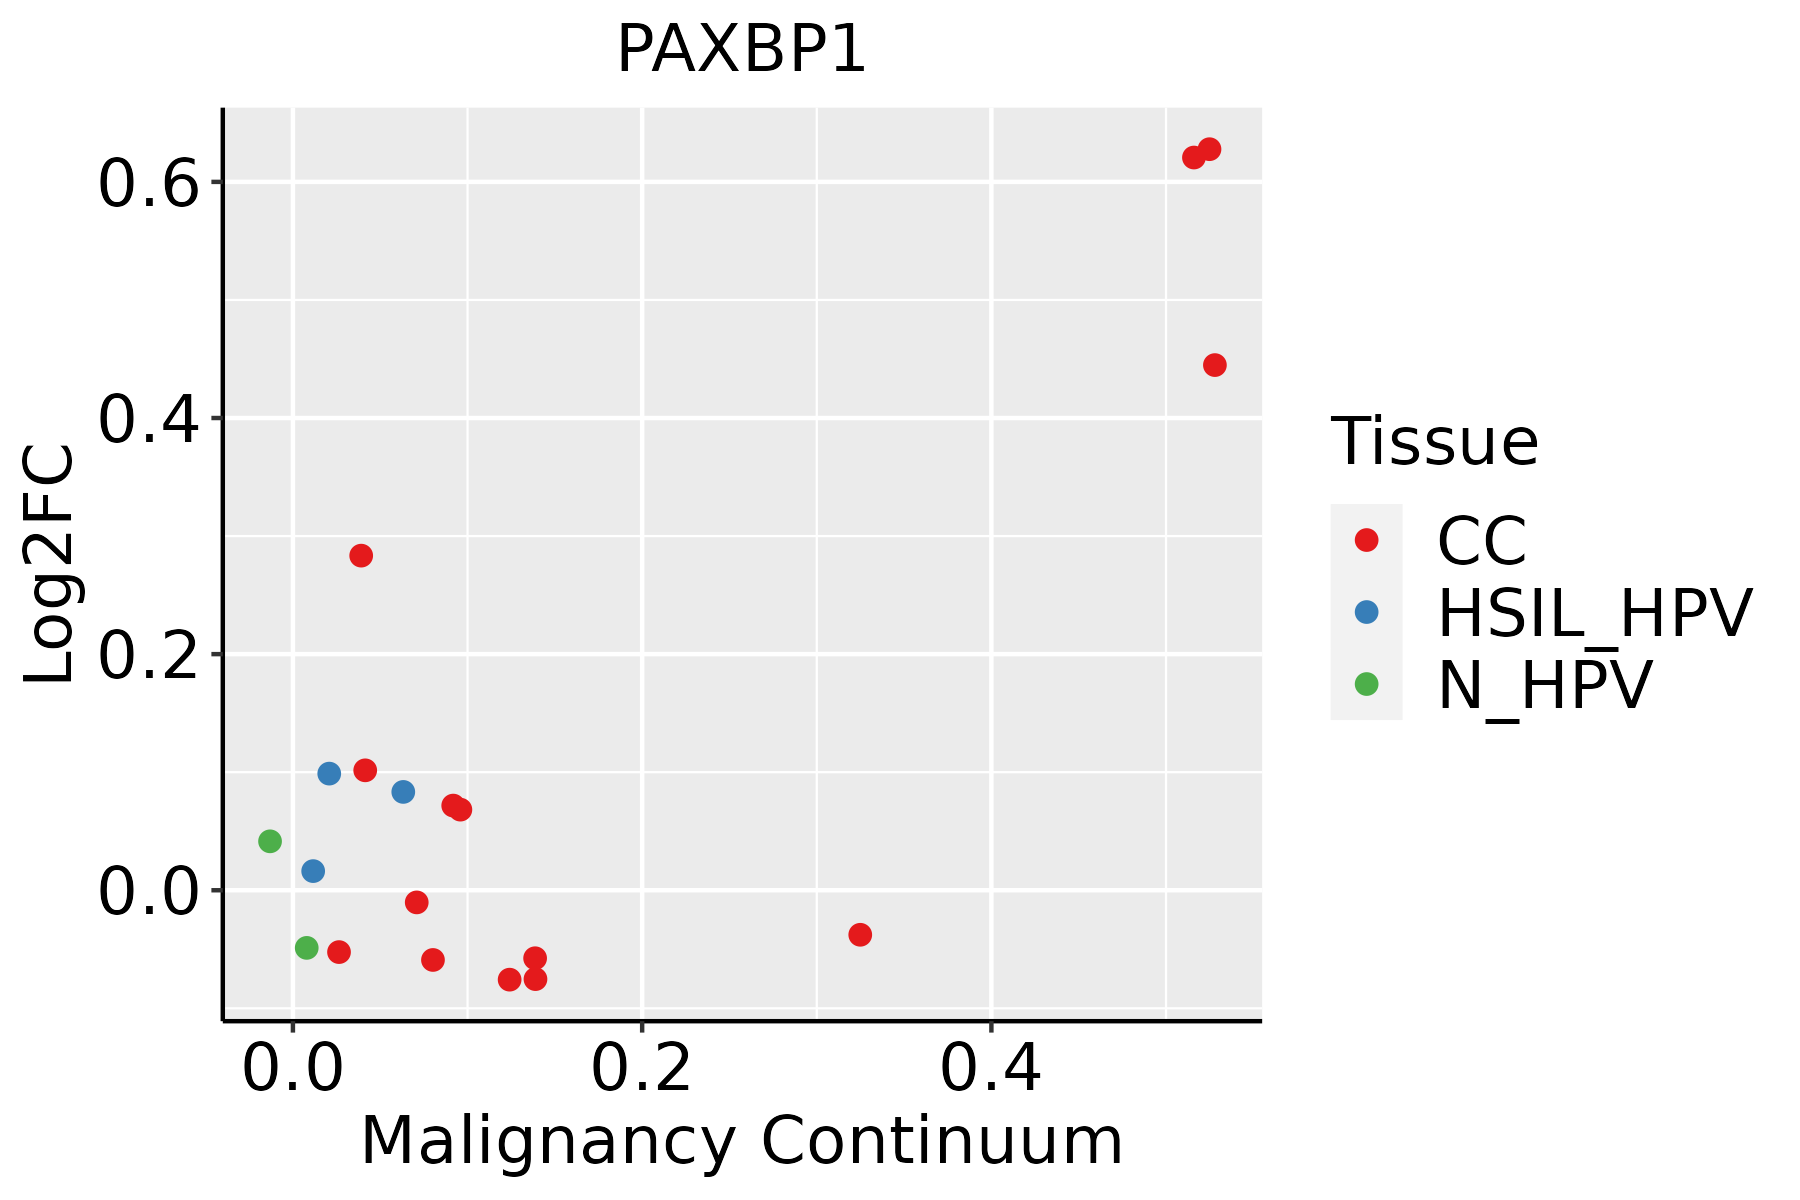 | CC: Cervix cancer |
| HSIL_HPV: HPV-infected high-grade squamous intraepithelial lesions | ||
| N_HPV: HPV-infected normal cervix | ||
| Colorectum (GSE201348) |  | FAP: Familial adenomatous polyposis |
| CRC: Colorectal cancer | ||
| Colorectum (HTA11) |  | AD: Adenomas |
| SER: Sessile serrated lesions | ||
| MSI-H: Microsatellite-high colorectal cancer | ||
| MSS: Microsatellite stable colorectal cancer | ||
| Esophagus | 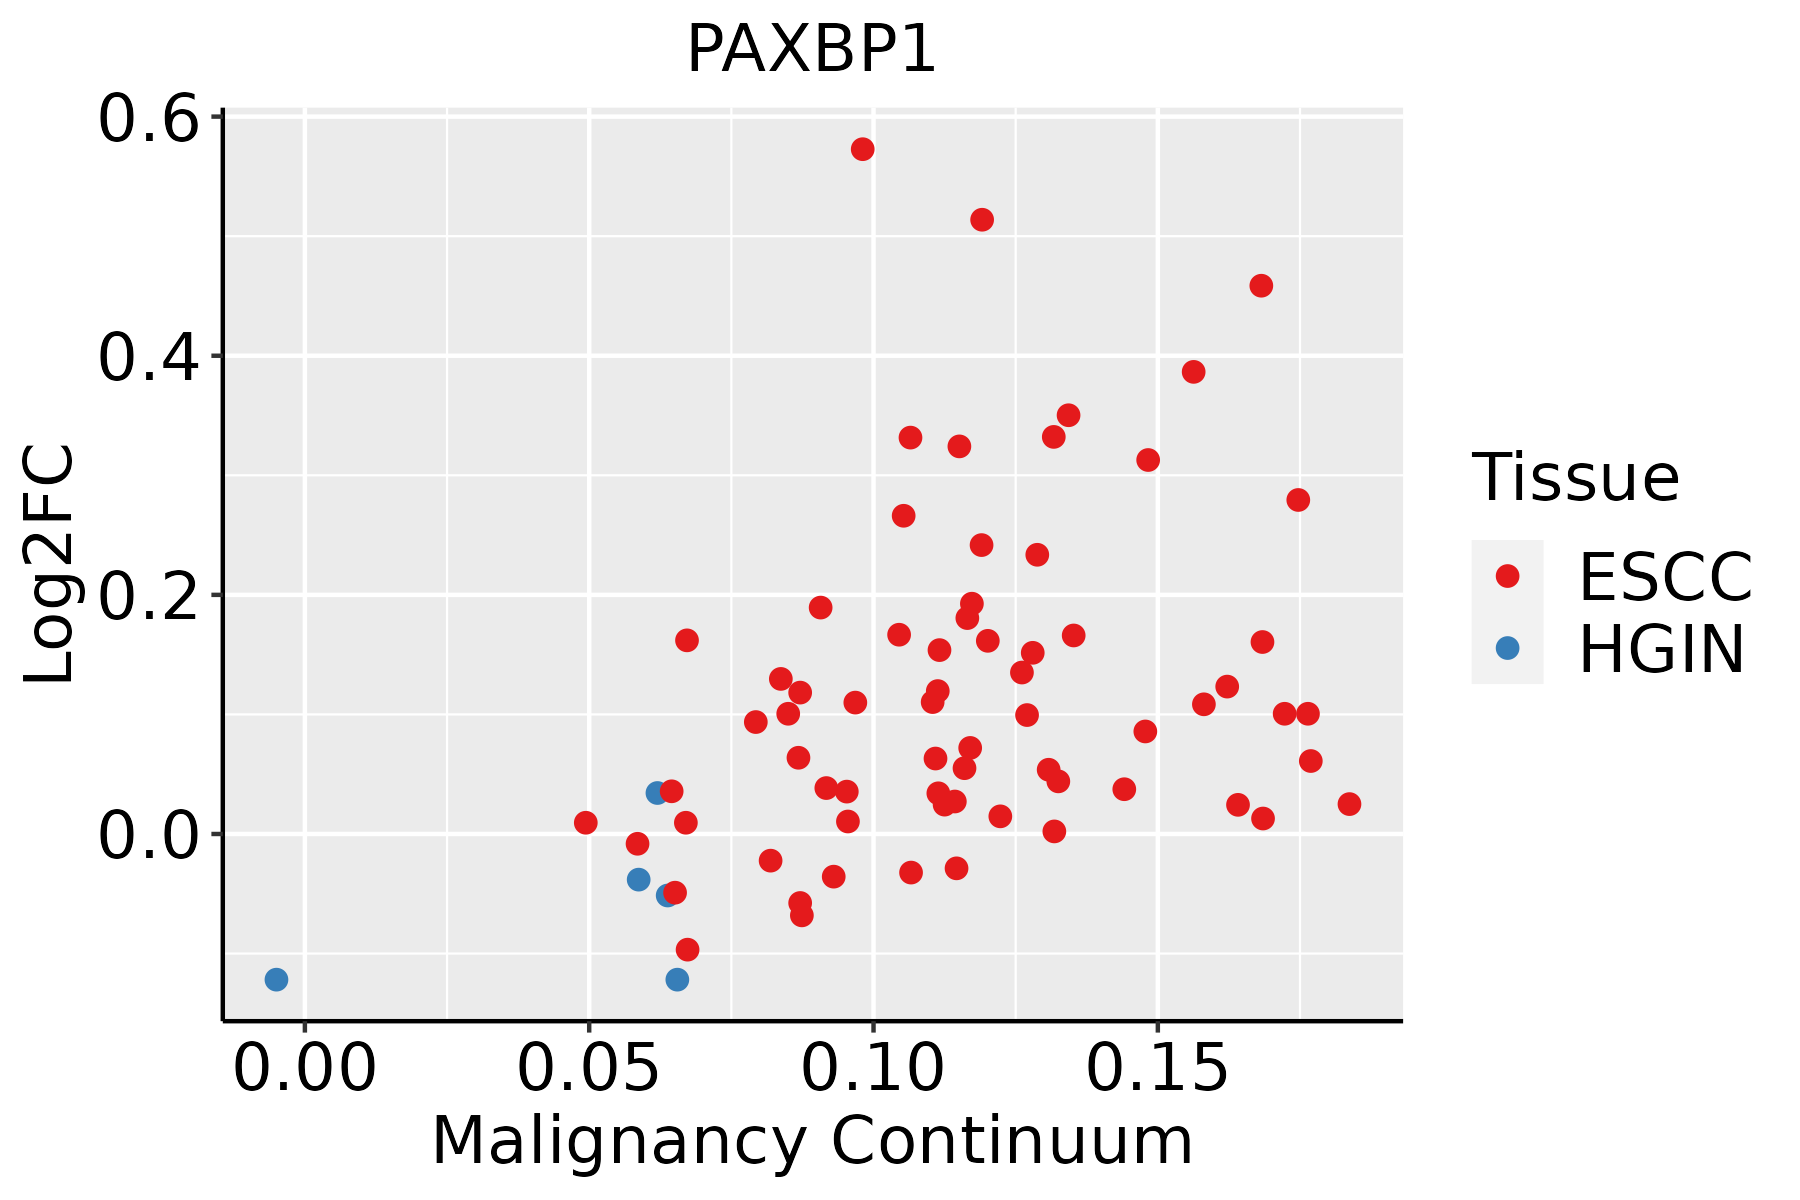 | ESCC: Esophageal squamous cell carcinoma |
| HGIN: High-grade intraepithelial neoplasias | ||
| LGIN: Low-grade intraepithelial neoplasias | ||
| Liver |  | HCC: Hepatocellular carcinoma |
| NAFLD: Non-alcoholic fatty liver disease | ||
| Thyroid | 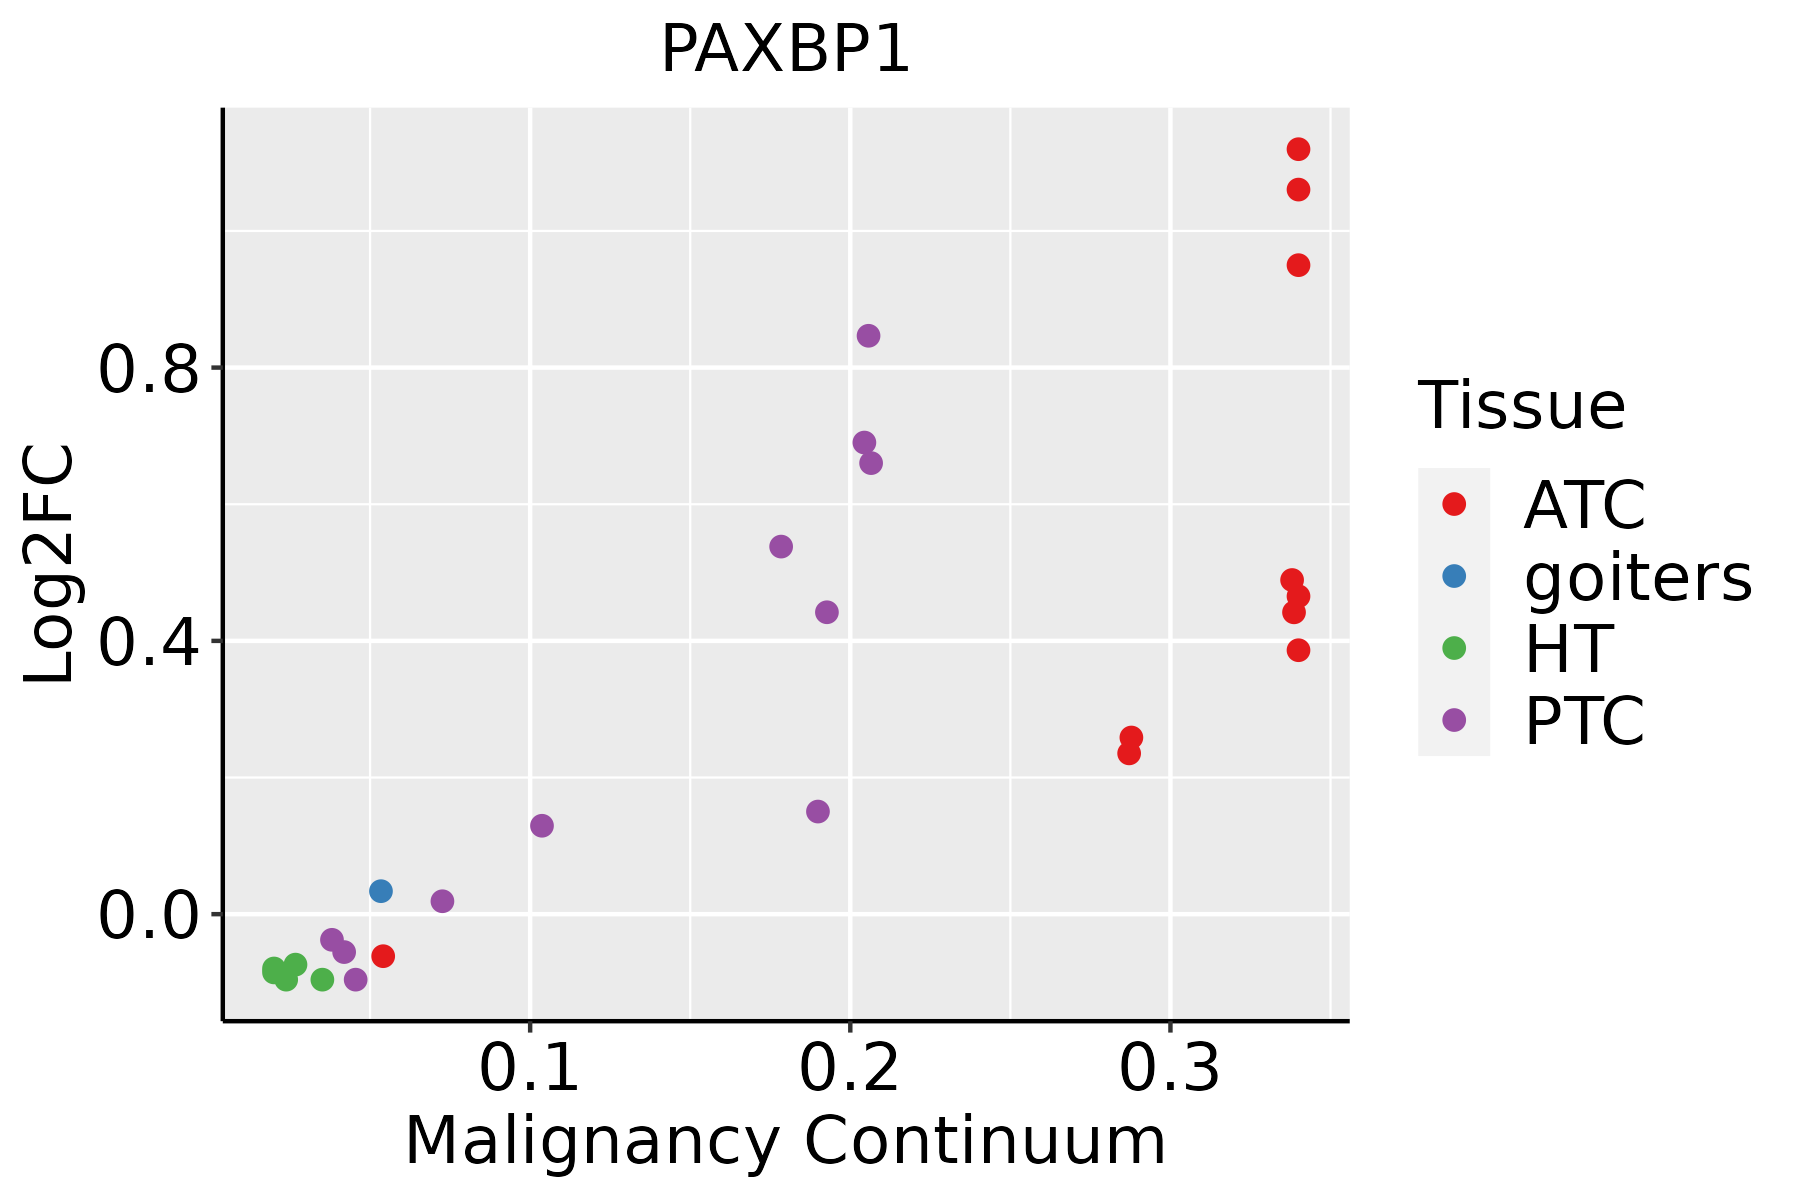 | ATC: Anaplastic thyroid cancer |
| HT: Hashimoto's thyroiditis | ||
| PTC: Papillary thyroid cancer |
| ∗log2FC in expression of this searched gene in stem-like cells from each diseased tissue sample relative to stem-like cells in normal samples in each tissue plotted against the malignancy continuum. Samples are colored based on if they are from different disease stage. |
Top |
Malignant transformation related pathway analysis |
| Find out the enriched GO biological processes and KEGG pathways involved in transition from healthy to precancer to cancer |
| Tissue | Disease Stage | Enriched GO biological Processes |
| Colorectum | AD |  |
| Colorectum | SER |  |
| Colorectum | MSS |  |
| Colorectum | MSI-H |  |
| Colorectum | FAP |  |
| ∗Top 15 enriched GO BP terms are showed in the bar plot of each disease state in each tissue. Each row represents a significant GO biological process which is colored according to the -log10(p.adjust). |
| Page: 1 2 3 4 5 6 7 8 9 |
| GO ID | Tissue | Disease Stage | Description | Gene Ratio | Bg Ratio | pvalue | p.adjust | Count |
| GO:00165705 | Cervix | CC | histone modification | 84/2311 | 463/18723 | 1.70e-04 | 2.01e-03 | 84 |
| GO:0033002 | Cervix | CC | muscle cell proliferation | 49/2311 | 248/18723 | 5.43e-04 | 5.24e-03 | 49 |
| GO:00310565 | Cervix | CC | regulation of histone modification | 33/2311 | 152/18723 | 7.97e-04 | 7.00e-03 | 33 |
| GO:000838010 | Cervix | CC | RNA splicing | 76/2311 | 434/18723 | 9.79e-04 | 8.19e-03 | 76 |
| GO:00165715 | Cervix | CC | histone methylation | 30/2311 | 141/18723 | 1.88e-03 | 1.39e-02 | 30 |
| GO:00064795 | Cervix | CC | protein methylation | 36/2311 | 181/18723 | 2.46e-03 | 1.71e-02 | 36 |
| GO:00082135 | Cervix | CC | protein alkylation | 36/2311 | 181/18723 | 2.46e-03 | 1.71e-02 | 36 |
| GO:00075173 | Cervix | CC | muscle organ development | 58/2311 | 327/18723 | 2.73e-03 | 1.85e-02 | 58 |
| GO:0014855 | Cervix | CC | striated muscle cell proliferation | 18/2311 | 76/18723 | 4.45e-03 | 2.71e-02 | 18 |
| GO:000037710 | Cervix | CC | RNA splicing, via transesterification reactions with bulged adenosine as nucleophile | 55/2311 | 320/18723 | 6.71e-03 | 3.70e-02 | 55 |
| GO:000039810 | Cervix | CC | mRNA splicing, via spliceosome | 55/2311 | 320/18723 | 6.71e-03 | 3.70e-02 | 55 |
| GO:000037510 | Cervix | CC | RNA splicing, via transesterification reactions | 55/2311 | 324/18723 | 8.61e-03 | 4.44e-02 | 55 |
| GO:0008380 | Colorectum | AD | RNA splicing | 169/3918 | 434/18723 | 3.59e-18 | 2.04e-15 | 169 |
| GO:0000377 | Colorectum | AD | RNA splicing, via transesterification reactions with bulged adenosine as nucleophile | 130/3918 | 320/18723 | 5.88e-16 | 2.16e-13 | 130 |
| GO:0000398 | Colorectum | AD | mRNA splicing, via spliceosome | 130/3918 | 320/18723 | 5.88e-16 | 2.16e-13 | 130 |
| GO:0000375 | Colorectum | AD | RNA splicing, via transesterification reactions | 131/3918 | 324/18723 | 7.11e-16 | 2.22e-13 | 131 |
| GO:0031056 | Colorectum | AD | regulation of histone modification | 45/3918 | 152/18723 | 7.05e-03 | 4.31e-02 | 45 |
| GO:00083801 | Colorectum | SER | RNA splicing | 123/2897 | 434/18723 | 3.84e-12 | 8.41e-10 | 123 |
| GO:00003751 | Colorectum | SER | RNA splicing, via transesterification reactions | 90/2897 | 324/18723 | 8.68e-09 | 7.50e-07 | 90 |
| GO:00003771 | Colorectum | SER | RNA splicing, via transesterification reactions with bulged adenosine as nucleophile | 89/2897 | 320/18723 | 9.82e-09 | 8.14e-07 | 89 |
| Page: 1 2 3 4 5 6 |
| Pathway ID | Tissue | Disease Stage | Description | Gene Ratio | Bg Ratio | pvalue | p.adjust | qvalue | Count |
| Page: 1 |
Top |
Cell-cell communication analysis |
| Identification of potential cell-cell interactions between two cell types and their ligand-receptor pairs for different disease states |
| Ligand | Receptor | LRpair | Pathway | Tissue | Disease Stage |
| Page: 1 |
Top |
Single-cell gene regulatory network inference analysis |
| Find out the significant the regulons (TFs) and the target genes of each regulon across cell types for different disease states |
| TF | Cell Type | Tissue | Disease Stage | Target Gene | RSS | Regulon Activity |
| ∗The dot plots of a searched regulon are shown for all cell subpopulations in each disease state of each tissue based on the regulon specific score inferred using pySCENIC and by calculating the average expression. |
| Page: 1 |
Top |
Somatic mutation of malignant transformation related genes |
| Annotation of somatic variants for genes involved in malignant transformation |
| Hugo Symbol | Variant Class | Variant Classification | dbSNP RS | HGVSc | HGVSp | HGVSp Short | SWISSPROT | BIOTYPE | SIFT | PolyPhen | Tumor Sample Barcode | Tissue | Histology | Sex | Age | Stage | Therapy Types | Drugs | Outcome |
| PAXBP1 | SNV | Missense_Mutation | c.1675N>A | p.Asp559Asn | p.D559N | Q9Y5B6 | protein_coding | deleterious(0) | probably_damaging(0.999) | TCGA-D8-A27G-01 | Breast | breast invasive carcinoma | Female | >=65 | I/II | Unknown | Unknown | SD | |
| PAXBP1 | SNV | Missense_Mutation | novel | c.650N>T | p.Gly217Val | p.G217V | Q9Y5B6 | protein_coding | deleterious(0) | probably_damaging(0.989) | TCGA-E2-A573-01 | Breast | breast invasive carcinoma | Female | <65 | I/II | Chemotherapy | taxotere | CR |
| PAXBP1 | SNV | Missense_Mutation | c.2126N>C | p.Gly709Ala | p.G709A | Q9Y5B6 | protein_coding | tolerated(1) | benign(0) | TCGA-E9-A22E-01 | Breast | breast invasive carcinoma | Female | <65 | III/IV | Chemotherapy | cyclophosphane | SD | |
| PAXBP1 | SNV | Missense_Mutation | c.877G>C | p.Glu293Gln | p.E293Q | Q9Y5B6 | protein_coding | tolerated(0.1) | possibly_damaging(0.71) | TCGA-GM-A2D9-01 | Breast | breast invasive carcinoma | Female | >=65 | I/II | Hormone Therapy | arimidex | SD | |
| PAXBP1 | SNV | Missense_Mutation | novel | c.1085N>T | p.Ser362Leu | p.S362L | Q9Y5B6 | protein_coding | tolerated(0.34) | benign(0.073) | TCGA-LL-A5YP-01 | Breast | breast invasive carcinoma | Female | <65 | I/II | Chemotherapy | cytoxan | SD |
| PAXBP1 | deletion | Frame_Shift_Del | c.762_786delNNNNNNNNNNNNNNNNNNNNNNNNN | p.Arg255MetfsTer11 | p.R255Mfs*11 | Q9Y5B6 | protein_coding | TCGA-A8-A06U-01 | Breast | breast invasive carcinoma | Female | >=65 | I/II | Unknown | Unknown | SD | |||
| PAXBP1 | deletion | Frame_Shift_Del | c.1885delN | p.Leu629SerfsTer43 | p.L629Sfs*43 | Q9Y5B6 | protein_coding | TCGA-AN-A0AK-01 | Breast | breast invasive carcinoma | Female | >=65 | I/II | Unknown | Unknown | SD | |||
| PAXBP1 | insertion | Nonsense_Mutation | novel | c.754_755insATGCGTAAATTCATAT | p.Arg252HisfsTer3 | p.R252Hfs*3 | Q9Y5B6 | protein_coding | TCGA-BH-A0HF-01 | Breast | breast invasive carcinoma | Female | >=65 | I/II | Hormone Therapy | arimidex | SD | ||
| PAXBP1 | deletion | In_Frame_Del | c.840_851delNNNNNNNNNNNN | p.Ser281_Gln284del | p.S281_Q284del | Q9Y5B6 | protein_coding | TCGA-D8-A1XQ-01 | Breast | breast invasive carcinoma | Female | >=65 | I/II | Unknown | Unknown | SD | |||
| PAXBP1 | SNV | Missense_Mutation | novel | c.1594N>T | p.Arg532Trp | p.R532W | Q9Y5B6 | protein_coding | deleterious(0) | probably_damaging(0.999) | TCGA-2W-A8YY-01 | Cervix | cervical & endocervical cancer | Female | <65 | I/II | Chemotherapy | cisplatin | CR |
| Page: 1 2 3 4 5 6 7 8 9 10 |
Top |
Related drugs of malignant transformation related genes |
| Identification of chemicals and drugs interact with genes involved in malignant transfromation |
| (DGIdb 4.0) |
| Entrez ID | Symbol | Category | Interaction Types | Drug Claim Name | Drug Name | PMIDs |
| Page: 1 |

Copyright 2023-Present -The University of Texas Health Science Center at Houston |