
|
|||||
|
 | |
| |
| |
| |
| |
| |
|
Gene: PAX9 |
Gene summary for PAX9 |
| Gene information | Species | Human | Gene symbol | PAX9 | Gene ID | 5083 |
| Gene name | paired box 9 | |
| Gene Alias | STHAG3 | |
| Cytomap | 14q13.3 | |
| Gene Type | protein-coding | GO ID | GO:0006139 | UniProtAcc | P55771 |
Top |
Malignant transformation analysis |
| Identification of the aberrant gene expression in precancerous and cancerous lesions by comparing the gene expression of stem-like cells in diseased tissues with normal stem cells |
| Entrez ID | Symbol | Replicates | Species | Organ | Tissue | Adj P-value | Log2FC | Malignancy |
| 5083 | PAX9 | LZE4T | Human | Esophagus | ESCC | 3.64e-09 | 3.67e-01 | 0.0811 |
| 5083 | PAX9 | LZE5T | Human | Esophagus | ESCC | 5.06e-04 | 5.23e-02 | 0.0514 |
| 5083 | PAX9 | LZE8T | Human | Esophagus | ESCC | 5.22e-06 | 2.60e-01 | 0.067 |
| 5083 | PAX9 | LZE20T | Human | Esophagus | ESCC | 5.15e-08 | 6.07e-01 | 0.0662 |
| 5083 | PAX9 | LZE22D1 | Human | Esophagus | HGIN | 1.49e-04 | 4.72e-01 | 0.0595 |
| 5083 | PAX9 | LZE22T | Human | Esophagus | ESCC | 2.11e-05 | 1.35e+00 | 0.068 |
| 5083 | PAX9 | LZE24T | Human | Esophagus | ESCC | 2.89e-16 | 5.95e-01 | 0.0596 |
| 5083 | PAX9 | LZE22D3 | Human | Esophagus | HGIN | 2.90e-02 | 4.60e-01 | 0.0653 |
| 5083 | PAX9 | LZE21T | Human | Esophagus | ESCC | 3.17e-02 | 6.44e-01 | 0.0655 |
| 5083 | PAX9 | P1T-E | Human | Esophagus | ESCC | 2.46e-23 | 2.16e+00 | 0.0875 |
| 5083 | PAX9 | P2T-E | Human | Esophagus | ESCC | 9.35e-21 | 2.89e-01 | 0.1177 |
| 5083 | PAX9 | P4T-E | Human | Esophagus | ESCC | 5.72e-23 | 9.86e-01 | 0.1323 |
| 5083 | PAX9 | P5T-E | Human | Esophagus | ESCC | 9.96e-19 | 4.49e-01 | 0.1327 |
| 5083 | PAX9 | P8T-E | Human | Esophagus | ESCC | 5.26e-69 | 1.53e+00 | 0.0889 |
| 5083 | PAX9 | P9T-E | Human | Esophagus | ESCC | 3.55e-12 | 3.85e-01 | 0.1131 |
| 5083 | PAX9 | P10T-E | Human | Esophagus | ESCC | 7.78e-18 | 4.37e-01 | 0.116 |
| 5083 | PAX9 | P12T-E | Human | Esophagus | ESCC | 4.12e-58 | 1.40e+00 | 0.1122 |
| 5083 | PAX9 | P15T-E | Human | Esophagus | ESCC | 2.12e-46 | 1.36e+00 | 0.1149 |
| 5083 | PAX9 | P16T-E | Human | Esophagus | ESCC | 4.58e-33 | 8.38e-01 | 0.1153 |
| 5083 | PAX9 | P20T-E | Human | Esophagus | ESCC | 1.09e-26 | 1.01e+00 | 0.1124 |
| Page: 1 2 3 4 |
| Tissue | Expression Dynamics | Abbreviation |
| Esophagus | 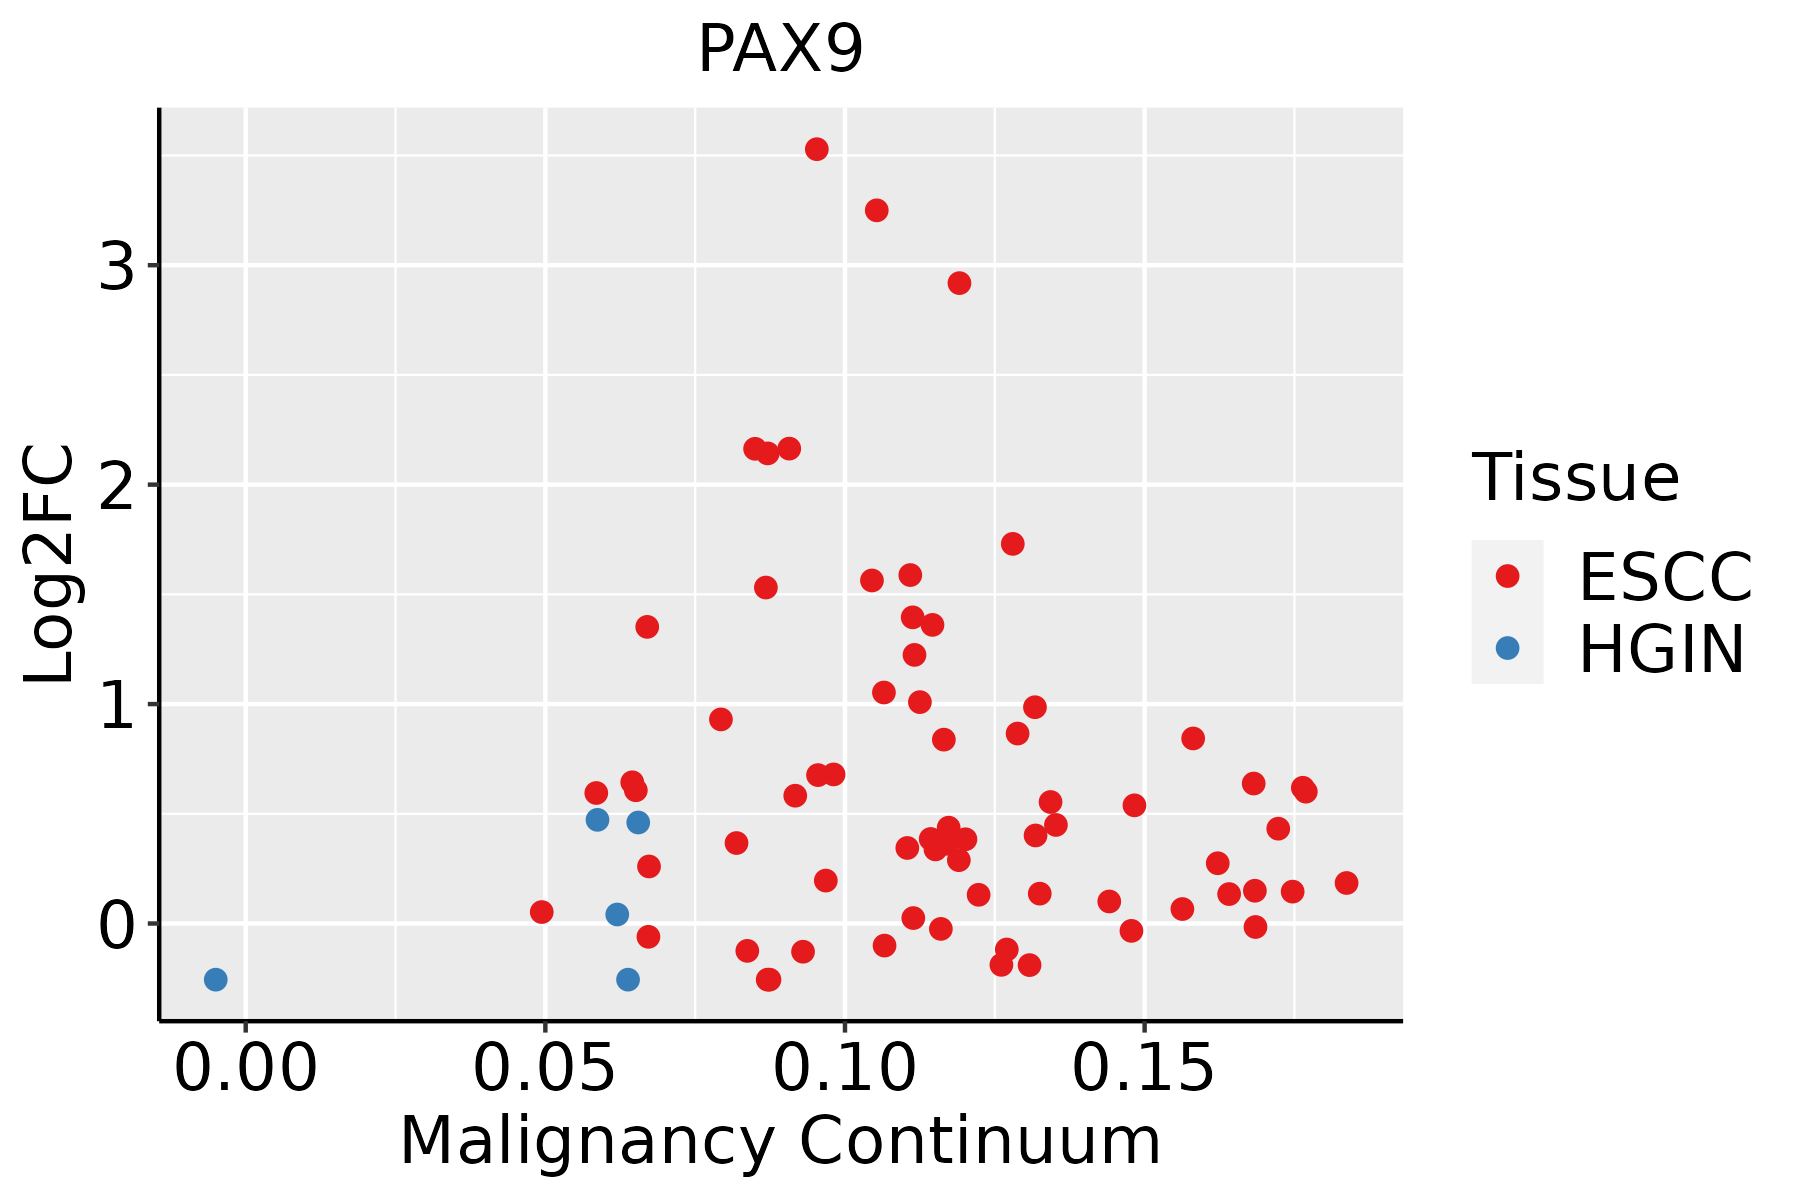 | ESCC: Esophageal squamous cell carcinoma |
| HGIN: High-grade intraepithelial neoplasias | ||
| LGIN: Low-grade intraepithelial neoplasias | ||
| Oral Cavity | 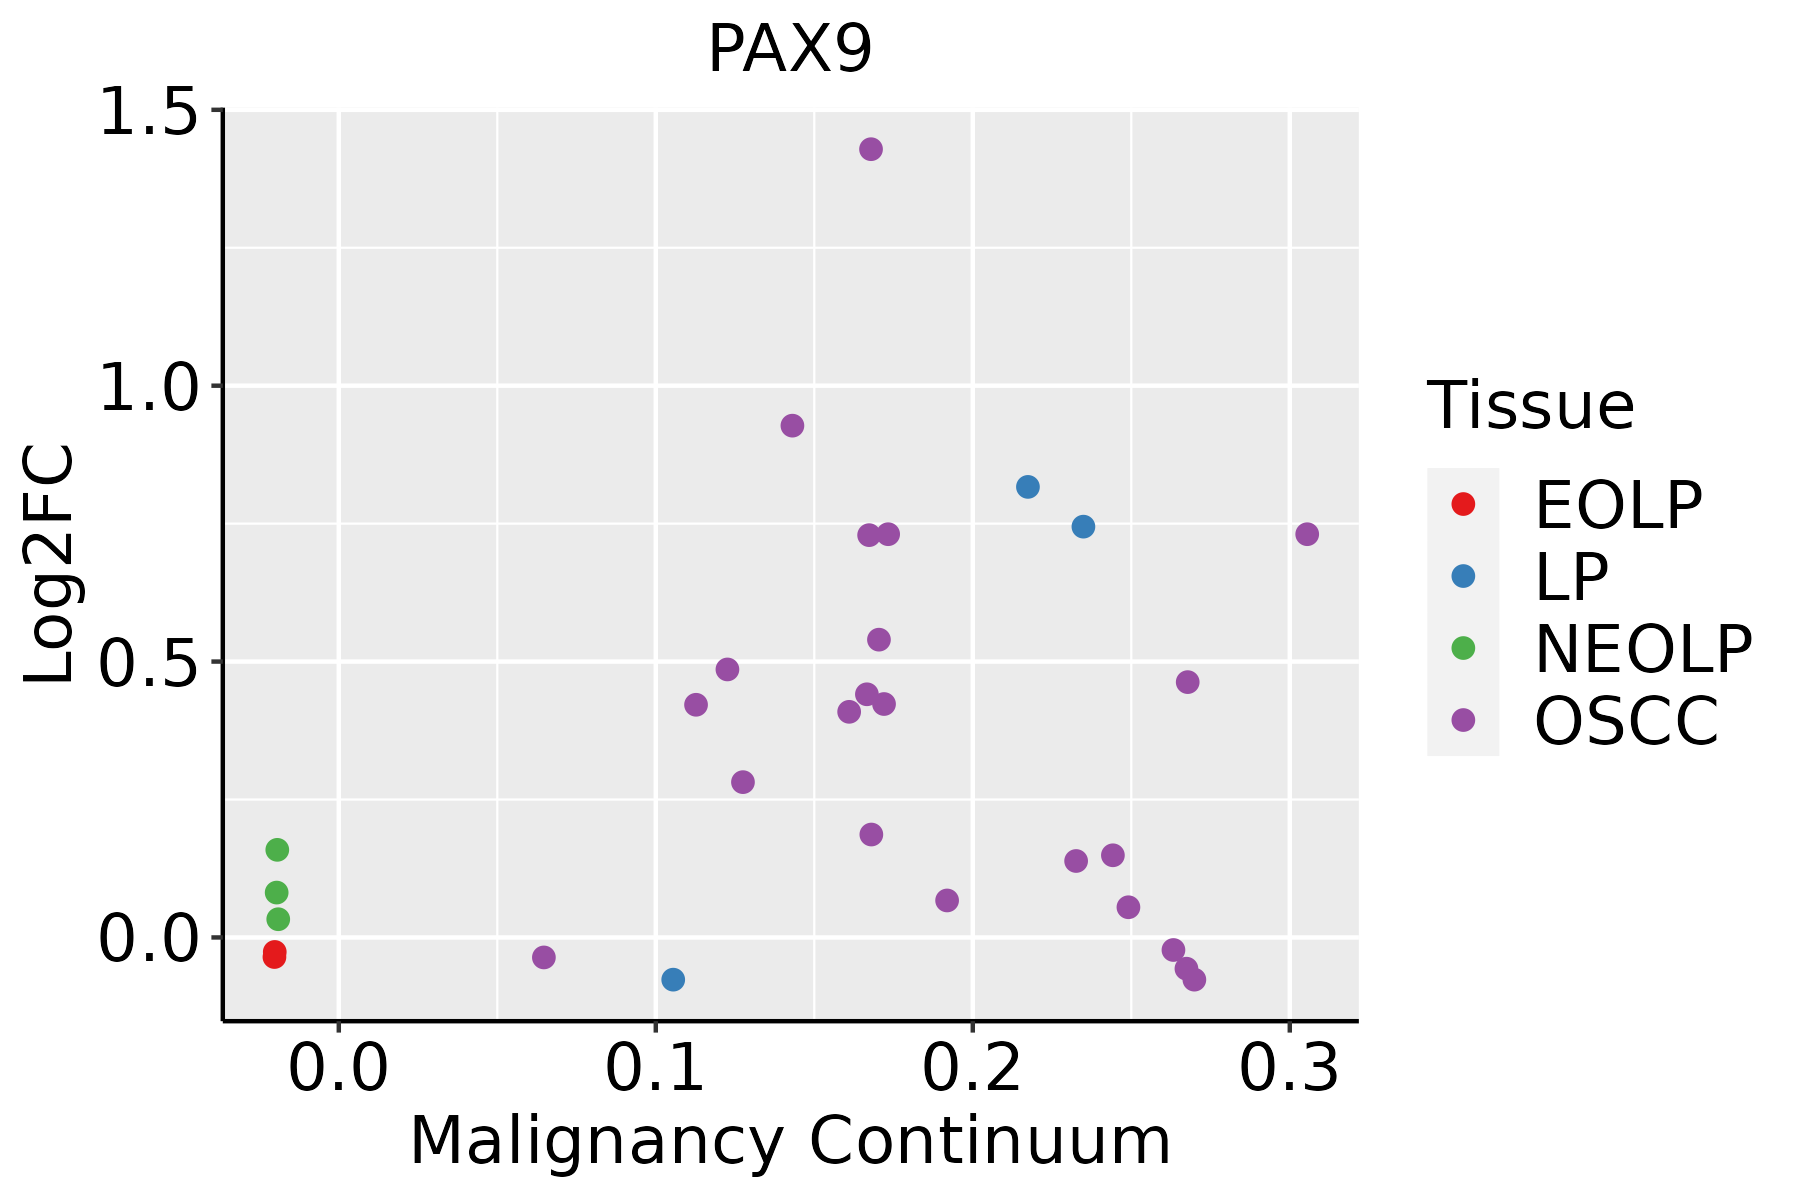 | EOLP: Erosive Oral lichen planus |
| LP: leukoplakia | ||
| NEOLP: Non-erosive oral lichen planus | ||
| OSCC: Oral squamous cell carcinoma |
| ∗log2FC in expression of this searched gene in stem-like cells from each diseased tissue sample relative to stem-like cells in normal samples in each tissue plotted against the malignancy continuum. Samples are colored based on if they are from different disease stage. |
Top |
Malignant transformation related pathway analysis |
| Find out the enriched GO biological processes and KEGG pathways involved in transition from healthy to precancer to cancer |
| Tissue | Disease Stage | Enriched GO biological Processes |
| Colorectum | AD |  |
| Colorectum | SER |  |
| Colorectum | MSS |  |
| Colorectum | MSI-H |  |
| Colorectum | FAP |  |
| ∗Top 15 enriched GO BP terms are showed in the bar plot of each disease state in each tissue. Each row represents a significant GO biological process which is colored according to the -log10(p.adjust). |
| Page: 1 2 3 4 5 6 7 8 9 |
| GO ID | Tissue | Disease Stage | Description | Gene Ratio | Bg Ratio | pvalue | p.adjust | Count |
| GO:00074926 | Esophagus | ESCC | endoderm development | 54/8552 | 77/18723 | 1.20e-05 | 1.12e-04 | 54 |
| GO:00603242 | Esophagus | ESCC | face development | 34/8552 | 44/18723 | 1.90e-05 | 1.67e-04 | 34 |
| GO:00101711 | Esophagus | ESCC | body morphogenesis | 30/8552 | 43/18723 | 1.21e-03 | 5.88e-03 | 30 |
| GO:00603253 | Esophagus | ESCC | face morphogenesis | 21/8552 | 28/18723 | 1.57e-03 | 7.33e-03 | 21 |
| GO:00603232 | Esophagus | ESCC | head morphogenesis | 22/8552 | 32/18723 | 7.12e-03 | 2.58e-02 | 22 |
| GO:20000274 | Esophagus | ESCC | regulation of animal organ morphogenesis | 71/8552 | 125/18723 | 7.97e-03 | 2.84e-02 | 71 |
| GO:00074925 | Oral cavity | OSCC | endoderm development | 47/7305 | 77/18723 | 7.40e-05 | 5.81e-04 | 47 |
| GO:0060324 | Oral cavity | OSCC | face development | 28/7305 | 44/18723 | 8.15e-04 | 4.35e-03 | 28 |
| GO:00603252 | Oral cavity | OSCC | face morphogenesis | 18/7305 | 28/18723 | 5.96e-03 | 2.27e-02 | 18 |
| GO:0060323 | Oral cavity | OSCC | head morphogenesis | 19/7305 | 32/18723 | 1.56e-02 | 5.00e-02 | 19 |
| Page: 1 |
| Pathway ID | Tissue | Disease Stage | Description | Gene Ratio | Bg Ratio | pvalue | p.adjust | qvalue | Count |
| Page: 1 |
Top |
Cell-cell communication analysis |
| Identification of potential cell-cell interactions between two cell types and their ligand-receptor pairs for different disease states |
| Ligand | Receptor | LRpair | Pathway | Tissue | Disease Stage |
| Page: 1 |
Top |
Single-cell gene regulatory network inference analysis |
| Find out the significant the regulons (TFs) and the target genes of each regulon across cell types for different disease states |
| TF | Cell Type | Tissue | Disease Stage | Target Gene | RSS | Regulon Activity |
| PAX9 | ICAF | Cervix | Healthy | ELP3,RIMKLB,KRT16, etc. | 5.17e-04 |  |
| PAX9 | M2MAC | Esophagus | ADJ | JKAMP,NHEJ1,ANKRD17, etc. | 3.35e-01 |  |
| PAX9 | M1MAC | Esophagus | ADJ | JKAMP,NHEJ1,ANKRD17, etc. | 2.84e-01 | |
| PAX9 | M2MAC | Esophagus | ESCC | JKAMP,NHEJ1,ANKRD17, etc. | 2.40e-01 |  |
| PAX9 | M1MAC | Esophagus | ESCC | JKAMP,NHEJ1,ANKRD17, etc. | 3.94e-01 | |
| PAX9 | GRA | Oral cavity | ADJ | TGM3,HOPX,VSIG8, etc. | 3.35e-01 |  |
| PAX9 | iATC | Thyroid | HT | PHEX,ARHGAP36,SLIT1, etc. | 2.93e-02 |  |
| ∗The dot plots of a searched regulon are shown for all cell subpopulations in each disease state of each tissue based on the regulon specific score inferred using pySCENIC and by calculating the average expression. |
| Page: 1 |
Top |
Somatic mutation of malignant transformation related genes |
| Annotation of somatic variants for genes involved in malignant transformation |
| Hugo Symbol | Variant Class | Variant Classification | dbSNP RS | HGVSc | HGVSp | HGVSp Short | SWISSPROT | BIOTYPE | SIFT | PolyPhen | Tumor Sample Barcode | Tissue | Histology | Sex | Age | Stage | Therapy Types | Drugs | Outcome |
| PAX9 | SNV | Missense_Mutation | c.1021N>G | p.Leu341Val | p.L341V | P55771 | protein_coding | deleterious_low_confidence(0) | probably_damaging(0.952) | TCGA-AN-A0AK-01 | Breast | breast invasive carcinoma | Female | >=65 | I/II | Unknown | Unknown | SD | |
| PAX9 | SNV | Missense_Mutation | novel | c.761N>G | p.Lys254Arg | p.K254R | P55771 | protein_coding | tolerated_low_confidence(0.08) | benign(0) | TCGA-B6-A401-01 | Breast | breast invasive carcinoma | Female | <65 | I/II | Chemotherapy | cyclophosphamide | SD |
| PAX9 | SNV | Missense_Mutation | novel | c.140N>A | p.Arg47Gln | p.R47Q | P55771 | protein_coding | deleterious(0) | probably_damaging(0.987) | TCGA-2W-A8YY-01 | Cervix | cervical & endocervical cancer | Female | <65 | I/II | Chemotherapy | cisplatin | CR |
| PAX9 | SNV | Missense_Mutation | novel | c.1000N>T | p.His334Tyr | p.H334Y | P55771 | protein_coding | deleterious_low_confidence(0) | benign(0.221) | TCGA-EA-A3HS-01 | Cervix | cervical & endocervical cancer | Female | <65 | I/II | Unknown | Unknown | SD |
| PAX9 | SNV | Missense_Mutation | c.604C>A | p.Leu202Met | p.L202M | P55771 | protein_coding | deleterious(0) | probably_damaging(0.996) | TCGA-AA-3663-01 | Colorectum | colon adenocarcinoma | Male | <65 | I/II | Unknown | Unknown | SD | |
| PAX9 | SNV | Missense_Mutation | c.239N>T | p.Thr80Ile | p.T80I | P55771 | protein_coding | deleterious(0) | probably_damaging(0.996) | TCGA-AZ-5403-01 | Colorectum | colon adenocarcinoma | Male | <65 | I/II | Unknown | Unknown | PD | |
| PAX9 | SNV | Missense_Mutation | rs748361932 | c.323N>T | p.Ala108Val | p.A108V | P55771 | protein_coding | deleterious(0) | probably_damaging(0.986) | TCGA-D5-6930-01 | Colorectum | colon adenocarcinoma | Male | >=65 | I/II | Unknown | Unknown | SD |
| PAX9 | SNV | Missense_Mutation | novel | c.599A>G | p.Asp200Gly | p.D200G | P55771 | protein_coding | tolerated(0.21) | probably_damaging(0.989) | TCGA-A5-A0G1-01 | Endometrium | uterine corpus endometrioid carcinoma | Female | >=65 | I/II | Unknown | Unknown | SD |
| PAX9 | SNV | Missense_Mutation | novel | c.415C>A | p.His139Asn | p.H139N | P55771 | protein_coding | tolerated(0.31) | benign(0.014) | TCGA-A5-A2K5-01 | Endometrium | uterine corpus endometrioid carcinoma | Female | >=65 | I/II | Unknown | Unknown | SD |
| PAX9 | SNV | Missense_Mutation | rs771366081 | c.959N>T | p.Ser320Leu | p.S320L | P55771 | protein_coding | tolerated_low_confidence(0.07) | benign(0.114) | TCGA-AP-A1E0-01 | Endometrium | uterine corpus endometrioid carcinoma | Female | <65 | III/IV | Chemotherapy | paclitaxel | SD |
| Page: 1 2 3 4 |
Top |
Related drugs of malignant transformation related genes |
| Identification of chemicals and drugs interact with genes involved in malignant transfromation |
| (DGIdb 4.0) |
| Entrez ID | Symbol | Category | Interaction Types | Drug Claim Name | Drug Name | PMIDs |
| Page: 1 |

Copyright 2023-Present -The University of Texas Health Science Center at Houston |