
|
|||||
|
 | |
| |
| |
| |
| |
| |
|
Gene: PAX8 |
Gene summary for PAX8 |
| Gene information | Species | Human | Gene symbol | PAX8 | Gene ID | 7849 |
| Gene name | paired box 8 | |
| Gene Alias | PAX8 | |
| Cytomap | 2q14.1 | |
| Gene Type | protein-coding | GO ID | GO:0001655 | UniProtAcc | Q06710 |
Top |
Malignant transformation analysis |
| Identification of the aberrant gene expression in precancerous and cancerous lesions by comparing the gene expression of stem-like cells in diseased tissues with normal stem cells |
| Entrez ID | Symbol | Replicates | Species | Organ | Tissue | Adj P-value | Log2FC | Malignancy |
| 7849 | PAX8 | AEH-subject1 | Human | Endometrium | AEH | 7.55e-26 | 6.97e-01 | -0.3059 |
| 7849 | PAX8 | AEH-subject2 | Human | Endometrium | AEH | 3.26e-13 | 5.47e-01 | -0.2525 |
| 7849 | PAX8 | AEH-subject3 | Human | Endometrium | AEH | 2.09e-06 | 3.90e-01 | -0.2576 |
| 7849 | PAX8 | AEH-subject5 | Human | Endometrium | AEH | 7.16e-23 | 7.18e-01 | -0.2953 |
| 7849 | PAX8 | EEC-subject1 | Human | Endometrium | EEC | 1.15e-18 | 6.27e-01 | -0.2682 |
| 7849 | PAX8 | EEC-subject2 | Human | Endometrium | EEC | 1.45e-43 | 8.92e-01 | -0.2607 |
| 7849 | PAX8 | EEC-subject3 | Human | Endometrium | EEC | 1.15e-02 | 8.47e-02 | -0.2525 |
| 7849 | PAX8 | EEC-subject4 | Human | Endometrium | EEC | 5.22e-08 | 4.33e-01 | -0.2571 |
| 7849 | PAX8 | EEC-subject5 | Human | Endometrium | EEC | 2.96e-14 | 5.54e-01 | -0.249 |
| 7849 | PAX8 | GSM5276934 | Human | Endometrium | EEC | 1.06e-03 | -2.50e-01 | -0.0913 |
| 7849 | PAX8 | GSM5276935 | Human | Endometrium | EEC | 2.66e-52 | 8.89e-01 | -0.123 |
| 7849 | PAX8 | GSM6177620_NYU_UCEC1_lib1_lib1 | Human | Endometrium | EEC | 8.51e-10 | 4.26e-01 | -0.1869 |
| 7849 | PAX8 | GSM6177620_NYU_UCEC1_lib2_lib2 | Human | Endometrium | EEC | 2.74e-10 | 3.93e-01 | -0.1875 |
| 7849 | PAX8 | GSM6177620_NYU_UCEC1_lib3_lib3 | Human | Endometrium | EEC | 4.73e-10 | 3.60e-01 | -0.1883 |
| 7849 | PAX8 | GSM6177621_NYU_UCEC2_lib1_lib1 | Human | Endometrium | EEC | 6.00e-04 | 2.72e-01 | -0.1934 |
| 7849 | PAX8 | GSM6177622_NYU_UCEC3_lib1_lib1 | Human | Endometrium | EEC | 2.94e-22 | 5.25e-01 | -0.1917 |
| 7849 | PAX8 | GSM6177622_NYU_UCEC3_lib2_lib2 | Human | Endometrium | EEC | 3.54e-19 | 5.02e-01 | -0.1916 |
| 7849 | PAX8 | GSM6177623_NYU_UCEC3_Vis | Human | Endometrium | EEC | 1.89e-64 | 1.14e+00 | -0.1269 |
| 7849 | PAX8 | Adj_PTCwithHT_6 | Human | Thyroid | HT | 6.14e-17 | -8.27e-01 | 0.02 |
| 7849 | PAX8 | PTCwithHT_1 | Human | Thyroid | HT | 3.60e-05 | -7.95e-01 | 0.0238 |
| Page: 1 2 |
| Tissue | Expression Dynamics | Abbreviation |
| Endometrium |  | AEH: Atypical endometrial hyperplasia |
| EEC: Endometrioid Cancer | ||
| Thyroid | 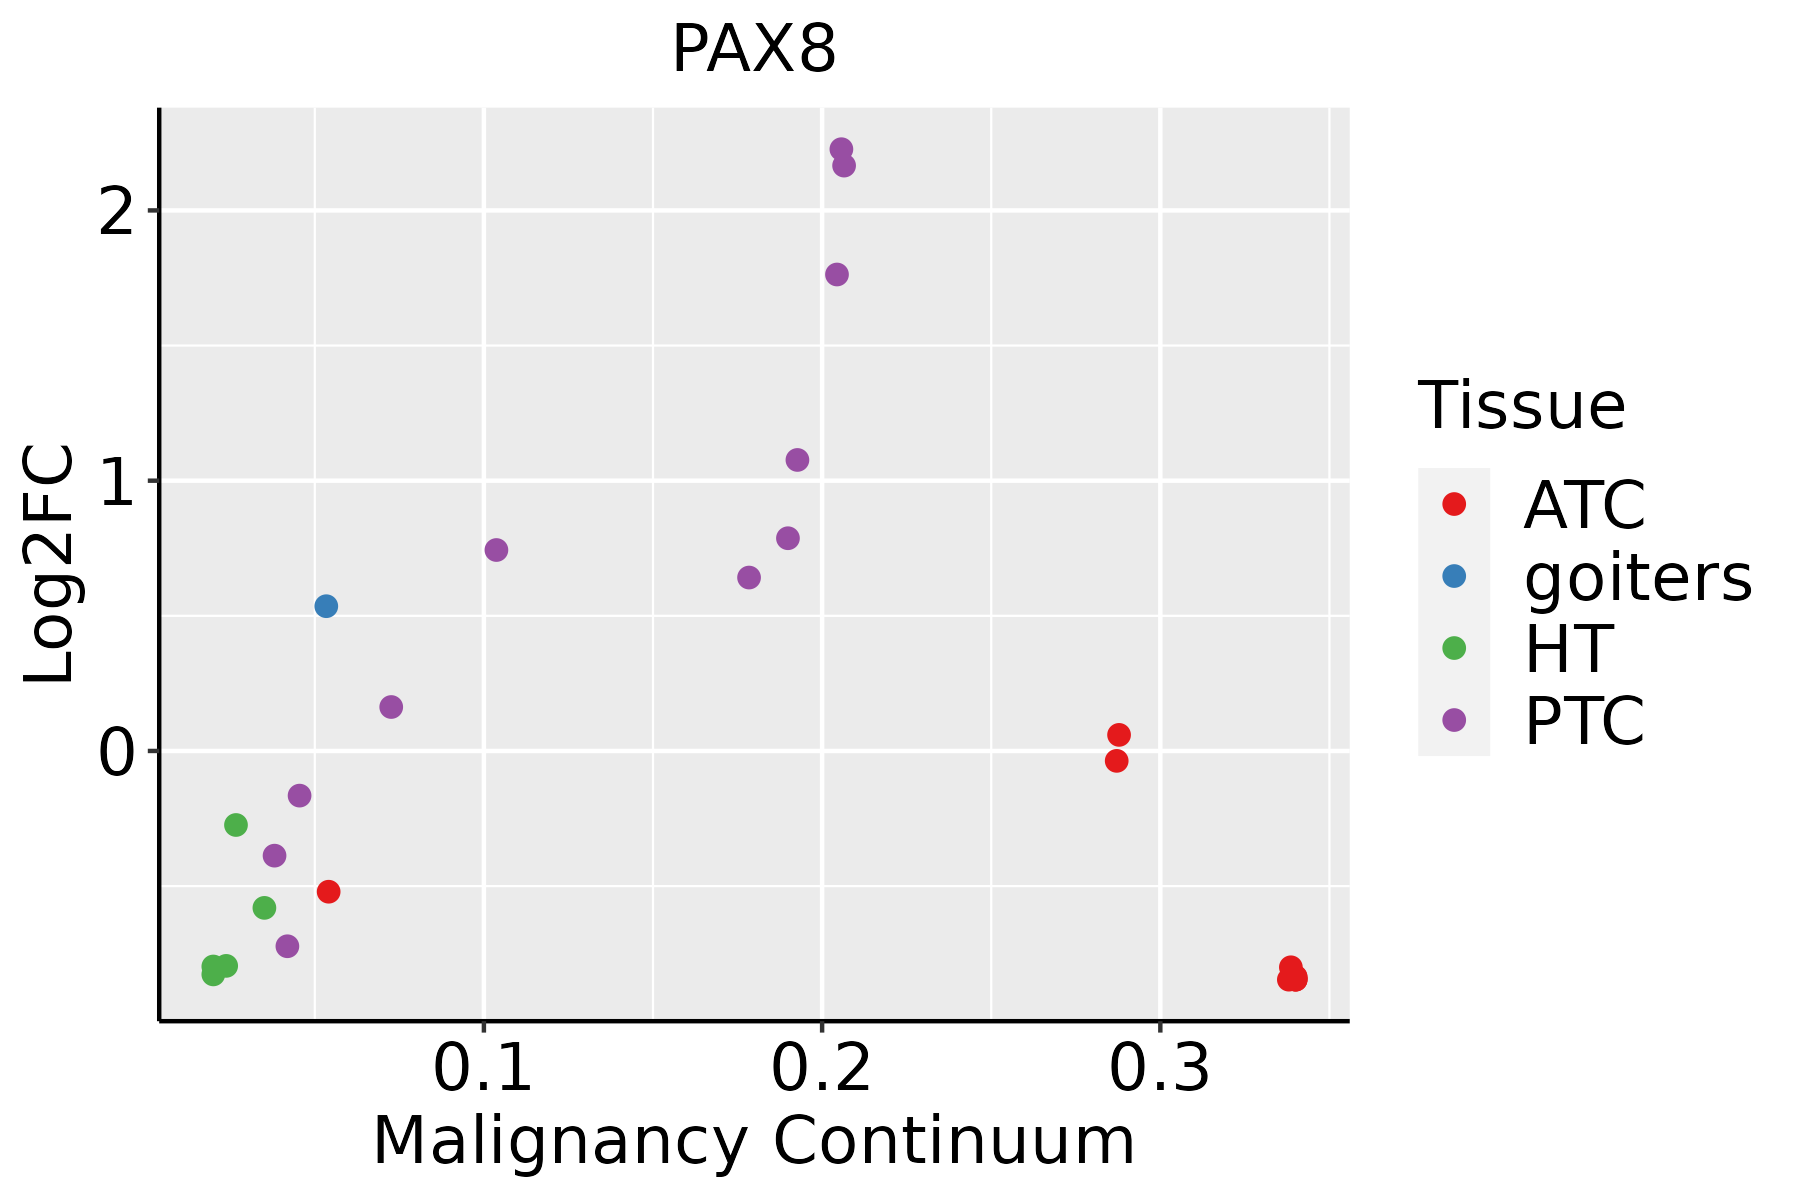 | ATC: Anaplastic thyroid cancer |
| HT: Hashimoto's thyroiditis | ||
| PTC: Papillary thyroid cancer |
| ∗log2FC in expression of this searched gene in stem-like cells from each diseased tissue sample relative to stem-like cells in normal samples in each tissue plotted against the malignancy continuum. Samples are colored based on if they are from different disease stage. |
Top |
Malignant transformation related pathway analysis |
| Find out the enriched GO biological processes and KEGG pathways involved in transition from healthy to precancer to cancer |
| Tissue | Disease Stage | Enriched GO biological Processes |
| Colorectum | AD |  |
| Colorectum | SER |  |
| Colorectum | MSS |  |
| Colorectum | MSI-H |  |
| Colorectum | FAP |  |
| ∗Top 15 enriched GO BP terms are showed in the bar plot of each disease state in each tissue. Each row represents a significant GO biological process which is colored according to the -log10(p.adjust). |
| Page: 1 2 3 4 5 6 7 8 9 |
| GO ID | Tissue | Disease Stage | Description | Gene Ratio | Bg Ratio | pvalue | p.adjust | Count |
| GO:004873216 | Endometrium | AEH | gland development | 83/2100 | 436/18723 | 8.62e-07 | 3.11e-05 | 83 |
| GO:00016556 | Endometrium | AEH | urogenital system development | 67/2100 | 338/18723 | 2.30e-06 | 6.76e-05 | 67 |
| GO:00720015 | Endometrium | AEH | renal system development | 61/2100 | 302/18723 | 3.43e-06 | 9.24e-05 | 61 |
| GO:00605627 | Endometrium | AEH | epithelial tube morphogenesis | 63/2100 | 325/18723 | 9.63e-06 | 2.23e-04 | 63 |
| GO:00611384 | Endometrium | AEH | morphogenesis of a branching epithelium | 40/2100 | 182/18723 | 2.16e-05 | 4.20e-04 | 40 |
| GO:00018224 | Endometrium | AEH | kidney development | 57/2100 | 293/18723 | 2.25e-05 | 4.35e-04 | 57 |
| GO:00017637 | Endometrium | AEH | morphogenesis of a branching structure | 42/2100 | 196/18723 | 2.58e-05 | 4.86e-04 | 42 |
| GO:00609932 | Endometrium | AEH | kidney morphogenesis | 24/2100 | 93/18723 | 6.73e-05 | 1.04e-03 | 24 |
| GO:00487542 | Endometrium | AEH | branching morphogenesis of an epithelial tube | 33/2100 | 151/18723 | 1.22e-04 | 1.68e-03 | 33 |
| GO:00016562 | Endometrium | AEH | metanephros development | 22/2100 | 85/18723 | 1.27e-04 | 1.74e-03 | 22 |
| GO:00308564 | Endometrium | AEH | regulation of epithelial cell differentiation | 33/2100 | 154/18723 | 1.81e-04 | 2.32e-03 | 33 |
| GO:00721605 | Endometrium | AEH | nephron tubule epithelial cell differentiation | 7/2100 | 14/18723 | 3.71e-04 | 4.02e-03 | 7 |
| GO:00720736 | Endometrium | AEH | kidney epithelium development | 29/2100 | 136/18723 | 4.71e-04 | 4.91e-03 | 29 |
| GO:00613263 | Endometrium | AEH | renal tubule development | 22/2100 | 94/18723 | 5.89e-04 | 5.82e-03 | 22 |
| GO:00720093 | Endometrium | AEH | nephron epithelium development | 24/2100 | 109/18723 | 8.69e-04 | 8.03e-03 | 24 |
| GO:00720064 | Endometrium | AEH | nephron development | 29/2100 | 142/18723 | 9.80e-04 | 8.89e-03 | 29 |
| GO:00721822 | Endometrium | AEH | regulation of nephron tubule epithelial cell differentiation | 6/2100 | 12/18723 | 1.00e-03 | 8.94e-03 | 6 |
| GO:00610052 | Endometrium | AEH | cell differentiation involved in kidney development | 15/2100 | 57/18723 | 1.20e-03 | 1.04e-02 | 15 |
| GO:0061333 | Endometrium | AEH | renal tubule morphogenesis | 18/2100 | 75/18723 | 1.32e-03 | 1.12e-02 | 18 |
| GO:00358504 | Endometrium | AEH | epithelial cell differentiation involved in kidney development | 13/2100 | 47/18723 | 1.53e-03 | 1.26e-02 | 13 |
| Page: 1 2 3 4 5 6 7 8 9 |
| Pathway ID | Tissue | Disease Stage | Description | Gene Ratio | Bg Ratio | pvalue | p.adjust | qvalue | Count |
| hsa0521610 | Endometrium | AEH | Thyroid cancer | 12/1197 | 37/8465 | 3.68e-03 | 2.14e-02 | 1.56e-02 | 12 |
| hsa0521615 | Endometrium | AEH | Thyroid cancer | 12/1197 | 37/8465 | 3.68e-03 | 2.14e-02 | 1.56e-02 | 12 |
| hsa0521625 | Endometrium | EEC | Thyroid cancer | 13/1237 | 37/8465 | 1.51e-03 | 9.55e-03 | 7.12e-03 | 13 |
| hsa0521635 | Endometrium | EEC | Thyroid cancer | 13/1237 | 37/8465 | 1.51e-03 | 9.55e-03 | 7.12e-03 | 13 |
| Page: 1 |
Top |
Cell-cell communication analysis |
| Identification of potential cell-cell interactions between two cell types and their ligand-receptor pairs for different disease states |
| Ligand | Receptor | LRpair | Pathway | Tissue | Disease Stage |
| Page: 1 |
Top |
Single-cell gene regulatory network inference analysis |
| Find out the significant the regulons (TFs) and the target genes of each regulon across cell types for different disease states |
| TF | Cell Type | Tissue | Disease Stage | Target Gene | RSS | Regulon Activity |
| PAX8 | COL | Cervix | CC | PAX8-AS1,KIF12,HOXB3, etc. | 7.61e-03 |  |
| PAX8 | COL | Cervix | Healthy | MUC16,ITGB8,MUC1, etc. | 3.21e-01 |  |
| PAX8 | COL | Cervix | N_HPV | PAX8-AS1,KIF12,HOXB3, etc. | 3.98e-01 |  |
| PAX8 | DC | Cervix | CC | PAX8-AS1,CHPT1,SCNN1B, etc. | 1.37e-01 | |
| PAX8 | CD8TRM | Cervix | HSIL_HPV | PAX8-AS1,CHPT1,SCNN1B, etc. | 1.27e-01 |  |
| PAX8 | CT | Colorectum | Healthy | MAPKBP1,PPP4R2,AL049830.3, etc. | 1.44e-01 |  |
| PAX8 | SURF | Endometrium | AEH | GTF2I,SLC25A29,TMEM63A, etc. | 2.33e-01 |  |
| PAX8 | GC | Esophagus | ADJ | MRPL27,CTD-2033A16.3,ORAI2, etc. | 3.34e-01 |  |
| PAX8 | GC | Esophagus | ESCC | MRPL27,CTD-2033A16.3,ORAI2, etc. | 3.05e-01 |  |
| PAX8 | STM | Thyroid | Healthy | HSPA1A,FAHD2A,JUN, etc. | 5.30e-01 |  |
| ∗The dot plots of a searched regulon are shown for all cell subpopulations in each disease state of each tissue based on the regulon specific score inferred using pySCENIC and by calculating the average expression. |
| Page: 1 2 |
Top |
Somatic mutation of malignant transformation related genes |
| Annotation of somatic variants for genes involved in malignant transformation |
| Hugo Symbol | Variant Class | Variant Classification | dbSNP RS | HGVSc | HGVSp | HGVSp Short | SWISSPROT | BIOTYPE | SIFT | PolyPhen | Tumor Sample Barcode | Tissue | Histology | Sex | Age | Stage | Therapy Types | Drugs | Outcome |
| PAX8 | SNV | Missense_Mutation | novel | c.113C>A | p.Ala38Asp | p.A38D | Q06710 | protein_coding | deleterious(0) | probably_damaging(0.976) | TCGA-A2-A0T7-01 | Breast | breast invasive carcinoma | Female | <65 | I/II | Chemotherapy | adriamycin | SD |
| PAX8 | SNV | Missense_Mutation | rs368109291 | c.98G>A | p.Arg33His | p.R33H | Q06710 | protein_coding | deleterious(0.01) | probably_damaging(0.997) | TCGA-2W-A8YY-01 | Cervix | cervical & endocervical cancer | Female | <65 | I/II | Chemotherapy | cisplatin | CR |
| PAX8 | SNV | Missense_Mutation | c.538T>C | p.Tyr180His | p.Y180H | Q06710 | protein_coding | deleterious(0.03) | probably_damaging(0.991) | TCGA-AA-3815-01 | Colorectum | colon adenocarcinoma | Female | >=65 | I/II | Unknown | Unknown | SD | |
| PAX8 | SNV | Missense_Mutation | rs114736880 | c.565G>A | p.Ala189Thr | p.A189T | Q06710 | protein_coding | tolerated(0.25) | benign(0.001) | TCGA-AA-3949-01 | Colorectum | colon adenocarcinoma | Female | >=65 | III/IV | Unknown | Unknown | SD |
| PAX8 | SNV | Missense_Mutation | c.860G>A | p.Arg287His | p.R287H | Q06710 | protein_coding | tolerated(0.09) | possibly_damaging(0.63) | TCGA-AU-6004-01 | Colorectum | colon adenocarcinoma | Female | >=65 | I/II | Unknown | Unknown | SD | |
| PAX8 | SNV | Missense_Mutation | novel | c.659N>A | p.Arg220Gln | p.R220Q | Q06710 | protein_coding | deleterious(0.02) | possibly_damaging(0.457) | TCGA-CA-6717-01 | Colorectum | colon adenocarcinoma | Male | <65 | I/II | Chemotherapy | oxaliplatin | CR |
| PAX8 | SNV | Missense_Mutation | c.1051N>A | p.Val351Met | p.V351M | Q06710 | protein_coding | tolerated(0.09) | possibly_damaging(0.898) | TCGA-DM-A28H-01 | Colorectum | colon adenocarcinoma | Male | <65 | III/IV | Unknown | Unknown | PD | |
| PAX8 | SNV | Missense_Mutation | rs1048942 | c.1252N>T | p.Arg418Cys | p.R418C | Q06710 | protein_coding | deleterious(0) | probably_damaging(0.993) | TCGA-A5-A0G2-01 | Endometrium | uterine corpus endometrioid carcinoma | Female | <65 | III/IV | Unknown | Unknown | SD |
| PAX8 | SNV | Missense_Mutation | novel | c.659N>A | p.Arg220Gln | p.R220Q | Q06710 | protein_coding | deleterious(0.02) | possibly_damaging(0.457) | TCGA-A5-A0G2-01 | Endometrium | uterine corpus endometrioid carcinoma | Female | <65 | III/IV | Unknown | Unknown | SD |
| PAX8 | SNV | Missense_Mutation | novel | c.26G>A | p.Gly9Asp | p.G9D | Q06710 | protein_coding | deleterious(0) | probably_damaging(0.975) | TCGA-A5-A1OF-01 | Endometrium | uterine corpus endometrioid carcinoma | Female | <65 | I/II | Unknown | Unknown | SD |
| Page: 1 2 3 4 5 |
Top |
Related drugs of malignant transformation related genes |
| Identification of chemicals and drugs interact with genes involved in malignant transfromation |
| (DGIdb 4.0) |
| Entrez ID | Symbol | Category | Interaction Types | Drug Claim Name | Drug Name | PMIDs |
| 7849 | PAX8 | TRANSCRIPTION FACTOR, CLINICALLY ACTIONABLE | DOXORUBICIN HYDROCHLORIDE | DOXORUBICIN HYDROCHLORIDE | ||
| 7849 | PAX8 | TRANSCRIPTION FACTOR, CLINICALLY ACTIONABLE | DIGOXIGENIN | DIGOXIGENIN | ||
| 7849 | PAX8 | TRANSCRIPTION FACTOR, CLINICALLY ACTIONABLE | DAUNORUBICIN HYDROCHLORIDE | DAUNORUBICIN HYDROCHLORIDE | ||
| 7849 | PAX8 | TRANSCRIPTION FACTOR, CLINICALLY ACTIONABLE | NSC-695801 | CHEMBL461193 | ||
| 7849 | PAX8 | TRANSCRIPTION FACTOR, CLINICALLY ACTIONABLE | DNDI1417099 | CHEMBL1565444 | ||
| 7849 | PAX8 | TRANSCRIPTION FACTOR, CLINICALLY ACTIONABLE | ANGUSTIBALIN | ANGUSTIBALIN | ||
| 7849 | PAX8 | TRANSCRIPTION FACTOR, CLINICALLY ACTIONABLE | MITOXANTRONE DIHYDROCHLORIDE | MITOXANTRONE HYDROCHLORIDE | ||
| 7849 | PAX8 | TRANSCRIPTION FACTOR, CLINICALLY ACTIONABLE | VINBLASTINE SULFATE | VINBLASTINE SULFATE | ||
| 7849 | PAX8 | TRANSCRIPTION FACTOR, CLINICALLY ACTIONABLE | N-ACETYLCOLCHINOL | CHEMBL486504 | ||
| 7849 | PAX8 | TRANSCRIPTION FACTOR, CLINICALLY ACTIONABLE | NSC-348401 | CHEMBL515505 |
| Page: 1 2 3 4 5 6 7 |

Copyright 2023-Present -The University of Texas Health Science Center at Houston |