
|
|||||
|
 | |
| |
| |
| |
| |
| |
|
Gene: PAX6 |
Gene summary for PAX6 |
| Gene information | Species | Human | Gene symbol | PAX6 | Gene ID | 5080 |
| Gene name | paired box 6 | |
| Gene Alias | AN | |
| Cytomap | 11p13 | |
| Gene Type | protein-coding | GO ID | GO:0000122 | UniProtAcc | P26367 |
Top |
Malignant transformation analysis |
| Identification of the aberrant gene expression in precancerous and cancerous lesions by comparing the gene expression of stem-like cells in diseased tissues with normal stem cells |
| Entrez ID | Symbol | Replicates | Species | Organ | Tissue | Adj P-value | Log2FC | Malignancy |
| 5080 | PAX6 | P2T-E | Human | Esophagus | ESCC | 8.84e-05 | 1.01e-01 | 0.1177 |
| 5080 | PAX6 | P10T-E | Human | Esophagus | ESCC | 2.39e-24 | 4.28e-01 | 0.116 |
| 5080 | PAX6 | P12T-E | Human | Esophagus | ESCC | 3.89e-12 | 3.08e-01 | 0.1122 |
| 5080 | PAX6 | P16T-E | Human | Esophagus | ESCC | 4.17e-05 | 1.72e-01 | 0.1153 |
| 5080 | PAX6 | P28T-E | Human | Esophagus | ESCC | 1.88e-04 | 1.20e-01 | 0.1149 |
| 5080 | PAX6 | P52T-E | Human | Esophagus | ESCC | 4.17e-05 | 1.85e-01 | 0.1555 |
| 5080 | PAX6 | P62T-E | Human | Esophagus | ESCC | 5.46e-06 | 1.51e-01 | 0.1302 |
| 5080 | PAX6 | P74T-E | Human | Esophagus | ESCC | 5.82e-23 | 6.29e-01 | 0.1479 |
| 5080 | PAX6 | P76T-E | Human | Esophagus | ESCC | 2.03e-09 | 2.07e-01 | 0.1207 |
| 5080 | PAX6 | P79T-E | Human | Esophagus | ESCC | 5.17e-27 | 5.33e-01 | 0.1154 |
| 5080 | PAX6 | P130T-E | Human | Esophagus | ESCC | 1.47e-14 | 3.03e-01 | 0.1676 |
| 5080 | PAX6 | HTA12-15-2 | Human | Pancreas | PDAC | 3.41e-02 | 3.71e-01 | 0.2315 |
| 5080 | PAX6 | HTA12-23-1 | Human | Pancreas | PDAC | 1.21e-03 | 5.48e-01 | 0.3405 |
| 5080 | PAX6 | HTA12-25-1 | Human | Pancreas | PDAC | 3.74e-09 | 6.68e-01 | 0.313 |
| 5080 | PAX6 | HTA12-26-1 | Human | Pancreas | PDAC | 1.62e-10 | 6.00e-01 | 0.3728 |
| 5080 | PAX6 | HTA12-29-1 | Human | Pancreas | PDAC | 1.43e-41 | 8.55e-01 | 0.3722 |
| Page: 1 |
| Tissue | Expression Dynamics | Abbreviation |
| Esophagus | 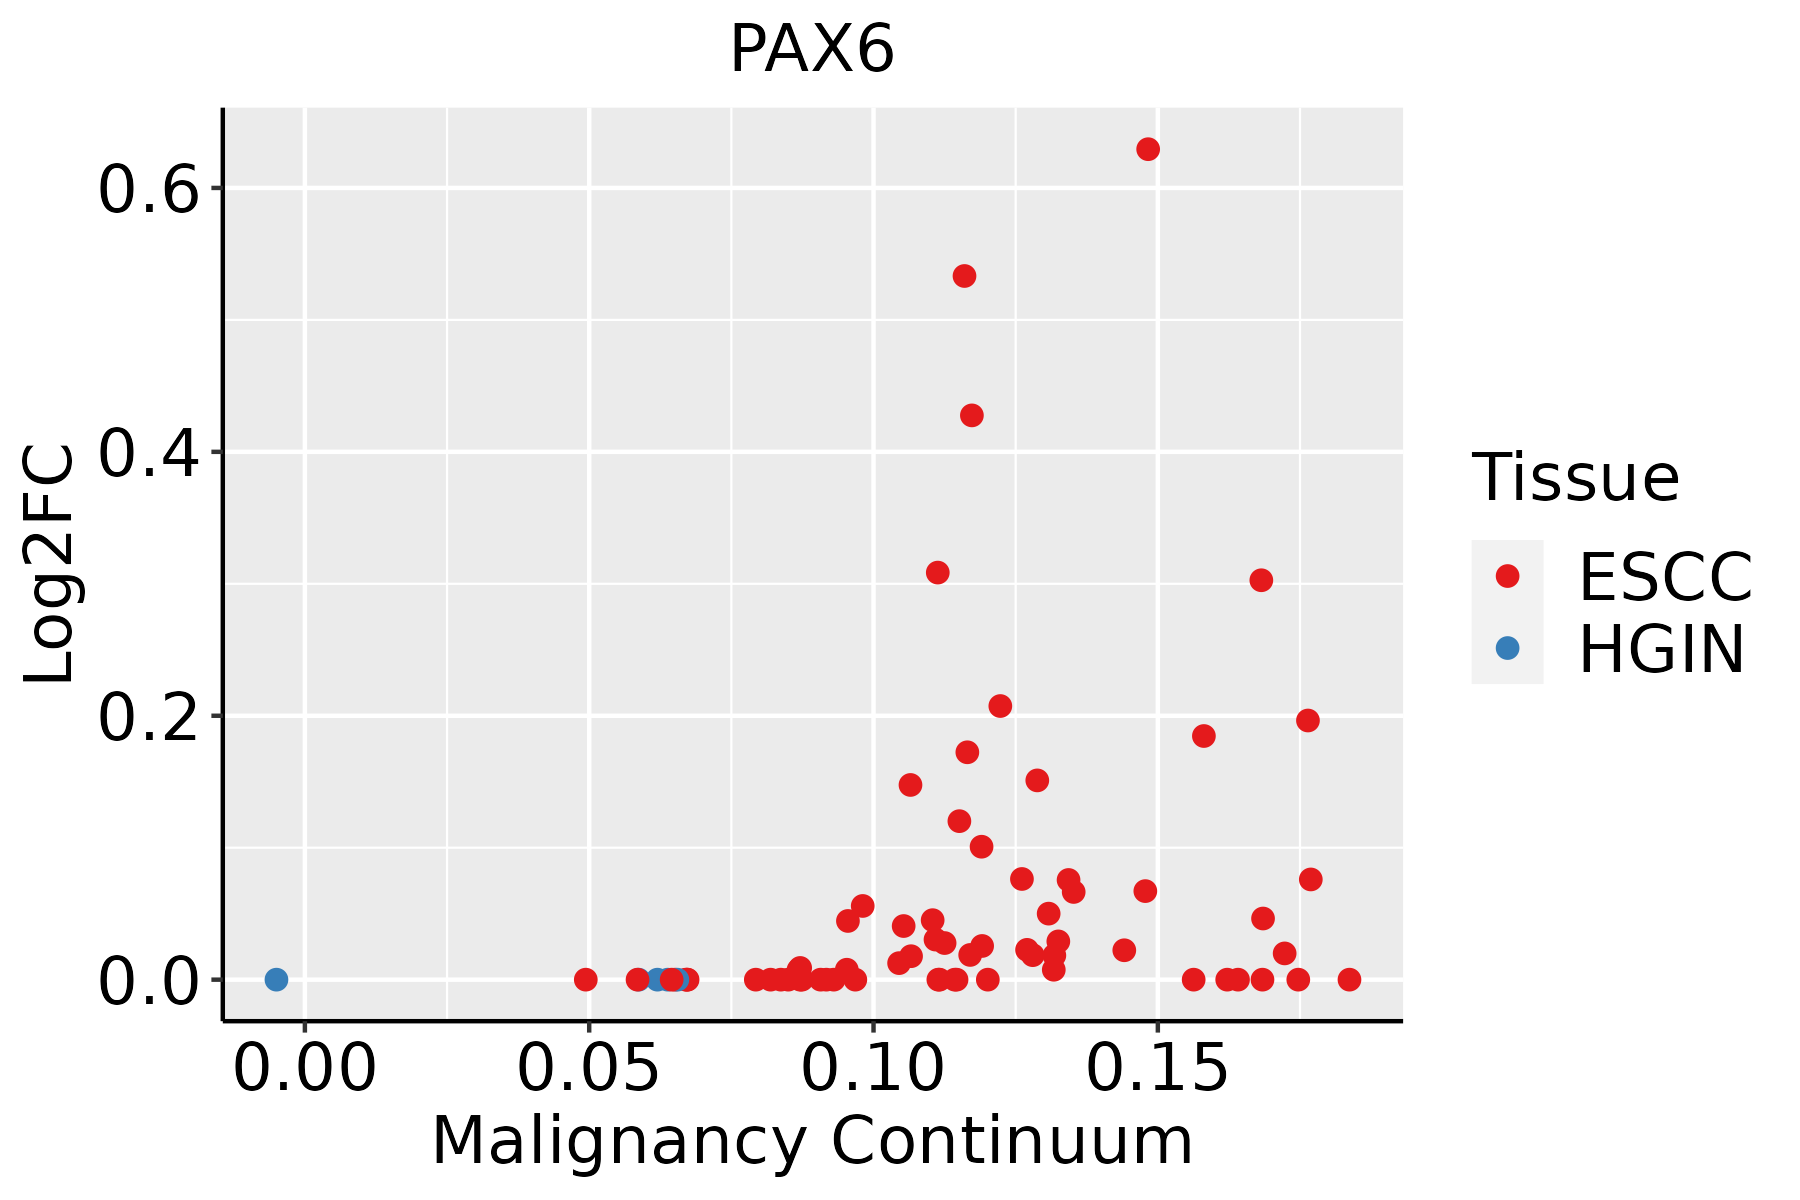 | ESCC: Esophageal squamous cell carcinoma |
| HGIN: High-grade intraepithelial neoplasias | ||
| LGIN: Low-grade intraepithelial neoplasias |
| ∗log2FC in expression of this searched gene in stem-like cells from each diseased tissue sample relative to stem-like cells in normal samples in each tissue plotted against the malignancy continuum. Samples are colored based on if they are from different disease stage. |
Top |
Malignant transformation related pathway analysis |
| Find out the enriched GO biological processes and KEGG pathways involved in transition from healthy to precancer to cancer |
| Tissue | Disease Stage | Enriched GO biological Processes |
| Colorectum | AD |  |
| Colorectum | SER |  |
| Colorectum | MSS |  |
| Colorectum | MSI-H |  |
| Colorectum | FAP |  |
| ∗Top 15 enriched GO BP terms are showed in the bar plot of each disease state in each tissue. Each row represents a significant GO biological process which is colored according to the -log10(p.adjust). |
| Page: 1 2 3 4 5 6 7 8 9 |
| GO ID | Tissue | Disease Stage | Description | Gene Ratio | Bg Ratio | pvalue | p.adjust | Count |
| GO:005165617 | Esophagus | ESCC | establishment of organelle localization | 273/8552 | 390/18723 | 9.13e-23 | 1.81e-20 | 273 |
| GO:0051098111 | Esophagus | ESCC | regulation of binding | 251/8552 | 363/18723 | 6.73e-20 | 8.46e-18 | 251 |
| GO:190285015 | Esophagus | ESCC | microtubule cytoskeleton organization involved in mitosis | 116/8552 | 147/18723 | 1.25e-16 | 9.91e-15 | 116 |
| GO:0010563111 | Esophagus | ESCC | negative regulation of phosphorus metabolic process | 274/8552 | 442/18723 | 2.32e-12 | 9.41e-11 | 274 |
| GO:0045936111 | Esophagus | ESCC | negative regulation of phosphate metabolic process | 273/8552 | 441/18723 | 3.18e-12 | 1.25e-10 | 273 |
| GO:0048732111 | Esophagus | ESCC | gland development | 269/8552 | 436/18723 | 7.81e-12 | 2.95e-10 | 269 |
| GO:0051099111 | Esophagus | ESCC | positive regulation of binding | 122/8552 | 173/18723 | 2.79e-11 | 9.45e-10 | 122 |
| GO:0042326111 | Esophagus | ESCC | negative regulation of phosphorylation | 237/8552 | 385/18723 | 1.86e-10 | 5.33e-09 | 237 |
| GO:0001933111 | Esophagus | ESCC | negative regulation of protein phosphorylation | 213/8552 | 342/18723 | 3.54e-10 | 9.76e-09 | 213 |
| GO:000716320 | Esophagus | ESCC | establishment or maintenance of cell polarity | 143/8552 | 218/18723 | 2.05e-09 | 4.65e-08 | 143 |
| GO:0051101111 | Esophagus | ESCC | regulation of DNA binding | 84/8552 | 118/18723 | 1.64e-08 | 3.21e-07 | 84 |
| GO:00435888 | Esophagus | ESCC | skin development | 163/8552 | 263/18723 | 6.48e-08 | 1.14e-06 | 163 |
| GO:003001018 | Esophagus | ESCC | establishment of cell polarity | 96/8552 | 143/18723 | 1.69e-07 | 2.67e-06 | 96 |
| GO:00219159 | Esophagus | ESCC | neural tube development | 101/8552 | 152/18723 | 1.78e-07 | 2.79e-06 | 101 |
| GO:000854410 | Esophagus | ESCC | epidermis development | 193/8552 | 324/18723 | 2.87e-07 | 4.19e-06 | 193 |
| GO:000206420 | Esophagus | ESCC | epithelial cell development | 136/8552 | 220/18723 | 9.50e-07 | 1.21e-05 | 136 |
| GO:002261216 | Esophagus | ESCC | gland morphogenesis | 78/8552 | 118/18723 | 5.83e-06 | 6.03e-05 | 78 |
| GO:000991310 | Esophagus | ESCC | epidermal cell differentiation | 122/8552 | 202/18723 | 1.69e-05 | 1.51e-04 | 122 |
| GO:001072010 | Esophagus | ESCC | positive regulation of cell development | 172/8552 | 298/18723 | 1.74e-05 | 1.55e-04 | 172 |
| GO:00420636 | Esophagus | ESCC | gliogenesis | 172/8552 | 301/18723 | 3.75e-05 | 3.04e-04 | 172 |
| Page: 1 2 3 |
| Pathway ID | Tissue | Disease Stage | Description | Gene Ratio | Bg Ratio | pvalue | p.adjust | qvalue | Count |
| Page: 1 |
Top |
Cell-cell communication analysis |
| Identification of potential cell-cell interactions between two cell types and their ligand-receptor pairs for different disease states |
| Ligand | Receptor | LRpair | Pathway | Tissue | Disease Stage |
| Page: 1 |
Top |
Single-cell gene regulatory network inference analysis |
| Find out the significant the regulons (TFs) and the target genes of each regulon across cell types for different disease states |
| TF | Cell Type | Tissue | Disease Stage | Target Gene | RSS | Regulon Activity |
| PAX6 | EE | Colorectum | AD | CACNA2D1,EYS,TUBA1A, etc. | 6.66e-02 |  |
| PAX6 | CT | Colorectum | MSI-H | CACNA2D1,EYS,TUBA1A, etc. | 3.14e-02 |  |
| PAX6 | TUF | Colorectum | MSI-H | CACNA2D1,EYS,TUBA1A, etc. | 2.84e-02 | |
| PAX6 | EE | Colorectum | MSS | CACNA2D1,EYS,TUBA1A, etc. | 2.36e-02 |  |
| PAX6 | EE | Colorectum | SER | CACNA2D1,EYS,TUBA1A, etc. | 1.12e-01 |  |
| ∗The dot plots of a searched regulon are shown for all cell subpopulations in each disease state of each tissue based on the regulon specific score inferred using pySCENIC and by calculating the average expression. |
| Page: 1 |
Top |
Somatic mutation of malignant transformation related genes |
| Annotation of somatic variants for genes involved in malignant transformation |
| Hugo Symbol | Variant Class | Variant Classification | dbSNP RS | HGVSc | HGVSp | HGVSp Short | SWISSPROT | BIOTYPE | SIFT | PolyPhen | Tumor Sample Barcode | Tissue | Histology | Sex | Age | Stage | Therapy Types | Drugs | Outcome |
| PAX6 | SNV | Missense_Mutation | novel | c.734N>T | p.Arg245Ile | p.R245I | protein_coding | deleterious(0) | probably_damaging(0.998) | TCGA-AN-A046-01 | Breast | breast invasive carcinoma | Female | >=65 | I/II | Unknown | Unknown | SD | |
| PAX6 | insertion | Frame_Shift_Ins | novel | c.190_191insTTAGGATGGAA | p.Asn64IlefsTer8 | p.N64Ifs*8 | protein_coding | TCGA-A8-A07Z-01 | Breast | breast invasive carcinoma | Female | >=65 | I/II | Unspecific | Exemestane | SD | |||
| PAX6 | deletion | Frame_Shift_Del | c.1166delN | p.Pro389HisfsTer7 | p.P389Hfs*7 | protein_coding | TCGA-A8-A09Z-01 | Breast | breast invasive carcinoma | Female | >=65 | I/II | Unknown | Unknown | SD | ||||
| PAX6 | SNV | Missense_Mutation | c.595N>C | p.Glu199Gln | p.E199Q | protein_coding | tolerated(0.12) | benign(0.276) | TCGA-LP-A4AW-01 | Cervix | cervical & endocervical cancer | Female | <65 | I/II | Unknown | Unknown | SD | ||
| PAX6 | deletion | Frame_Shift_Del | c.1166delN | p.Pro389HisfsTer7 | p.P389Hfs*7 | protein_coding | TCGA-MA-AA42-01 | Cervix | cervical & endocervical cancer | Female | >=65 | I/II | Unknown | Unknown | SD | ||||
| PAX6 | SNV | Missense_Mutation | c.286N>A | p.Glu96Lys | p.E96K | protein_coding | tolerated(0.23) | possibly_damaging(0.731) | TCGA-A6-6138-01 | Colorectum | colon adenocarcinoma | Male | <65 | I/II | Unknown | Unknown | SD | ||
| PAX6 | SNV | Missense_Mutation | rs755528147 | c.1031C>T | p.Pro344Leu | p.P344L | protein_coding | deleterious(0.04) | possibly_damaging(0.755) | TCGA-AA-3811-01 | Colorectum | colon adenocarcinoma | Female | >=65 | III/IV | Unknown | Unknown | PD | |
| PAX6 | SNV | Missense_Mutation | c.1022N>A | p.Ser341Asn | p.S341N | protein_coding | tolerated(0.17) | benign(0.125) | TCGA-AA-3950-01 | Colorectum | colon adenocarcinoma | Female | >=65 | I/II | Unknown | Unknown | SD | ||
| PAX6 | SNV | Missense_Mutation | novel | c.1057A>G | p.Asn353Asp | p.N353D | protein_coding | tolerated(0.06) | benign(0.352) | TCGA-AZ-4315-01 | Colorectum | colon adenocarcinoma | Male | <65 | I/II | Unknown | Unknown | SD | |
| PAX6 | SNV | Missense_Mutation | novel | c.416N>T | p.Arg139Ile | p.R139I | protein_coding | deleterious(0) | possibly_damaging(0.486) | TCGA-CA-6717-01 | Colorectum | colon adenocarcinoma | Male | <65 | I/II | Chemotherapy | oxaliplatin | CR |
| Page: 1 2 3 4 5 6 7 8 9 10 |
Top |
Related drugs of malignant transformation related genes |
| Identification of chemicals and drugs interact with genes involved in malignant transfromation |
| (DGIdb 4.0) |
| Entrez ID | Symbol | Category | Interaction Types | Drug Claim Name | Drug Name | PMIDs |
| Page: 1 |

Copyright 2023-Present -The University of Texas Health Science Center at Houston |