
|
|||||
|
 | |
| |
| |
| |
| |
| |
|
Gene: PAWR |
Gene summary for PAWR |
| Gene information | Species | Human | Gene symbol | PAWR | Gene ID | 5074 |
| Gene name | pro-apoptotic WT1 regulator | |
| Gene Alias | PAR4 | |
| Cytomap | 12q21.2 | |
| Gene Type | protein-coding | GO ID | GO:0000122 | UniProtAcc | Q96IZ0 |
Top |
Malignant transformation analysis |
| Identification of the aberrant gene expression in precancerous and cancerous lesions by comparing the gene expression of stem-like cells in diseased tissues with normal stem cells |
| Entrez ID | Symbol | Replicates | Species | Organ | Tissue | Adj P-value | Log2FC | Malignancy |
| 5074 | PAWR | CA_HPV_1 | Human | Cervix | CC | 1.54e-08 | -2.40e-01 | 0.0264 |
| 5074 | PAWR | CA_HPV_3 | Human | Cervix | CC | 5.69e-09 | 2.93e-01 | 0.0414 |
| 5074 | PAWR | HSIL_HPV_1 | Human | Cervix | HSIL_HPV | 7.70e-03 | -1.98e-01 | 0.0116 |
| 5074 | PAWR | CCI_1 | Human | Cervix | CC | 1.10e-05 | 9.38e-01 | 0.528 |
| 5074 | PAWR | CCI_2 | Human | Cervix | CC | 5.44e-04 | 1.37e+00 | 0.5249 |
| 5074 | PAWR | CCI_3 | Human | Cervix | CC | 1.82e-06 | 7.29e-01 | 0.516 |
| 5074 | PAWR | sample3 | Human | Cervix | CC | 5.79e-09 | 3.31e-01 | 0.1387 |
| 5074 | PAWR | T3 | Human | Cervix | CC | 5.20e-16 | 3.42e-01 | 0.1389 |
| 5074 | PAWR | HTA11_3410_2000001011 | Human | Colorectum | AD | 1.54e-06 | -3.11e-01 | 0.0155 |
| 5074 | PAWR | HTA11_1938_2000001011 | Human | Colorectum | AD | 4.31e-09 | 6.36e-01 | -0.0811 |
| 5074 | PAWR | HTA11_347_2000001011 | Human | Colorectum | AD | 1.28e-24 | 8.29e-01 | -0.1954 |
| 5074 | PAWR | HTA11_411_2000001011 | Human | Colorectum | SER | 8.26e-04 | 4.79e-01 | -0.2602 |
| 5074 | PAWR | HTA11_9341_2000001011 | Human | Colorectum | SER | 1.05e-02 | -4.12e-01 | -0.00410000000000005 |
| 5074 | PAWR | HTA11_9408_2000001011 | Human | Colorectum | AD | 8.55e-04 | -6.26e-01 | 0.0451 |
| 5074 | PAWR | HTA11_8622_2000001021 | Human | Colorectum | SER | 3.20e-04 | -4.93e-01 | 0.0528 |
| 5074 | PAWR | HTA11_99999965062_69753 | Human | Colorectum | MSI-H | 1.22e-02 | 6.29e-01 | 0.3487 |
| 5074 | PAWR | HTA11_99999965104_69814 | Human | Colorectum | MSS | 7.60e-03 | 4.08e-01 | 0.281 |
| 5074 | PAWR | HTA11_99999973899_84307 | Human | Colorectum | MSS | 3.58e-02 | -5.49e-01 | 0.2585 |
| 5074 | PAWR | HTA11_99999974143_84620 | Human | Colorectum | MSS | 1.52e-15 | -6.04e-01 | 0.3005 |
| 5074 | PAWR | F007 | Human | Colorectum | FAP | 8.94e-08 | -4.51e-01 | 0.1176 |
| Page: 1 2 3 4 5 6 7 8 9 10 |
| Tissue | Expression Dynamics | Abbreviation |
| Cervix |  | CC: Cervix cancer |
| HSIL_HPV: HPV-infected high-grade squamous intraepithelial lesions | ||
| N_HPV: HPV-infected normal cervix | ||
| Colorectum (GSE201348) |  | FAP: Familial adenomatous polyposis |
| CRC: Colorectal cancer | ||
| Colorectum (HTA11) |  | AD: Adenomas |
| SER: Sessile serrated lesions | ||
| MSI-H: Microsatellite-high colorectal cancer | ||
| MSS: Microsatellite stable colorectal cancer | ||
| Esophagus | 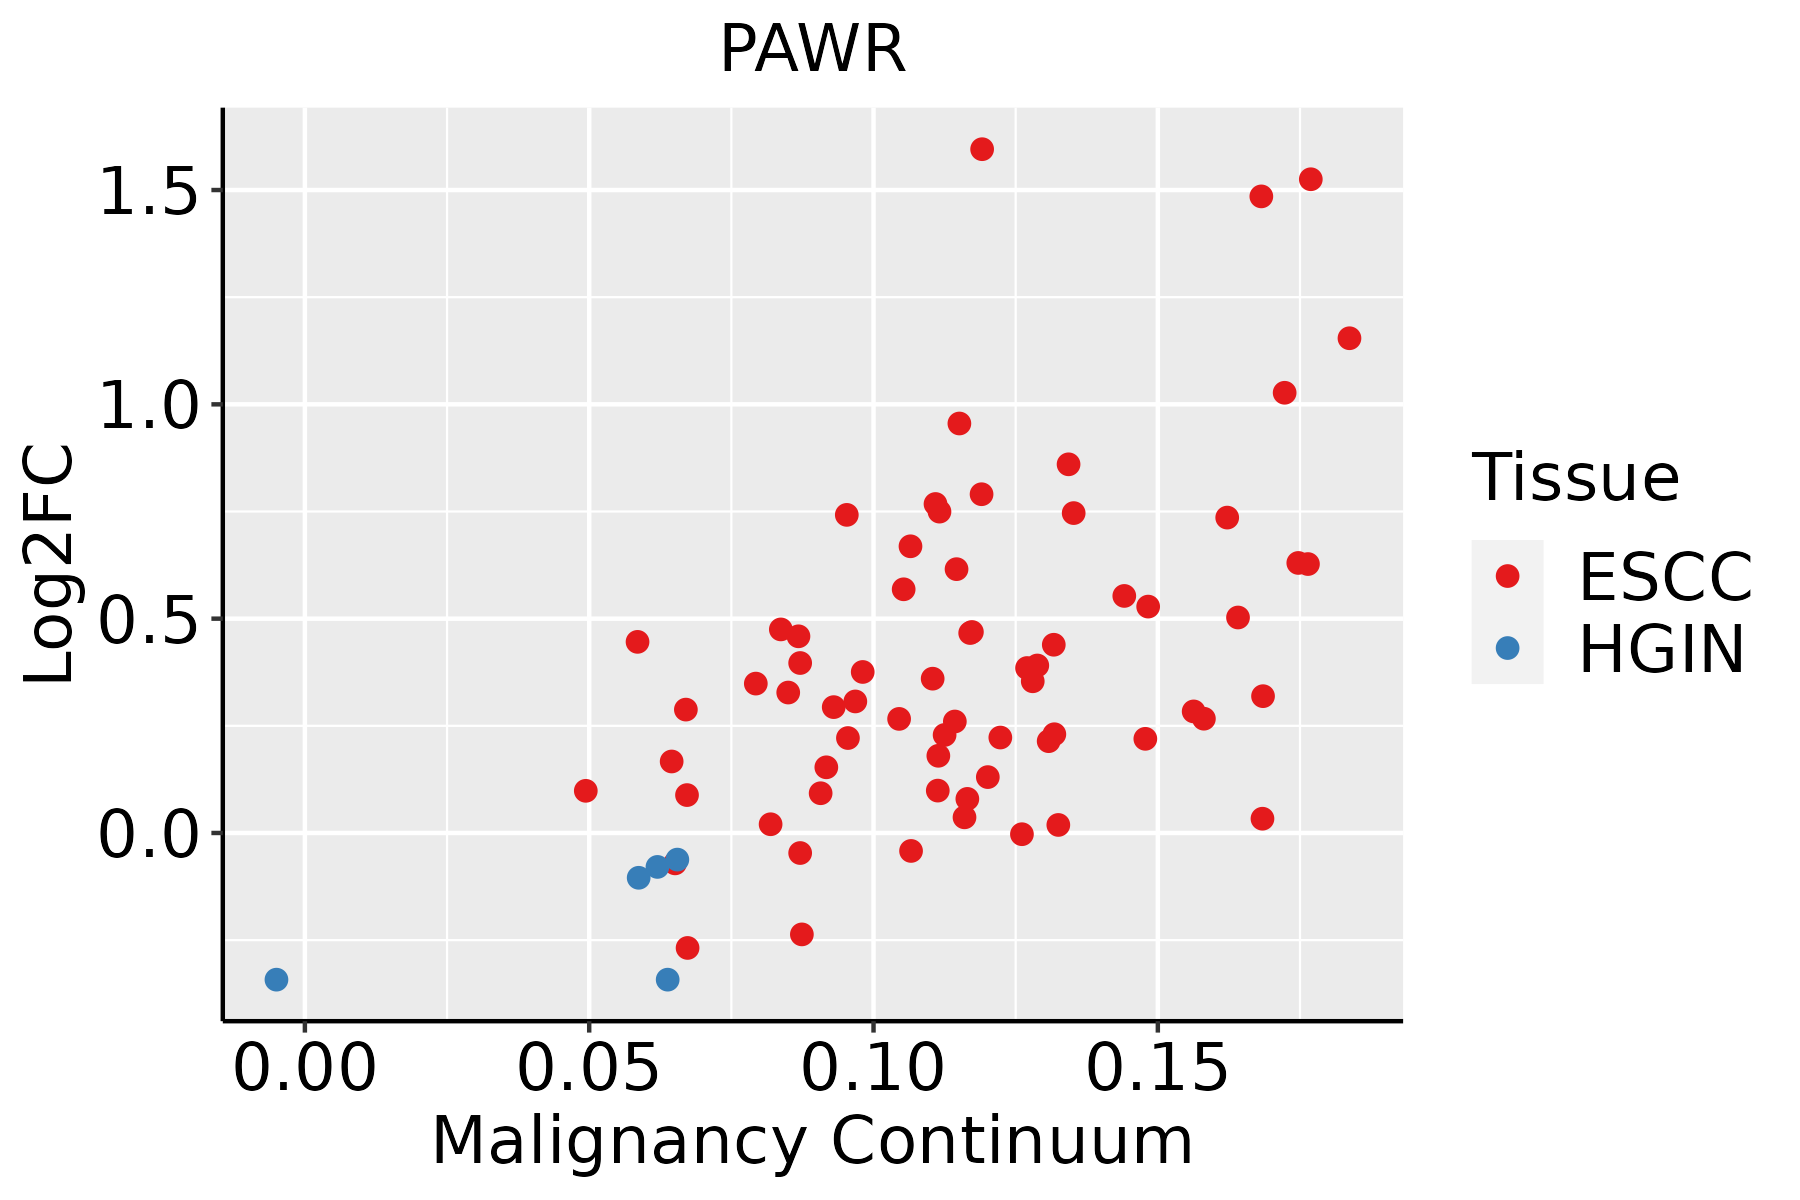 | ESCC: Esophageal squamous cell carcinoma |
| HGIN: High-grade intraepithelial neoplasias | ||
| LGIN: Low-grade intraepithelial neoplasias | ||
| Liver |  | HCC: Hepatocellular carcinoma |
| NAFLD: Non-alcoholic fatty liver disease | ||
| Oral Cavity | 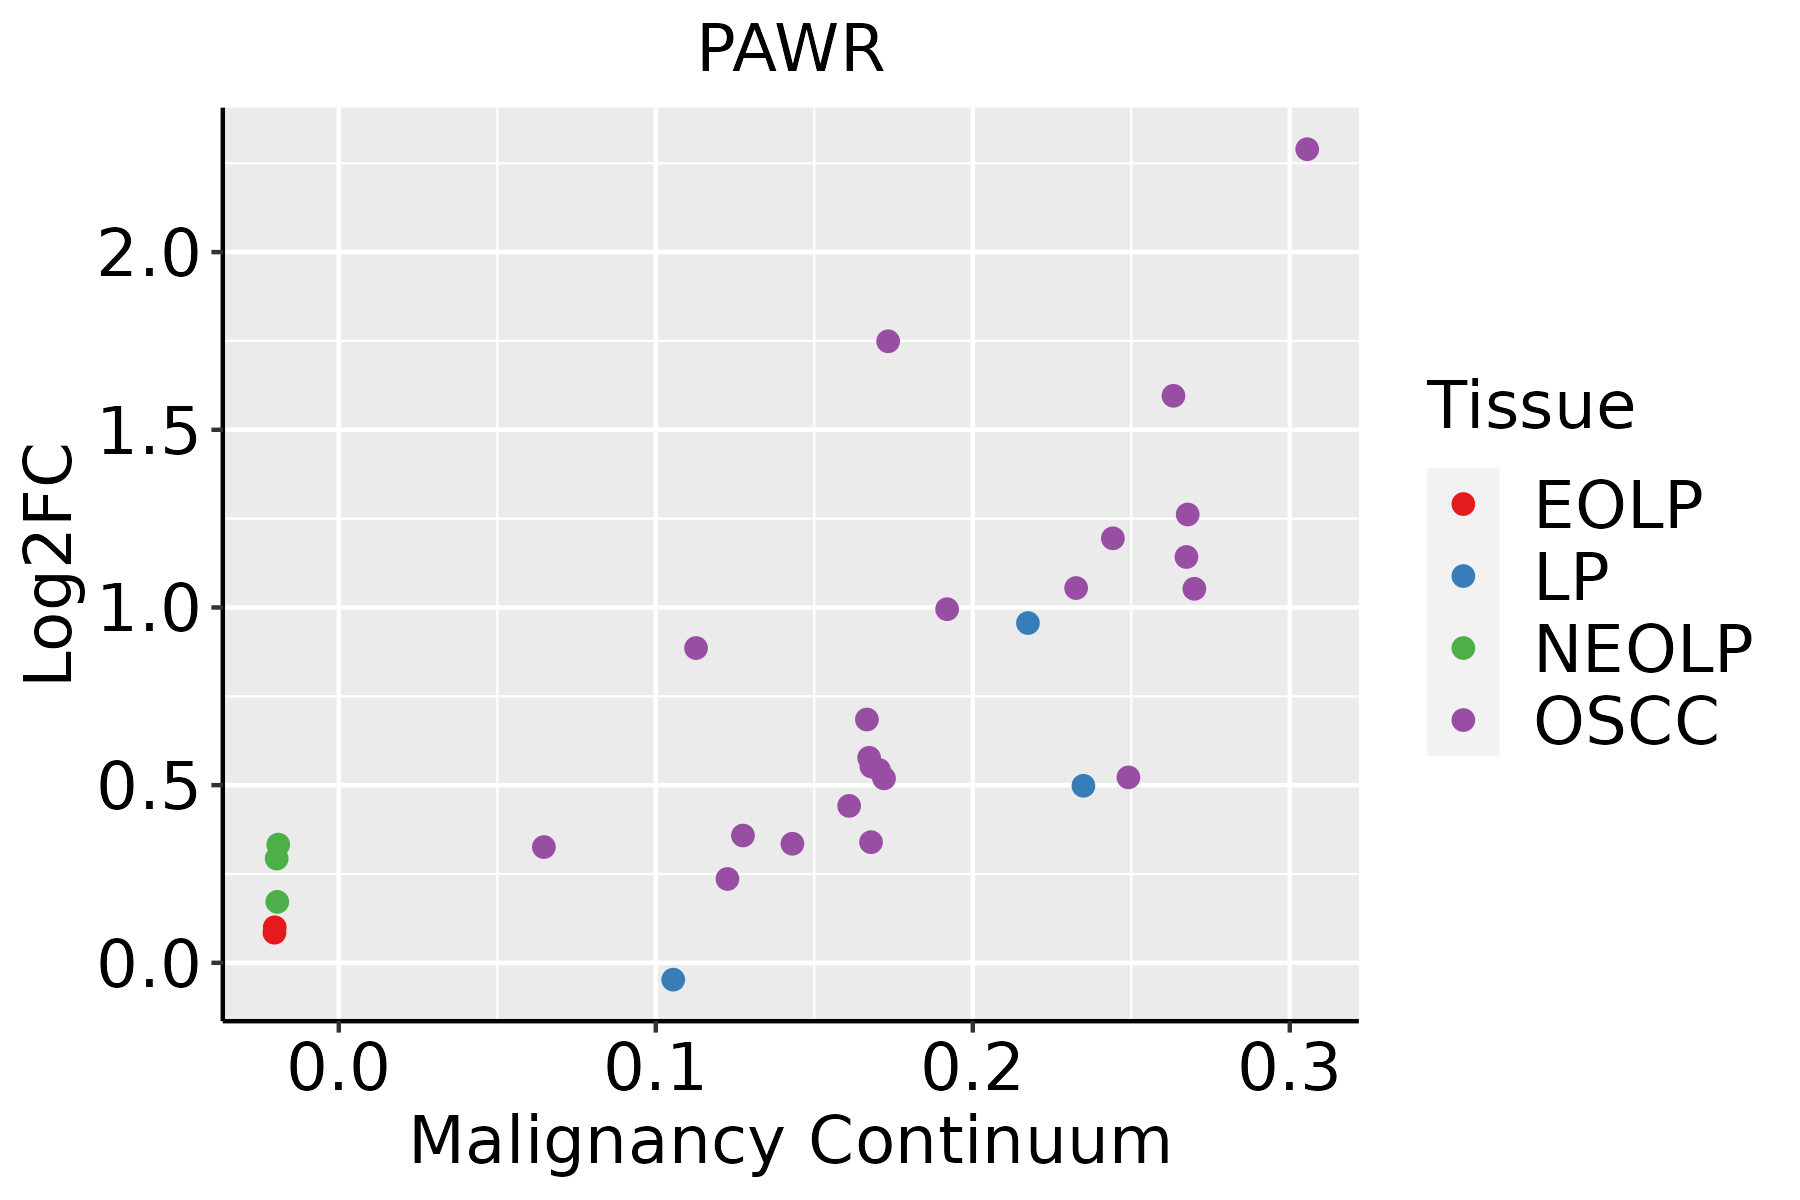 | EOLP: Erosive Oral lichen planus |
| LP: leukoplakia | ||
| NEOLP: Non-erosive oral lichen planus | ||
| OSCC: Oral squamous cell carcinoma | ||
| Prostate | 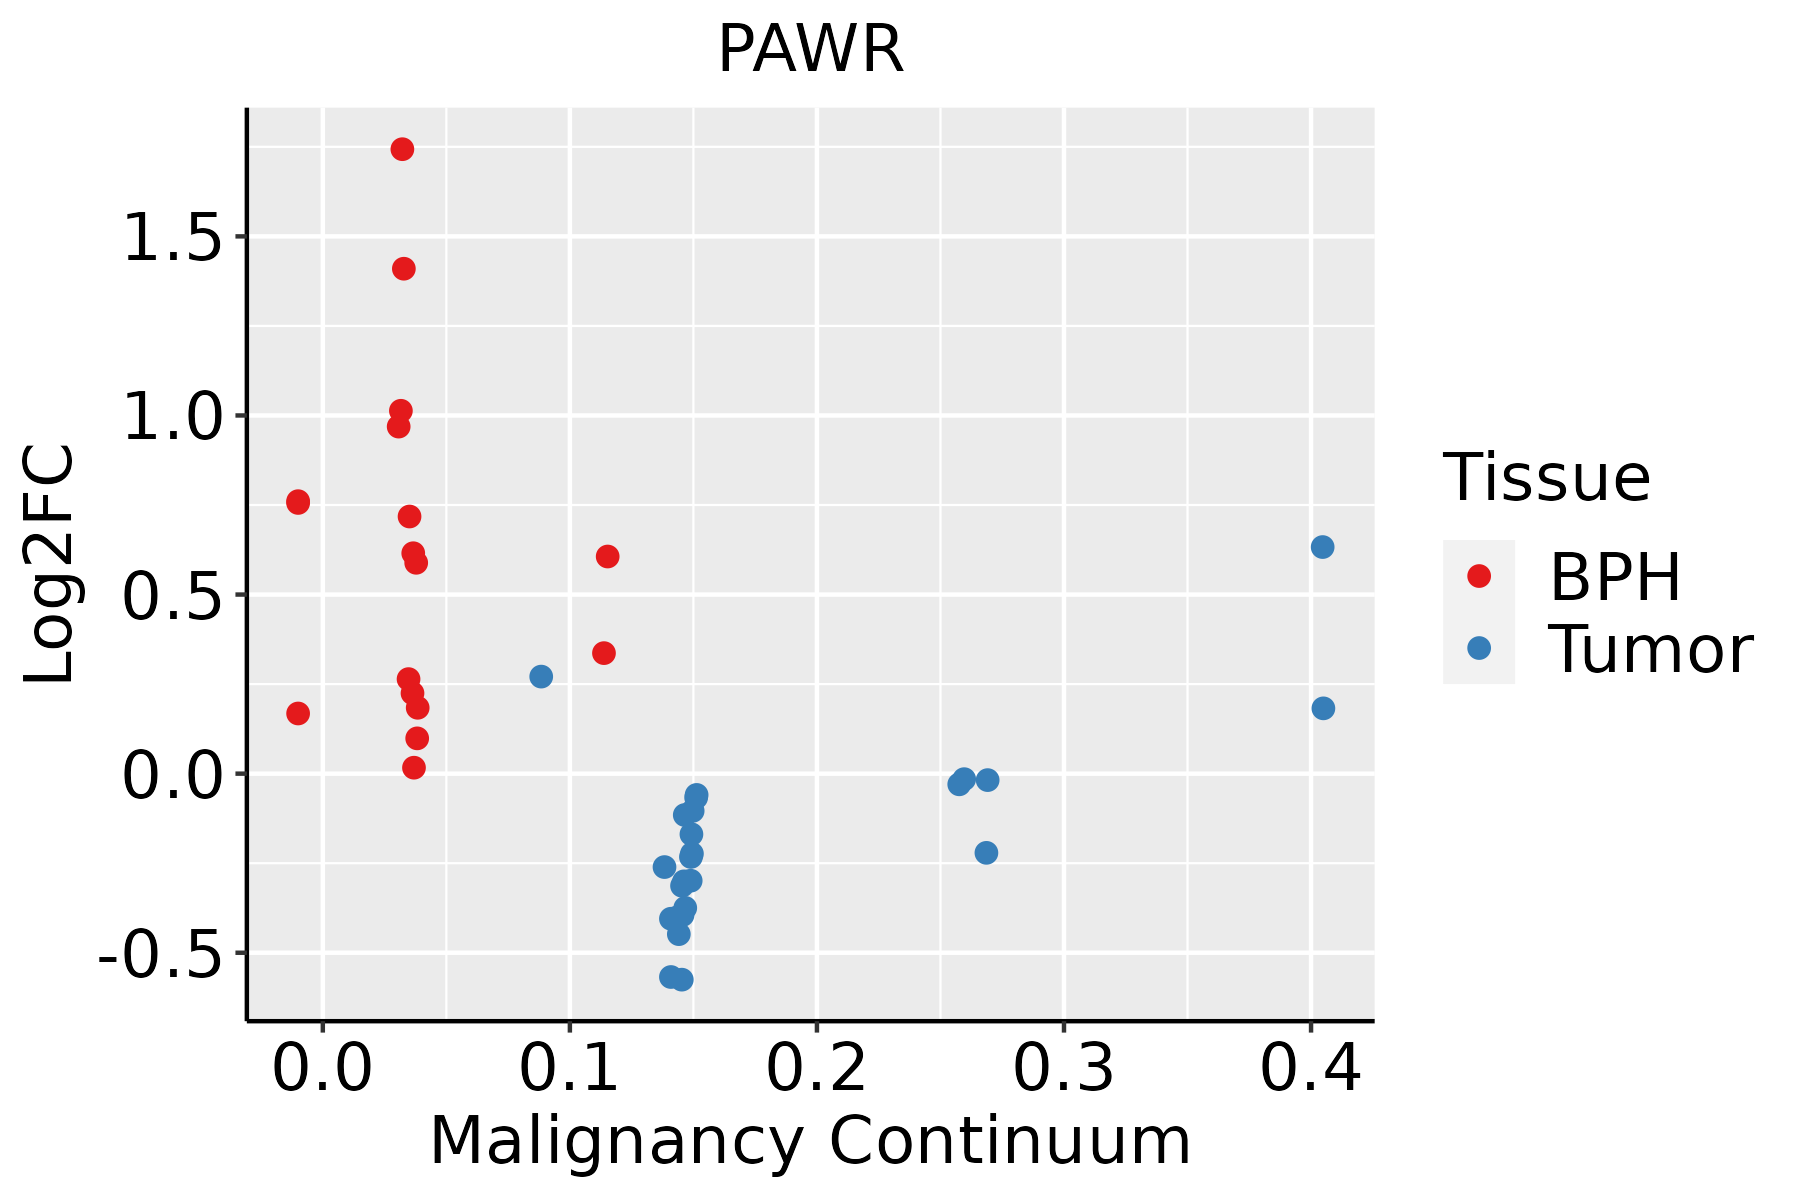 | BPH: Benign Prostatic Hyperplasia |
| Skin |  | AK: Actinic keratosis |
| cSCC: Cutaneous squamous cell carcinoma | ||
| SCCIS:squamous cell carcinoma in situ | ||
| Thyroid |  | ATC: Anaplastic thyroid cancer |
| HT: Hashimoto's thyroiditis | ||
| PTC: Papillary thyroid cancer |
| ∗log2FC in expression of this searched gene in stem-like cells from each diseased tissue sample relative to stem-like cells in normal samples in each tissue plotted against the malignancy continuum. Samples are colored based on if they are from different disease stage. |
Top |
Malignant transformation related pathway analysis |
| Find out the enriched GO biological processes and KEGG pathways involved in transition from healthy to precancer to cancer |
| Tissue | Disease Stage | Enriched GO biological Processes |
| Colorectum | AD |  |
| Colorectum | SER |  |
| Colorectum | MSS |  |
| Colorectum | MSI-H |  |
| Colorectum | FAP |  |
| ∗Top 15 enriched GO BP terms are showed in the bar plot of each disease state in each tissue. Each row represents a significant GO biological process which is colored according to the -log10(p.adjust). |
| Page: 1 2 3 4 5 6 7 8 9 |
| GO ID | Tissue | Disease Stage | Description | Gene Ratio | Bg Ratio | pvalue | p.adjust | Count |
| GO:000701510 | Cervix | CC | actin filament organization | 109/2311 | 442/18723 | 4.92e-13 | 2.45e-10 | 109 |
| GO:002240710 | Cervix | CC | regulation of cell-cell adhesion | 103/2311 | 448/18723 | 1.78e-10 | 2.87e-08 | 103 |
| GO:000697910 | Cervix | CC | response to oxidative stress | 102/2311 | 446/18723 | 2.99e-10 | 4.36e-08 | 102 |
| GO:00421108 | Cervix | CC | T cell activation | 107/2311 | 487/18723 | 1.24e-09 | 1.46e-07 | 107 |
| GO:00508638 | Cervix | CC | regulation of T cell activation | 80/2311 | 329/18723 | 1.28e-09 | 1.47e-07 | 80 |
| GO:00071598 | Cervix | CC | leukocyte cell-cell adhesion | 85/2311 | 371/18723 | 8.27e-09 | 7.07e-07 | 85 |
| GO:00071626 | Cervix | CC | negative regulation of cell adhesion | 72/2311 | 303/18723 | 2.36e-08 | 1.70e-06 | 72 |
| GO:00026837 | Cervix | CC | negative regulation of immune system process | 94/2311 | 434/18723 | 2.63e-08 | 1.87e-06 | 94 |
| GO:19030378 | Cervix | CC | regulation of leukocyte cell-cell adhesion | 77/2311 | 336/18723 | 4.08e-08 | 2.54e-06 | 77 |
| GO:000030210 | Cervix | CC | response to reactive oxygen species | 56/2311 | 222/18723 | 1.00e-07 | 5.25e-06 | 56 |
| GO:006219710 | Cervix | CC | cellular response to chemical stress | 76/2311 | 337/18723 | 1.01e-07 | 5.25e-06 | 76 |
| GO:00027644 | Cervix | CC | immune response-regulating signaling pathway | 97/2311 | 468/18723 | 1.49e-07 | 7.07e-06 | 97 |
| GO:006157210 | Cervix | CC | actin filament bundle organization | 44/2311 | 161/18723 | 2.08e-07 | 9.34e-06 | 44 |
| GO:005101710 | Cervix | CC | actin filament bundle assembly | 43/2311 | 157/18723 | 2.66e-07 | 1.12e-05 | 43 |
| GO:00075689 | Cervix | CC | aging | 75/2311 | 339/18723 | 2.75e-07 | 1.13e-05 | 75 |
| GO:004254210 | Cervix | CC | response to hydrogen peroxide | 40/2311 | 146/18723 | 6.79e-07 | 2.46e-05 | 40 |
| GO:00420988 | Cervix | CC | T cell proliferation | 49/2311 | 199/18723 | 1.32e-06 | 4.49e-05 | 49 |
| GO:00224084 | Cervix | CC | negative regulation of cell-cell adhesion | 48/2311 | 196/18723 | 1.99e-06 | 6.18e-05 | 48 |
| GO:00421297 | Cervix | CC | regulation of T cell proliferation | 43/2311 | 171/18723 | 3.21e-06 | 8.77e-05 | 43 |
| GO:003459910 | Cervix | CC | cellular response to oxidative stress | 63/2311 | 288/18723 | 3.58e-06 | 9.50e-05 | 63 |
| Page: 1 2 3 4 5 6 7 8 9 10 11 12 13 14 15 16 17 18 19 20 21 22 23 24 25 26 27 28 29 30 |
| Pathway ID | Tissue | Disease Stage | Description | Gene Ratio | Bg Ratio | pvalue | p.adjust | qvalue | Count |
| Page: 1 |
Top |
Cell-cell communication analysis |
| Identification of potential cell-cell interactions between two cell types and their ligand-receptor pairs for different disease states |
| Ligand | Receptor | LRpair | Pathway | Tissue | Disease Stage |
| Page: 1 |
Top |
Single-cell gene regulatory network inference analysis |
| Find out the significant the regulons (TFs) and the target genes of each regulon across cell types for different disease states |
| TF | Cell Type | Tissue | Disease Stage | Target Gene | RSS | Regulon Activity |
| ∗The dot plots of a searched regulon are shown for all cell subpopulations in each disease state of each tissue based on the regulon specific score inferred using pySCENIC and by calculating the average expression. |
| Page: 1 |
Top |
Somatic mutation of malignant transformation related genes |
| Annotation of somatic variants for genes involved in malignant transformation |
| Hugo Symbol | Variant Class | Variant Classification | dbSNP RS | HGVSc | HGVSp | HGVSp Short | SWISSPROT | BIOTYPE | SIFT | PolyPhen | Tumor Sample Barcode | Tissue | Histology | Sex | Age | Stage | Therapy Types | Drugs | Outcome |
| PAWR | deletion | Frame_Shift_Del | novel | c.793delN | p.Ser265ValfsTer15 | p.S265Vfs*15 | Q96IZ0 | protein_coding | TCGA-EW-A2FV-01 | Breast | breast invasive carcinoma | Female | <65 | III/IV | Chemotherapy | docetaxel | SD | ||
| PAWR | SNV | Missense_Mutation | novel | c.691N>C | p.Ser231Arg | p.S231R | Q96IZ0 | protein_coding | tolerated(0.53) | benign(0.109) | TCGA-2W-A8YY-01 | Cervix | cervical & endocervical cancer | Female | <65 | I/II | Chemotherapy | cisplatin | CR |
| PAWR | SNV | Missense_Mutation | novel | c.842N>A | p.Arg281Lys | p.R281K | Q96IZ0 | protein_coding | tolerated(0.66) | benign(0.001) | TCGA-VS-A9V3-01 | Cervix | cervical & endocervical cancer | Female | <65 | I/II | Chemotherapy | cisplatin | PD |
| PAWR | SNV | Missense_Mutation | c.740N>A | p.Ser247Asn | p.S247N | Q96IZ0 | protein_coding | tolerated(0.05) | benign(0.215) | TCGA-CK-6751-01 | Colorectum | colon adenocarcinoma | Female | >=65 | I/II | Unknown | Unknown | SD | |
| PAWR | SNV | Missense_Mutation | c.50N>T | p.Thr17Ile | p.T17I | Q96IZ0 | protein_coding | deleterious(0) | possibly_damaging(0.55) | TCGA-DM-A280-01 | Colorectum | colon adenocarcinoma | Female | >=65 | I/II | Unknown | Unknown | SD | |
| PAWR | SNV | Missense_Mutation | c.920N>C | p.Ile307Thr | p.I307T | Q96IZ0 | protein_coding | deleterious(0) | probably_damaging(0.996) | TCGA-AF-2690-01 | Colorectum | rectum adenocarcinoma | Female | >=65 | III/IV | Unknown | Unknown | SD | |
| PAWR | SNV | Missense_Mutation | rs768593781 | c.728N>A | p.Arg243Gln | p.R243Q | Q96IZ0 | protein_coding | deleterious(0.03) | possibly_damaging(0.836) | TCGA-AG-A002-01 | Colorectum | rectum adenocarcinoma | Male | <65 | I/II | Unknown | Unknown | SD |
| PAWR | SNV | Missense_Mutation | novel | c.863G>A | p.Arg288Lys | p.R288K | Q96IZ0 | protein_coding | deleterious(0.04) | benign(0.187) | TCGA-EI-6917-01 | Colorectum | rectum adenocarcinoma | Male | <65 | III/IV | Chemotherapy | 5fluorouracil+oxaciplatina+l-folinian | SD |
| PAWR | deletion | Frame_Shift_Del | c.809delN | p.Lys270ArgfsTer10 | p.K270Rfs*10 | Q96IZ0 | protein_coding | TCGA-A6-5665-01 | Colorectum | colon adenocarcinoma | Female | >=65 | I/II | Unknown | Unknown | PD | |||
| PAWR | SNV | Missense_Mutation | novel | c.807A>C | p.Glu269Asp | p.E269D | Q96IZ0 | protein_coding | deleterious(0.02) | possibly_damaging(0.838) | TCGA-A5-A0G2-01 | Endometrium | uterine corpus endometrioid carcinoma | Female | <65 | III/IV | Unknown | Unknown | SD |
| Page: 1 2 3 |
Top |
Related drugs of malignant transformation related genes |
| Identification of chemicals and drugs interact with genes involved in malignant transfromation |
| (DGIdb 4.0) |
| Entrez ID | Symbol | Category | Interaction Types | Drug Claim Name | Drug Name | PMIDs |
| Page: 1 |

Copyright 2023-Present -The University of Texas Health Science Center at Houston |