
|
|||||
|
 | |
| |
| |
| |
| |
| |
|
Gene: PATJ |
Gene summary for PATJ |
| Gene information | Species | Human | Gene symbol | PATJ | Gene ID | 10207 |
| Gene name | PATJ crumbs cell polarity complex component | |
| Gene Alias | Cipp | |
| Cytomap | 1p31.3 | |
| Gene Type | protein-coding | GO ID | GO:0000226 | UniProtAcc | NA |
Top |
Malignant transformation analysis |
| Identification of the aberrant gene expression in precancerous and cancerous lesions by comparing the gene expression of stem-like cells in diseased tissues with normal stem cells |
| Entrez ID | Symbol | Replicates | Species | Organ | Tissue | Adj P-value | Log2FC | Malignancy |
| 10207 | PATJ | GSM4909292 | Human | Breast | IDC | 3.40e-02 | 5.92e-01 | 0.1236 |
| 10207 | PATJ | GSM4909293 | Human | Breast | IDC | 1.03e-09 | 2.43e-01 | 0.1581 |
| 10207 | PATJ | GSM4909298 | Human | Breast | IDC | 5.10e-06 | 1.64e-01 | 0.1551 |
| 10207 | PATJ | GSM4909299 | Human | Breast | IDC | 1.06e-03 | 1.68e-01 | 0.035 |
| 10207 | PATJ | GSM4909302 | Human | Breast | IDC | 2.43e-03 | 3.37e-01 | 0.1545 |
| 10207 | PATJ | GSM4909304 | Human | Breast | IDC | 2.45e-02 | 1.07e-01 | 0.1636 |
| 10207 | PATJ | GSM4909311 | Human | Breast | IDC | 2.62e-02 | 8.69e-02 | 0.1534 |
| 10207 | PATJ | GSM4909317 | Human | Breast | IDC | 2.79e-03 | 2.44e-01 | 0.1355 |
| 10207 | PATJ | M1 | Human | Breast | IDC | 2.82e-08 | 4.00e-01 | 0.1577 |
| 10207 | PATJ | NCCBC3 | Human | Breast | DCIS | 1.01e-02 | 2.31e-01 | 0.1198 |
| 10207 | PATJ | DCIS2 | Human | Breast | DCIS | 3.88e-78 | 5.60e-01 | 0.0085 |
| 10207 | PATJ | CA_HPV_1 | Human | Cervix | CC | 4.64e-07 | -2.05e-01 | 0.0264 |
| 10207 | PATJ | CA_HPV_3 | Human | Cervix | CC | 2.72e-03 | 1.14e-01 | 0.0414 |
| 10207 | PATJ | CCI_1 | Human | Cervix | CC | 5.45e-16 | 1.68e+00 | 0.528 |
| 10207 | PATJ | CCI_2 | Human | Cervix | CC | 3.11e-14 | 1.45e+00 | 0.5249 |
| 10207 | PATJ | CCI_3 | Human | Cervix | CC | 1.93e-32 | 1.91e+00 | 0.516 |
| 10207 | PATJ | CCII_1 | Human | Cervix | CC | 3.15e-02 | 3.28e-01 | 0.3249 |
| 10207 | PATJ | Tumor | Human | Cervix | CC | 8.42e-11 | -2.27e-01 | 0.1241 |
| 10207 | PATJ | HTA11_1938_2000001011 | Human | Colorectum | AD | 7.67e-11 | 6.35e-01 | -0.0811 |
| 10207 | PATJ | HTA11_78_2000001011 | Human | Colorectum | AD | 1.46e-03 | 5.39e-01 | -0.1088 |
| Page: 1 2 3 4 5 6 7 8 9 |
| Tissue | Expression Dynamics | Abbreviation |
| Breast |  | IDC: Invasive ductal carcinoma |
| DCIS: Ductal carcinoma in situ | ||
| Precancer(BRCA1-mut): Precancerous lesion from BRCA1 mutation carriers | ||
| Cervix | 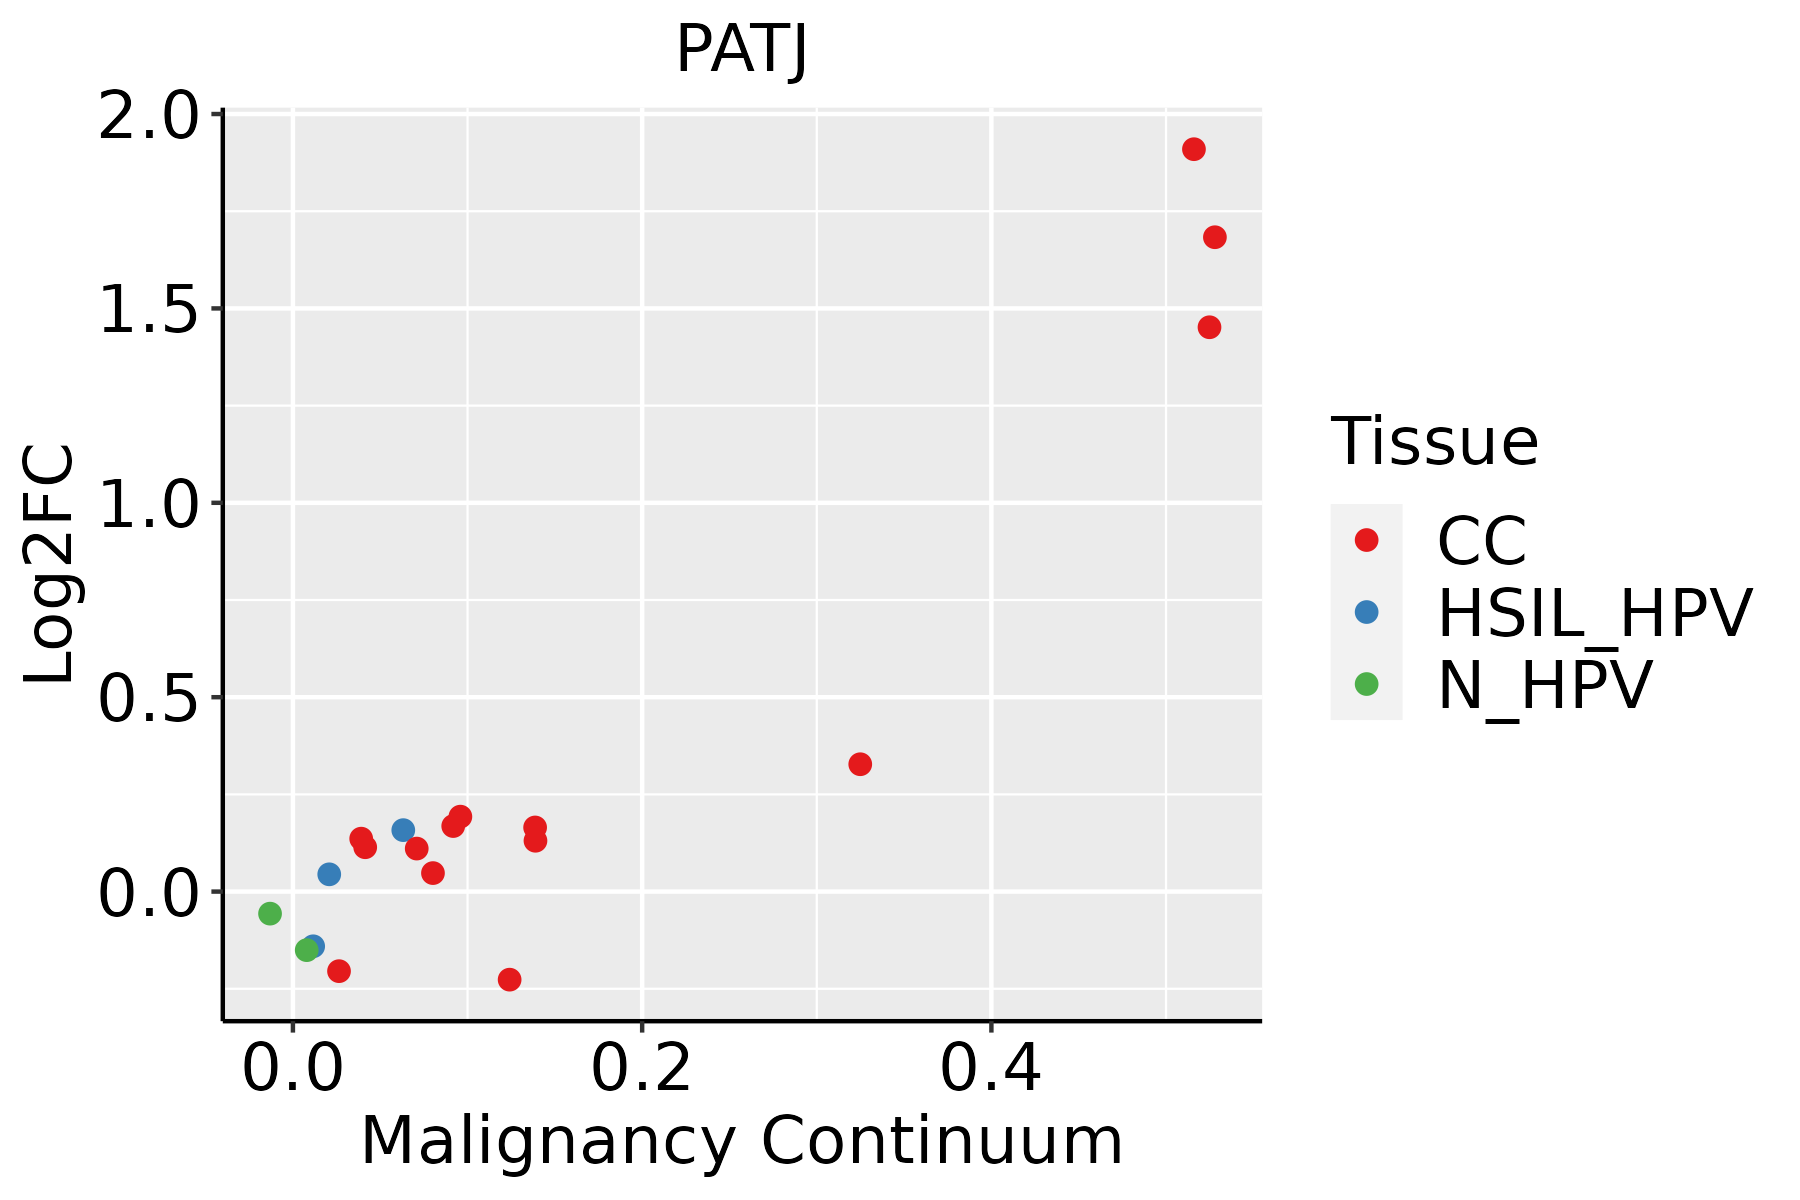 | CC: Cervix cancer |
| HSIL_HPV: HPV-infected high-grade squamous intraepithelial lesions | ||
| N_HPV: HPV-infected normal cervix | ||
| Colorectum (GSE201348) |  | FAP: Familial adenomatous polyposis |
| CRC: Colorectal cancer | ||
| Colorectum (HTA11) |  | AD: Adenomas |
| SER: Sessile serrated lesions | ||
| MSI-H: Microsatellite-high colorectal cancer | ||
| MSS: Microsatellite stable colorectal cancer | ||
| Endometrium | 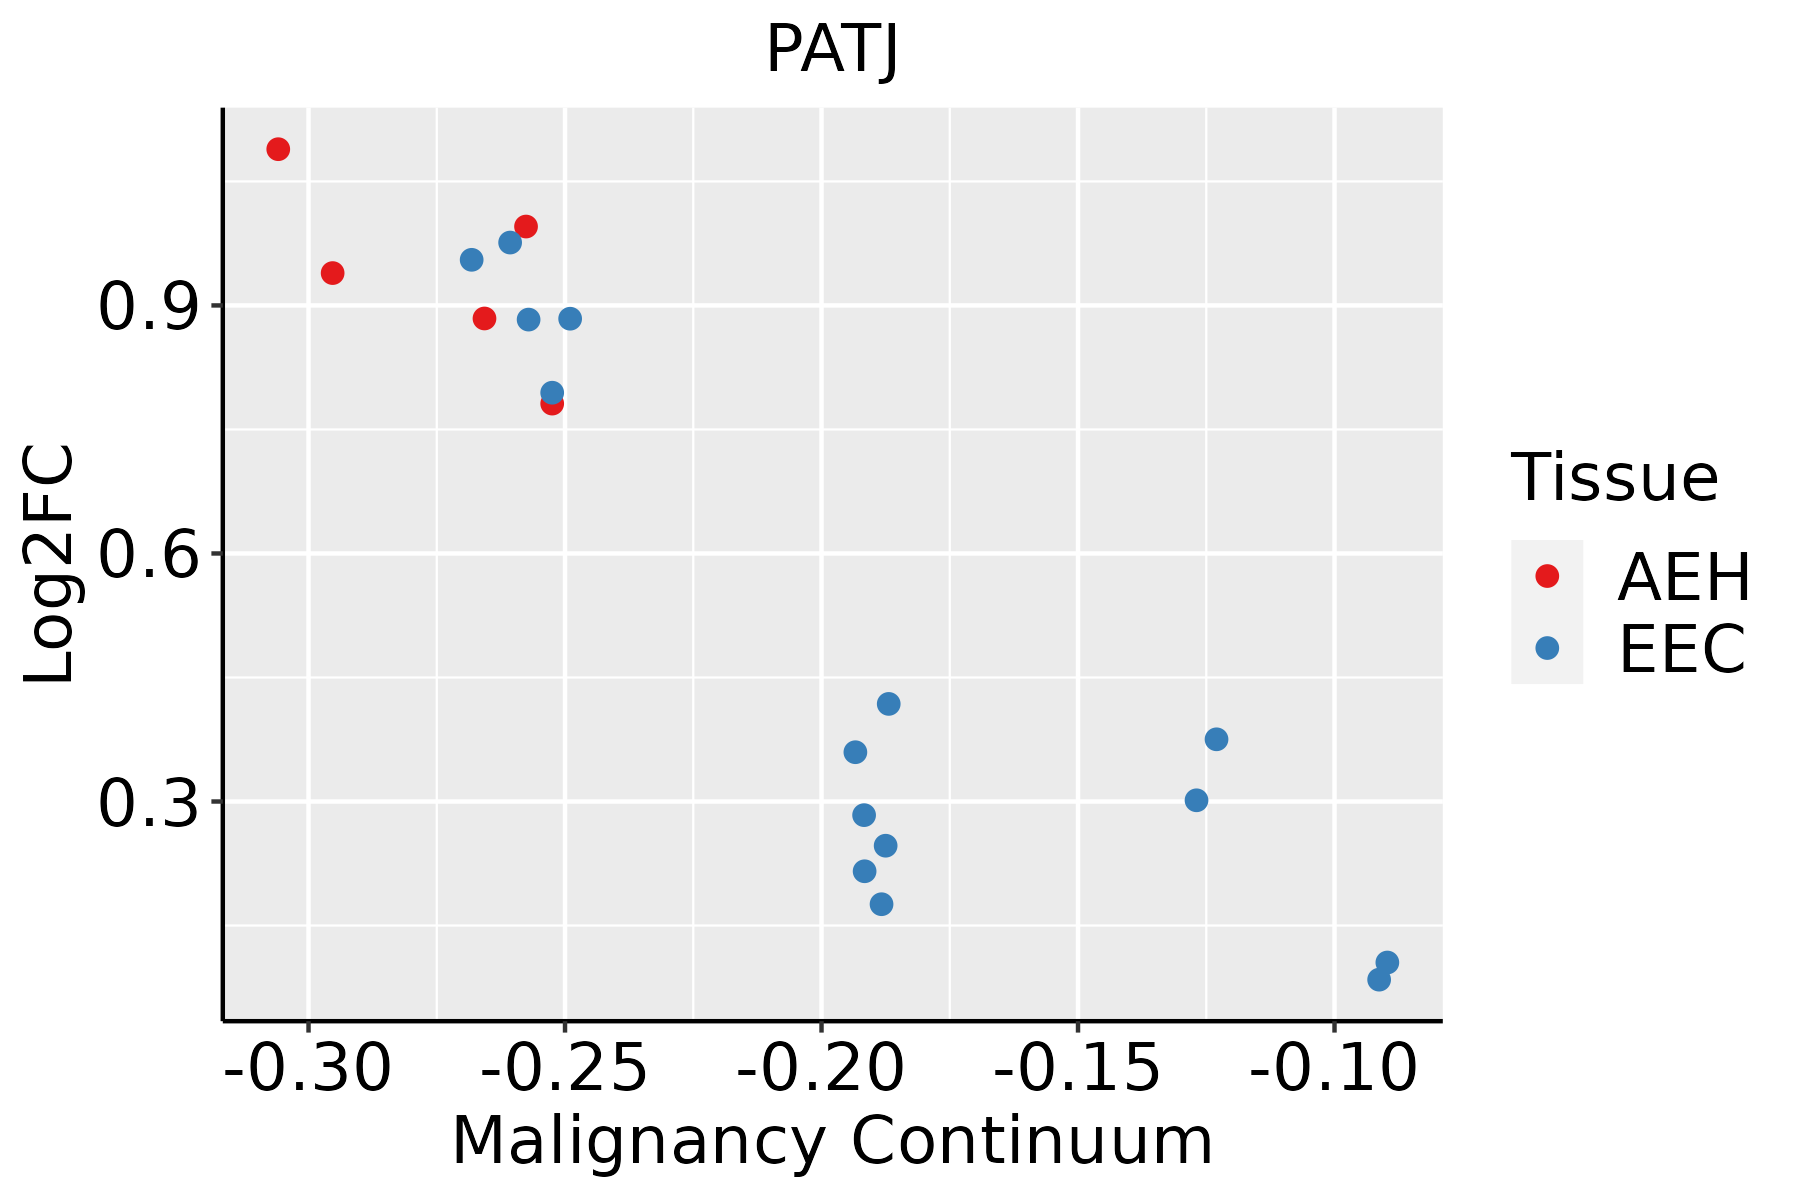 | AEH: Atypical endometrial hyperplasia |
| EEC: Endometrioid Cancer | ||
| Liver | 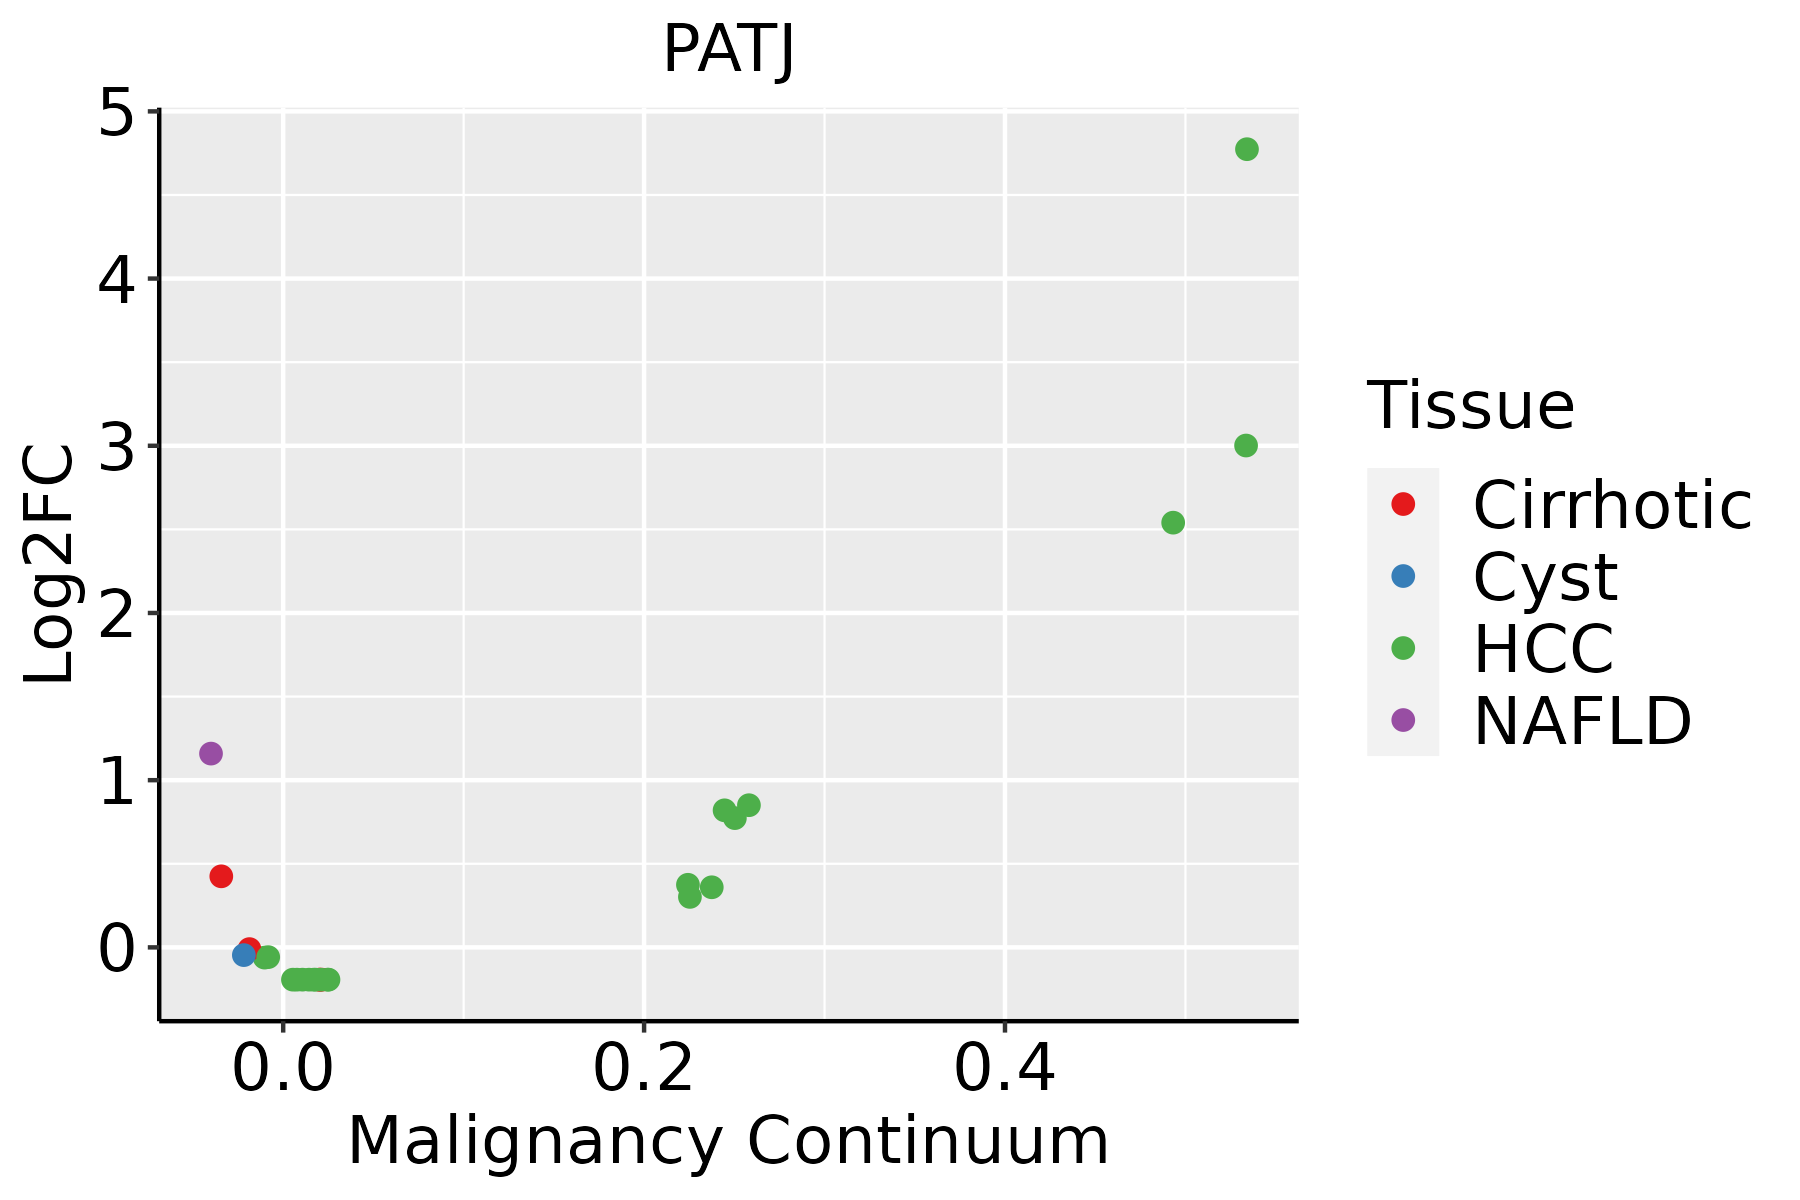 | HCC: Hepatocellular carcinoma |
| NAFLD: Non-alcoholic fatty liver disease | ||
| Lung | 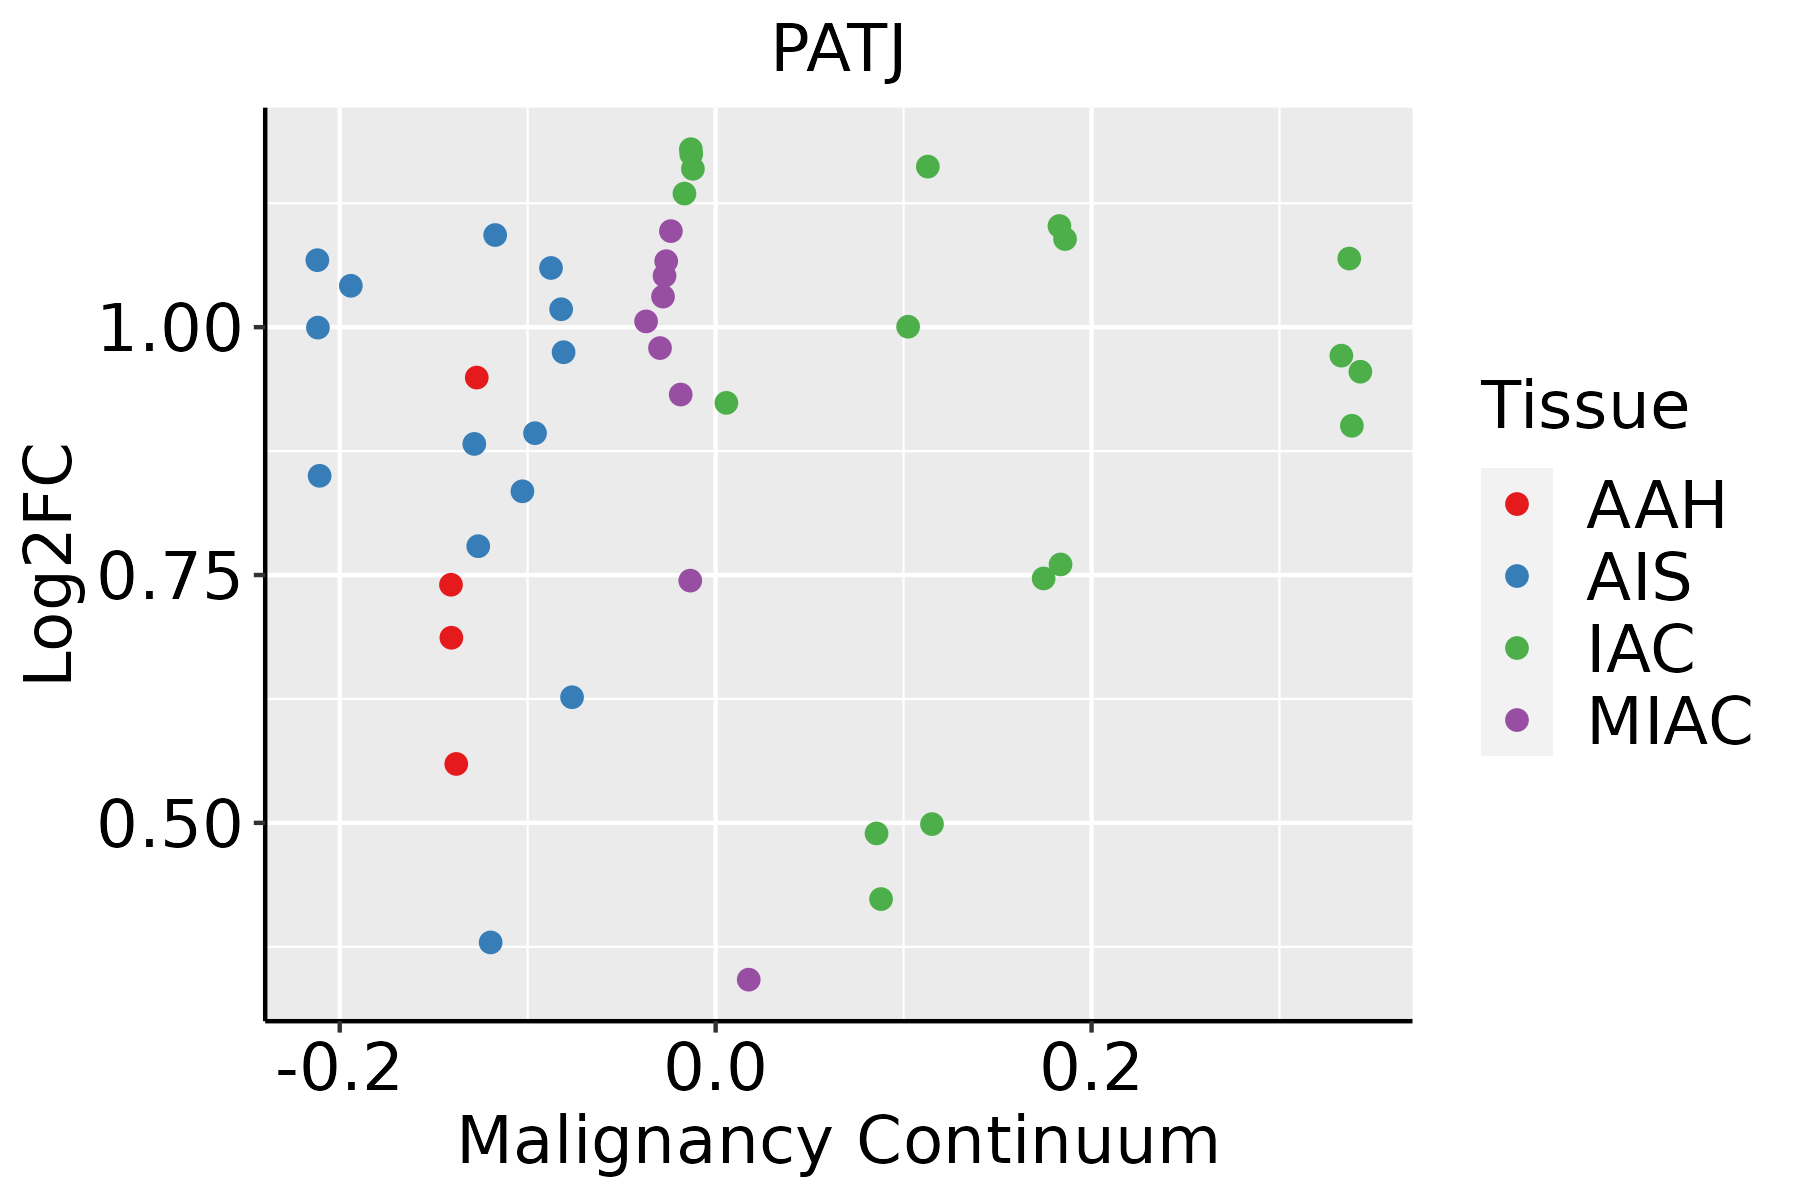 | AAH: Atypical adenomatous hyperplasia |
| AIS: Adenocarcinoma in situ | ||
| IAC: Invasive lung adenocarcinoma | ||
| MIA: Minimally invasive adenocarcinoma | ||
| Prostate | 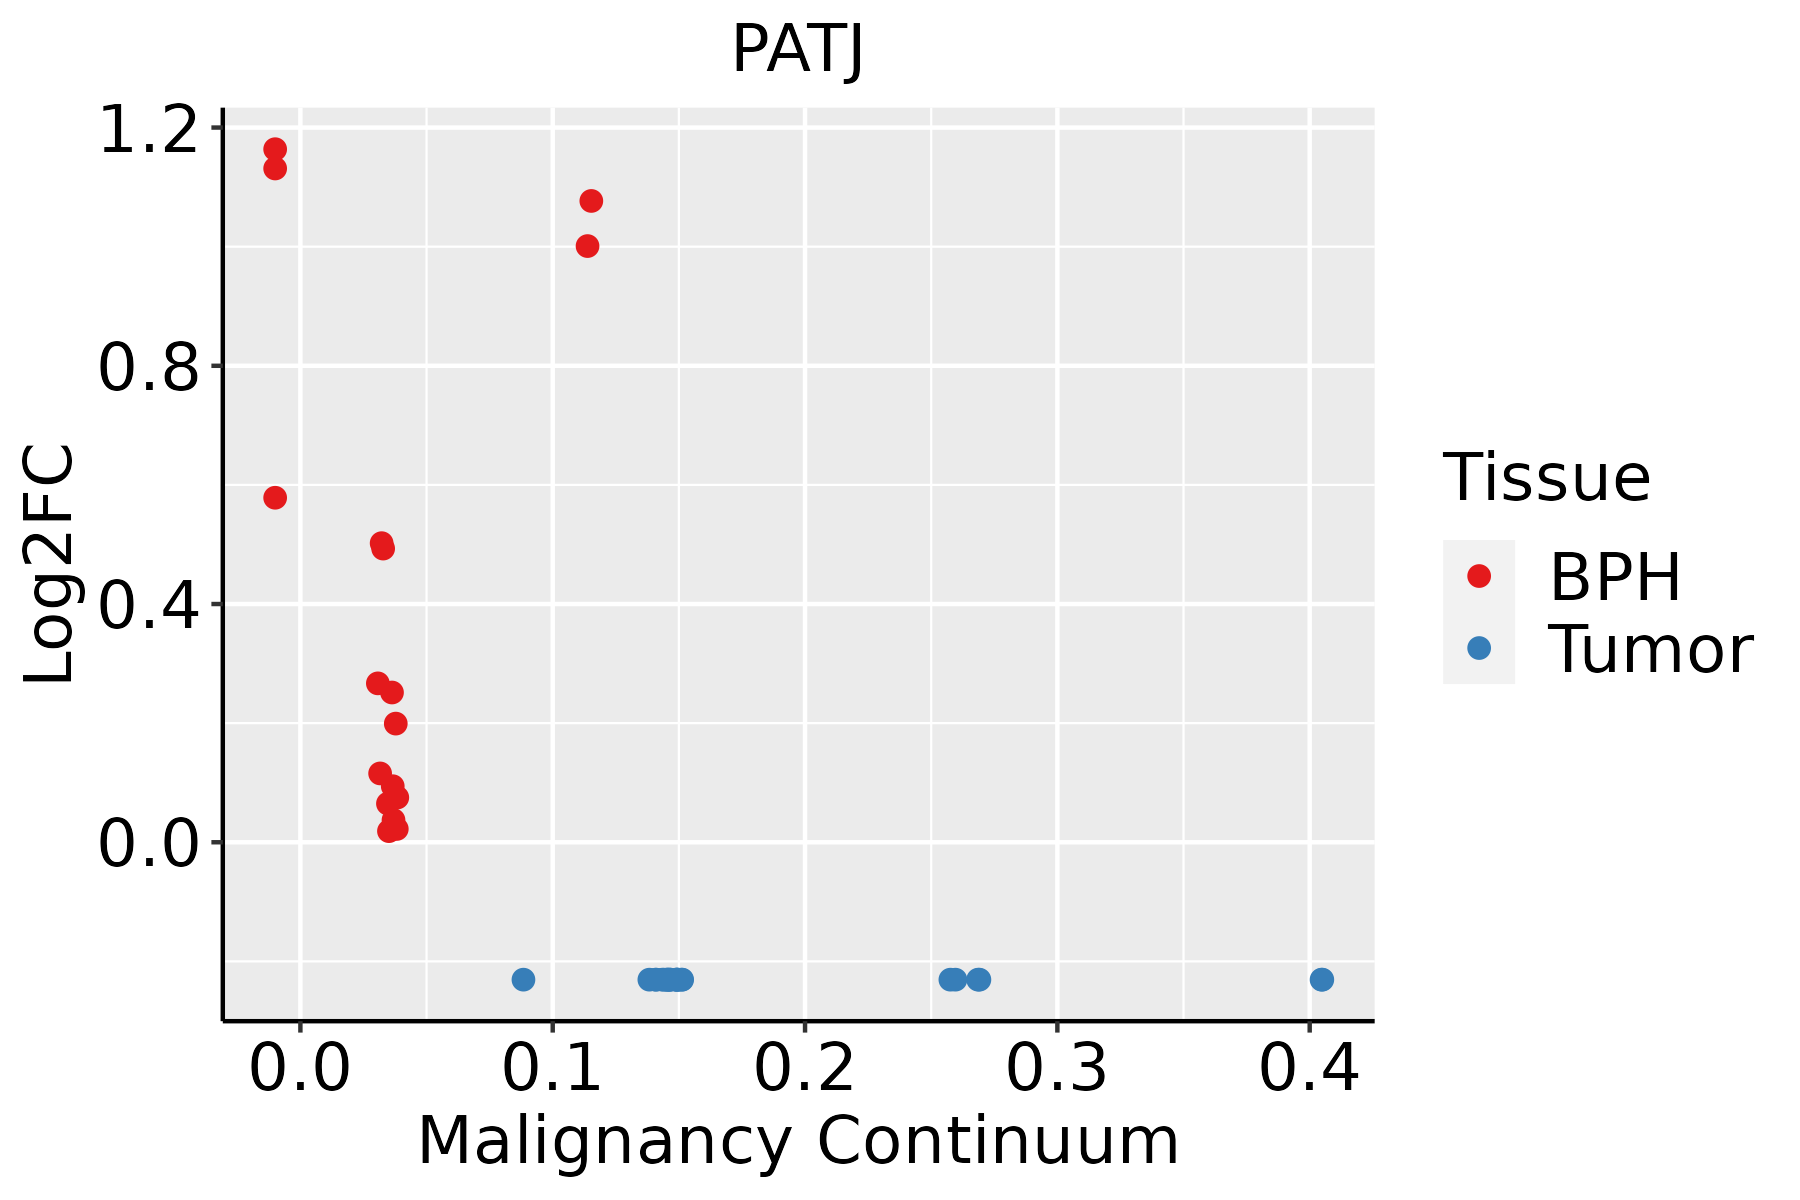 | BPH: Benign Prostatic Hyperplasia |
| Skin |  | AK: Actinic keratosis |
| cSCC: Cutaneous squamous cell carcinoma | ||
| SCCIS:squamous cell carcinoma in situ | ||
| Thyroid |  | ATC: Anaplastic thyroid cancer |
| HT: Hashimoto's thyroiditis | ||
| PTC: Papillary thyroid cancer |
| ∗log2FC in expression of this searched gene in stem-like cells from each diseased tissue sample relative to stem-like cells in normal samples in each tissue plotted against the malignancy continuum. Samples are colored based on if they are from different disease stage. |
Top |
Malignant transformation related pathway analysis |
| Find out the enriched GO biological processes and KEGG pathways involved in transition from healthy to precancer to cancer |
| Tissue | Disease Stage | Enriched GO biological Processes |
| Colorectum | AD |  |
| Colorectum | SER |  |
| Colorectum | MSS |  |
| Colorectum | MSI-H |  |
| Colorectum | FAP |  |
| ∗Top 15 enriched GO BP terms are showed in the bar plot of each disease state in each tissue. Each row represents a significant GO biological process which is colored according to the -log10(p.adjust). |
| Page: 1 2 3 4 5 6 7 8 9 |
| GO ID | Tissue | Disease Stage | Description | Gene Ratio | Bg Ratio | pvalue | p.adjust | Count |
| GO:000716314 | Breast | IDC | establishment or maintenance of cell polarity | 32/1434 | 218/18723 | 2.84e-04 | 4.33e-03 | 32 |
| GO:000716324 | Breast | DCIS | establishment or maintenance of cell polarity | 32/1390 | 218/18723 | 1.62e-04 | 2.71e-03 | 32 |
| GO:00071639 | Cervix | CC | establishment or maintenance of cell polarity | 63/2311 | 218/18723 | 4.25e-11 | 8.76e-09 | 63 |
| GO:00452169 | Cervix | CC | cell-cell junction organization | 53/2311 | 200/18723 | 3.83e-08 | 2.53e-06 | 53 |
| GO:00300108 | Cervix | CC | establishment of cell polarity | 42/2311 | 143/18723 | 4.30e-08 | 2.62e-06 | 42 |
| GO:00343298 | Cervix | CC | cell junction assembly | 88/2311 | 420/18723 | 3.42e-07 | 1.38e-05 | 88 |
| GO:00070439 | Cervix | CC | cell-cell junction assembly | 39/2311 | 146/18723 | 1.86e-06 | 5.94e-05 | 39 |
| GO:01201927 | Cervix | CC | tight junction assembly | 21/2311 | 74/18723 | 1.69e-04 | 2.00e-03 | 21 |
| GO:01201937 | Cervix | CC | tight junction organization | 22/2311 | 80/18723 | 1.97e-04 | 2.26e-03 | 22 |
| GO:00705074 | Cervix | CC | regulation of microtubule cytoskeleton organization | 32/2311 | 148/18723 | 1.02e-03 | 8.51e-03 | 32 |
| GO:0045216 | Colorectum | AD | cell-cell junction organization | 80/3918 | 200/18723 | 5.57e-10 | 4.58e-08 | 80 |
| GO:0034329 | Colorectum | AD | cell junction assembly | 136/3918 | 420/18723 | 2.02e-08 | 1.15e-06 | 136 |
| GO:0007043 | Colorectum | AD | cell-cell junction assembly | 57/3918 | 146/18723 | 4.18e-07 | 1.61e-05 | 57 |
| GO:0007163 | Colorectum | AD | establishment or maintenance of cell polarity | 77/3918 | 218/18723 | 5.72e-07 | 2.08e-05 | 77 |
| GO:0120193 | Colorectum | AD | tight junction organization | 33/3918 | 80/18723 | 2.93e-05 | 5.42e-04 | 33 |
| GO:0120192 | Colorectum | AD | tight junction assembly | 31/3918 | 74/18723 | 3.53e-05 | 6.43e-04 | 31 |
| GO:0030010 | Colorectum | AD | establishment of cell polarity | 50/3918 | 143/18723 | 6.90e-05 | 1.11e-03 | 50 |
| GO:0035088 | Colorectum | AD | establishment or maintenance of apical/basal cell polarity | 21/3918 | 49/18723 | 4.31e-04 | 4.82e-03 | 21 |
| GO:0061245 | Colorectum | AD | establishment or maintenance of bipolar cell polarity | 21/3918 | 49/18723 | 4.31e-04 | 4.82e-03 | 21 |
| GO:0070507 | Colorectum | AD | regulation of microtubule cytoskeleton organization | 44/3918 | 148/18723 | 7.05e-03 | 4.31e-02 | 44 |
| Page: 1 2 3 4 5 6 7 8 9 10 11 |
| Pathway ID | Tissue | Disease Stage | Description | Gene Ratio | Bg Ratio | pvalue | p.adjust | qvalue | Count |
| hsa0453024 | Breast | IDC | Tight junction | 38/867 | 169/8465 | 2.07e-06 | 3.20e-05 | 2.39e-05 | 38 |
| hsa0453034 | Breast | IDC | Tight junction | 38/867 | 169/8465 | 2.07e-06 | 3.20e-05 | 2.39e-05 | 38 |
| hsa0453044 | Breast | DCIS | Tight junction | 37/846 | 169/8465 | 3.07e-06 | 4.20e-05 | 3.09e-05 | 37 |
| hsa0453054 | Breast | DCIS | Tight junction | 37/846 | 169/8465 | 3.07e-06 | 4.20e-05 | 3.09e-05 | 37 |
| hsa0453020 | Cervix | CC | Tight junction | 49/1267 | 169/8465 | 1.87e-06 | 1.78e-05 | 1.05e-05 | 49 |
| hsa051657 | Cervix | CC | Human papillomavirus infection | 74/1267 | 331/8465 | 1.70e-04 | 1.02e-03 | 6.03e-04 | 74 |
| hsa043908 | Cervix | CC | Hippo signaling pathway | 40/1267 | 157/8465 | 3.64e-04 | 1.82e-03 | 1.07e-03 | 40 |
| hsa04530110 | Cervix | CC | Tight junction | 49/1267 | 169/8465 | 1.87e-06 | 1.78e-05 | 1.05e-05 | 49 |
| hsa0516512 | Cervix | CC | Human papillomavirus infection | 74/1267 | 331/8465 | 1.70e-04 | 1.02e-03 | 6.03e-04 | 74 |
| hsa0439013 | Cervix | CC | Hippo signaling pathway | 40/1267 | 157/8465 | 3.64e-04 | 1.82e-03 | 1.07e-03 | 40 |
| hsa04530 | Colorectum | AD | Tight junction | 76/2092 | 169/8465 | 5.49e-09 | 9.69e-08 | 6.18e-08 | 76 |
| hsa045301 | Colorectum | AD | Tight junction | 76/2092 | 169/8465 | 5.49e-09 | 9.69e-08 | 6.18e-08 | 76 |
| hsa045302 | Colorectum | SER | Tight junction | 59/1580 | 169/8465 | 3.24e-07 | 5.98e-06 | 4.34e-06 | 59 |
| hsa045303 | Colorectum | SER | Tight junction | 59/1580 | 169/8465 | 3.24e-07 | 5.98e-06 | 4.34e-06 | 59 |
| hsa045304 | Colorectum | MSS | Tight junction | 66/1875 | 169/8465 | 4.10e-07 | 6.25e-06 | 3.83e-06 | 66 |
| hsa04390 | Colorectum | MSS | Hippo signaling pathway | 48/1875 | 157/8465 | 8.32e-03 | 3.10e-02 | 1.90e-02 | 48 |
| hsa045305 | Colorectum | MSS | Tight junction | 66/1875 | 169/8465 | 4.10e-07 | 6.25e-06 | 3.83e-06 | 66 |
| hsa043901 | Colorectum | MSS | Hippo signaling pathway | 48/1875 | 157/8465 | 8.32e-03 | 3.10e-02 | 1.90e-02 | 48 |
| hsa045306 | Colorectum | MSI-H | Tight junction | 31/797 | 169/8465 | 2.08e-04 | 2.80e-03 | 2.35e-03 | 31 |
| hsa045307 | Colorectum | MSI-H | Tight junction | 31/797 | 169/8465 | 2.08e-04 | 2.80e-03 | 2.35e-03 | 31 |
| Page: 1 2 3 4 |
Top |
Cell-cell communication analysis |
| Identification of potential cell-cell interactions between two cell types and their ligand-receptor pairs for different disease states |
| Ligand | Receptor | LRpair | Pathway | Tissue | Disease Stage |
| Page: 1 |
Top |
Single-cell gene regulatory network inference analysis |
| Find out the significant the regulons (TFs) and the target genes of each regulon across cell types for different disease states |
| TF | Cell Type | Tissue | Disease Stage | Target Gene | RSS | Regulon Activity |
| ∗The dot plots of a searched regulon are shown for all cell subpopulations in each disease state of each tissue based on the regulon specific score inferred using pySCENIC and by calculating the average expression. |
| Page: 1 |
Top |
Somatic mutation of malignant transformation related genes |
| Annotation of somatic variants for genes involved in malignant transformation |
| Hugo Symbol | Variant Class | Variant Classification | dbSNP RS | HGVSc | HGVSp | HGVSp Short | SWISSPROT | BIOTYPE | SIFT | PolyPhen | Tumor Sample Barcode | Tissue | Histology | Sex | Age | Stage | Therapy Types | Drugs | Outcome |
| PATJ | SNV | Missense_Mutation | novel | c.5322G>T | p.Met1774Ile | p.M1774I | Q8NI35 | protein_coding | tolerated(0.14) | benign(0.003) | TCGA-A7-A4SF-01 | Breast | breast invasive carcinoma | Female | <65 | I/II | Chemotherapy | carboplatin | CR |
| PATJ | SNV | Missense_Mutation | c.3506N>C | p.Val1169Ala | p.V1169A | Q8NI35 | protein_coding | tolerated(0.15) | benign(0.014) | TCGA-A8-A06X-01 | Breast | breast invasive carcinoma | Female | >=65 | I/II | Unknown | Unknown | SD | |
| PATJ | SNV | Missense_Mutation | c.2263G>A | p.Glu755Lys | p.E755K | Q8NI35 | protein_coding | deleterious(0.01) | benign(0.371) | TCGA-A8-A09G-01 | Breast | breast invasive carcinoma | Female | >=65 | III/IV | Unknown | Unknown | SD | |
| PATJ | SNV | Missense_Mutation | c.2825C>G | p.Pro942Arg | p.P942R | Q8NI35 | protein_coding | tolerated(0.2) | benign(0) | TCGA-A8-A09G-01 | Breast | breast invasive carcinoma | Female | >=65 | III/IV | Unknown | Unknown | SD | |
| PATJ | SNV | Missense_Mutation | novel | c.4307T>A | p.Met1436Lys | p.M1436K | Q8NI35 | protein_coding | deleterious(0.02) | possibly_damaging(0.682) | TCGA-AC-A62Y-01 | Breast | breast invasive carcinoma | Female | >=65 | I/II | Unknown | Unknown | SD |
| PATJ | SNV | Missense_Mutation | rs776176524 | c.1849N>T | p.Arg617Cys | p.R617C | Q8NI35 | protein_coding | deleterious(0) | probably_damaging(0.999) | TCGA-BH-A1EY-01 | Breast | breast invasive carcinoma | Female | >=65 | I/II | Unknown | Unknown | PD |
| PATJ | SNV | Missense_Mutation | c.2804C>T | p.Ala935Val | p.A935V | Q8NI35 | protein_coding | tolerated(0.53) | benign(0) | TCGA-D8-A1J8-01 | Breast | breast invasive carcinoma | Female | >=65 | I/II | Hormone Therapy | nolvadex | SD | |
| PATJ | SNV | Missense_Mutation | c.3960N>C | p.Arg1320Ser | p.R1320S | Q8NI35 | protein_coding | deleterious(0.02) | probably_damaging(0.976) | TCGA-E2-A1LH-01 | Breast | breast invasive carcinoma | Female | <65 | I/II | Chemotherapy | adriamycin | SD | |
| PATJ | SNV | Missense_Mutation | c.3743G>A | p.Gly1248Glu | p.G1248E | Q8NI35 | protein_coding | deleterious(0) | probably_damaging(1) | TCGA-GM-A2DD-01 | Breast | breast invasive carcinoma | Female | <65 | I/II | Chemotherapy | fluorouracil | CR | |
| PATJ | SNV | Missense_Mutation | novel | c.2752N>G | p.Pro918Ala | p.P918A | Q8NI35 | protein_coding | tolerated(0.17) | benign(0) | TCGA-LD-A66U-01 | Breast | breast invasive carcinoma | Female | <65 | I/II | Chemotherapy | adriamycin | SD |
| Page: 1 2 3 4 5 6 7 8 9 10 11 12 13 14 15 16 17 18 19 |
Top |
Related drugs of malignant transformation related genes |
| Identification of chemicals and drugs interact with genes involved in malignant transfromation |
| (DGIdb 4.0) |
| Entrez ID | Symbol | Category | Interaction Types | Drug Claim Name | Drug Name | PMIDs |
| Page: 1 |

Copyright 2023-Present -The University of Texas Health Science Center at Houston |