
|
|||||
|
 | |
| |
| |
| |
| |
| |
|
Gene: PASD1 |
Gene summary for PASD1 |
| Gene information | Species | Human | Gene symbol | PASD1 | Gene ID | 139135 |
| Gene name | PAS domain containing repressor 1 | |
| Gene Alias | CT63 | |
| Cytomap | Xq28 | |
| Gene Type | protein-coding | GO ID | GO:0006139 | UniProtAcc | Q8IV76 |
Top |
Malignant transformation analysis |
| Identification of the aberrant gene expression in precancerous and cancerous lesions by comparing the gene expression of stem-like cells in diseased tissues with normal stem cells |
| Entrez ID | Symbol | Replicates | Species | Organ | Tissue | Adj P-value | Log2FC | Malignancy |
| 139135 | PASD1 | HCC2 | Human | Liver | HCC | 2.91e-02 | 1.69e+00 | 0.5341 |
| 139135 | PASD1 | S014 | Human | Liver | HCC | 1.40e-09 | 2.28e-01 | 0.2254 |
| 139135 | PASD1 | S015 | Human | Liver | HCC | 4.50e-13 | 5.08e-01 | 0.2375 |
| 139135 | PASD1 | S016 | Human | Liver | HCC | 4.75e-04 | 2.35e-01 | 0.2243 |
| Page: 1 |
| Tissue | Expression Dynamics | Abbreviation |
| Liver | 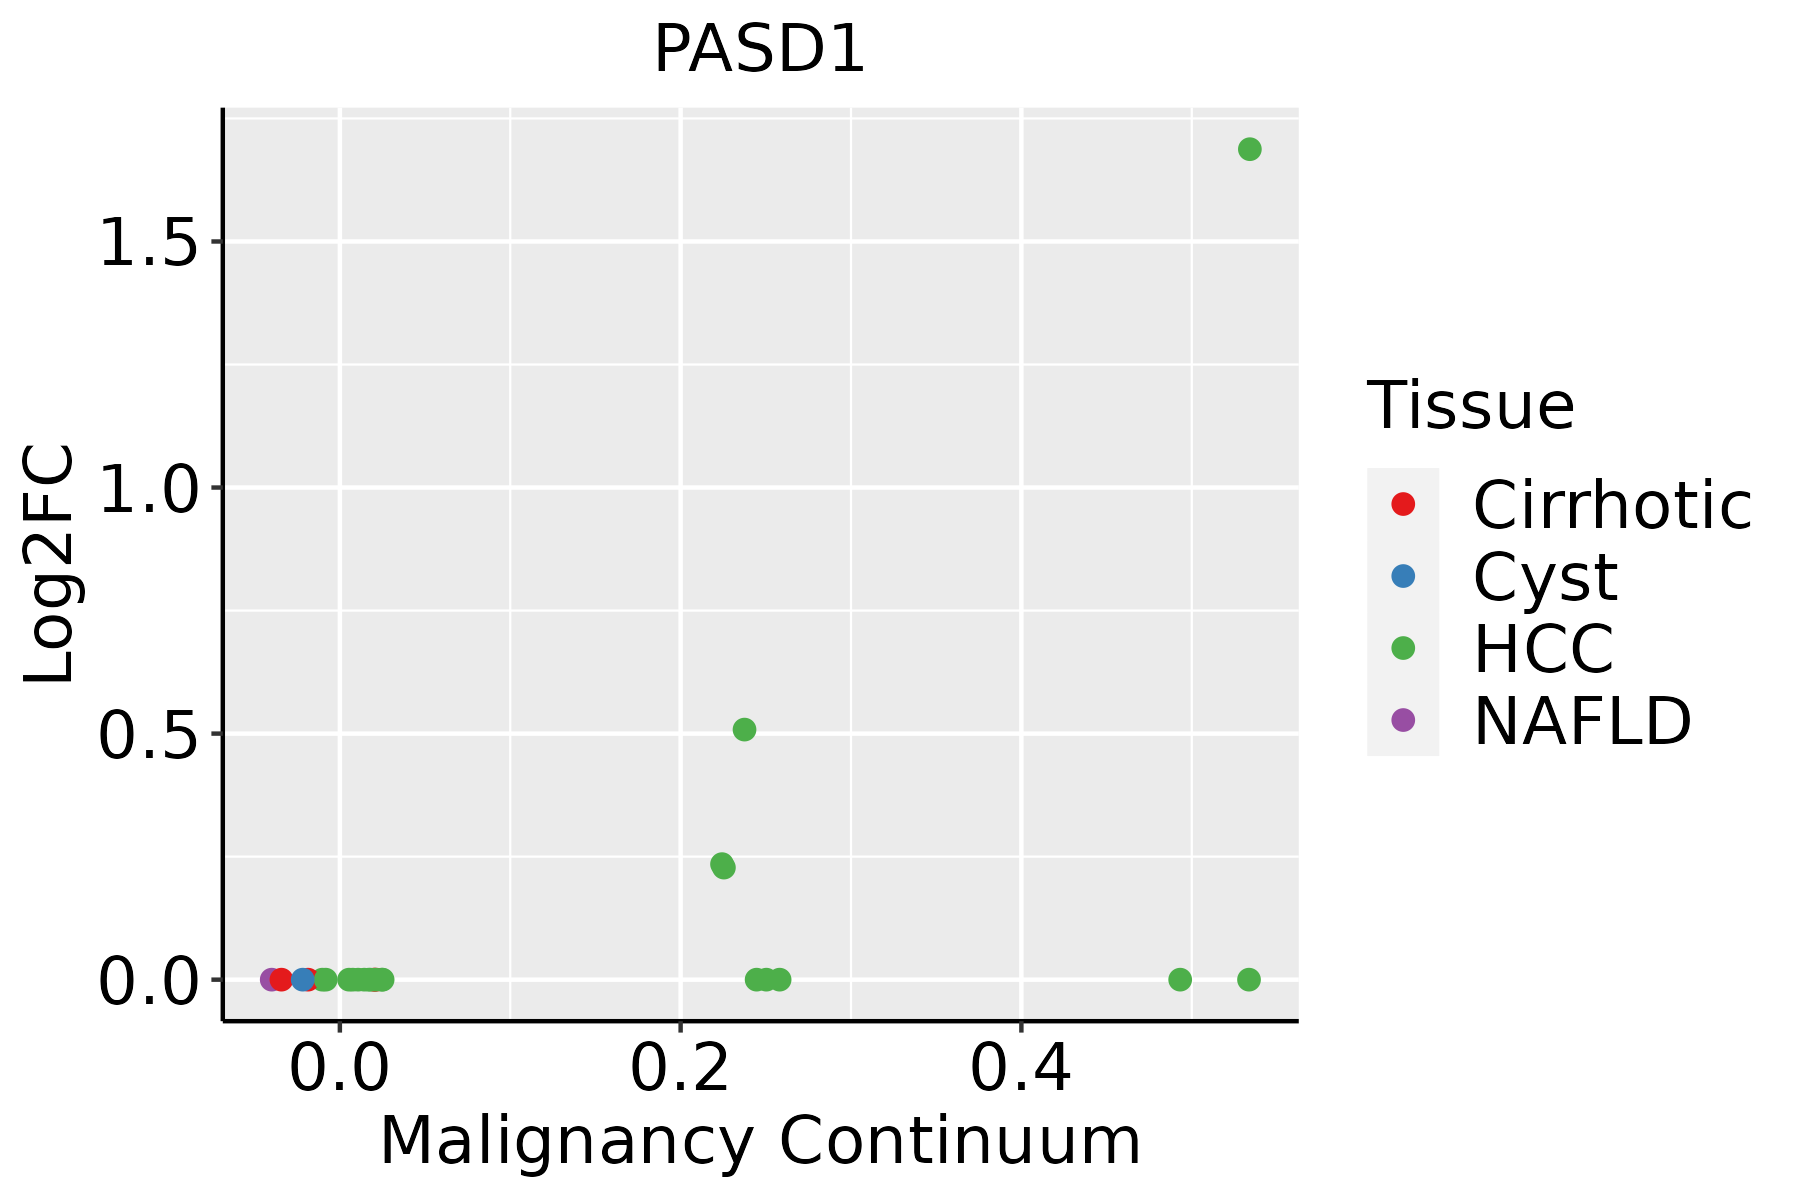 | HCC: Hepatocellular carcinoma |
| NAFLD: Non-alcoholic fatty liver disease |
| ∗log2FC in expression of this searched gene in stem-like cells from each diseased tissue sample relative to stem-like cells in normal samples in each tissue plotted against the malignancy continuum. Samples are colored based on if they are from different disease stage. |
Top |
Malignant transformation related pathway analysis |
| Find out the enriched GO biological processes and KEGG pathways involved in transition from healthy to precancer to cancer |
| Tissue | Disease Stage | Enriched GO biological Processes |
| Colorectum | AD |  |
| Colorectum | SER |  |
| Colorectum | MSS |  |
| Colorectum | MSI-H |  |
| Colorectum | FAP |  |
| ∗Top 15 enriched GO BP terms are showed in the bar plot of each disease state in each tissue. Each row represents a significant GO biological process which is colored according to the -log10(p.adjust). |
| Page: 1 2 3 4 5 6 7 8 9 |
| GO ID | Tissue | Disease Stage | Description | Gene Ratio | Bg Ratio | pvalue | p.adjust | Count |
| GO:000762321 | Liver | HCC | circadian rhythm | 117/7958 | 210/18723 | 7.29e-05 | 6.54e-04 | 117 |
| GO:004851121 | Liver | HCC | rhythmic process | 156/7958 | 298/18723 | 3.54e-04 | 2.46e-03 | 156 |
| GO:00329222 | Liver | HCC | circadian regulation of gene expression | 43/7958 | 68/18723 | 4.48e-04 | 3.00e-03 | 43 |
| GO:004275211 | Liver | HCC | regulation of circadian rhythm | 65/7958 | 121/18723 | 8.25e-03 | 3.24e-02 | 65 |
| Page: 1 |
| Pathway ID | Tissue | Disease Stage | Description | Gene Ratio | Bg Ratio | pvalue | p.adjust | qvalue | Count |
| Page: 1 |
Top |
Cell-cell communication analysis |
| Identification of potential cell-cell interactions between two cell types and their ligand-receptor pairs for different disease states |
| Ligand | Receptor | LRpair | Pathway | Tissue | Disease Stage |
| Page: 1 |
Top |
Single-cell gene regulatory network inference analysis |
| Find out the significant the regulons (TFs) and the target genes of each regulon across cell types for different disease states |
| TF | Cell Type | Tissue | Disease Stage | Target Gene | RSS | Regulon Activity |
| ∗The dot plots of a searched regulon are shown for all cell subpopulations in each disease state of each tissue based on the regulon specific score inferred using pySCENIC and by calculating the average expression. |
| Page: 1 |
Top |
Somatic mutation of malignant transformation related genes |
| Annotation of somatic variants for genes involved in malignant transformation |
| Hugo Symbol | Variant Class | Variant Classification | dbSNP RS | HGVSc | HGVSp | HGVSp Short | SWISSPROT | BIOTYPE | SIFT | PolyPhen | Tumor Sample Barcode | Tissue | Histology | Sex | Age | Stage | Therapy Types | Drugs | Outcome |
| PASD1 | SNV | Missense_Mutation | c.1707G>C | p.Glu569Asp | p.E569D | Q8IV76 | protein_coding | tolerated(0.15) | benign(0.351) | TCGA-A8-A06R-01 | Breast | breast invasive carcinoma | Female | >=65 | I/II | Chemotherapy | 5-fluorouracil | CR | |
| PASD1 | SNV | Missense_Mutation | c.2294A>G | p.Glu765Gly | p.E765G | Q8IV76 | protein_coding | deleterious_low_confidence(0.02) | probably_damaging(0.964) | TCGA-AR-A0TU-01 | Breast | breast invasive carcinoma | Female | <65 | I/II | Unspecific | Doxorubicin | SD | |
| PASD1 | SNV | Missense_Mutation | c.746A>G | p.Gln249Arg | p.Q249R | Q8IV76 | protein_coding | deleterious(0.01) | benign(0.101) | TCGA-C8-A12V-01 | Breast | breast invasive carcinoma | Female | <65 | I/II | Unknown | Unknown | SD | |
| PASD1 | SNV | Missense_Mutation | c.298N>A | p.Leu100Ile | p.L100I | Q8IV76 | protein_coding | tolerated(0.35) | benign(0.042) | TCGA-D8-A1JK-01 | Breast | breast invasive carcinoma | Female | >=65 | I/II | Unknown | Unknown | SD | |
| PASD1 | SNV | Missense_Mutation | c.1707N>C | p.Glu569Asp | p.E569D | Q8IV76 | protein_coding | tolerated(0.15) | benign(0.351) | TCGA-D8-A1JU-01 | Breast | breast invasive carcinoma | Female | <65 | I/II | Hormone Therapy | tamoxiphen | SD | |
| PASD1 | SNV | Missense_Mutation | rs761622222 | c.1060G>A | p.Ala354Thr | p.A354T | Q8IV76 | protein_coding | tolerated(1) | benign(0) | TCGA-E2-A15P-01 | Breast | breast invasive carcinoma | Female | <65 | I/II | Hormone Therapy | arimidex | SD |
| PASD1 | insertion | Frame_Shift_Ins | novel | c.2225dupT | p.Gln743ProfsTer26 | p.Q743Pfs*26 | Q8IV76 | protein_coding | TCGA-D8-A1JF-01 | Breast | breast invasive carcinoma | Female | >=65 | III/IV | Unknown | Unknown | SD | ||
| PASD1 | SNV | Missense_Mutation | novel | c.1039N>A | p.Val347Met | p.V347M | Q8IV76 | protein_coding | deleterious(0.05) | benign(0.026) | TCGA-2W-A8YY-01 | Cervix | cervical & endocervical cancer | Female | <65 | I/II | Chemotherapy | cisplatin | CR |
| PASD1 | SNV | Missense_Mutation | c.599N>T | p.Ser200Leu | p.S200L | Q8IV76 | protein_coding | deleterious(0) | benign(0.134) | TCGA-DG-A2KL-01 | Cervix | cervical & endocervical cancer | Female | <65 | I/II | Chemotherapy | cisplatin | SD | |
| PASD1 | SNV | Missense_Mutation | rs370064836 | c.1315N>A | p.Ala439Thr | p.A439T | Q8IV76 | protein_coding | tolerated(1) | benign(0) | TCGA-JX-A3Q0-01 | Cervix | cervical & endocervical cancer | Female | <65 | III/IV | Unknown | Unknown | SD |
| Page: 1 2 3 4 5 6 7 8 9 10 11 12 13 14 |
Top |
Related drugs of malignant transformation related genes |
| Identification of chemicals and drugs interact with genes involved in malignant transfromation |
| (DGIdb 4.0) |
| Entrez ID | Symbol | Category | Interaction Types | Drug Claim Name | Drug Name | PMIDs |
| Page: 1 |

Copyright 2023-Present -The University of Texas Health Science Center at Houston |