
|
|||||
|
 | |
| |
| |
| |
| |
| |
|
Gene: PARVB |
Gene summary for PARVB |
| Gene information | Species | Human | Gene symbol | PARVB | Gene ID | 29780 |
| Gene name | parvin beta | |
| Gene Alias | CGI-56 | |
| Cytomap | 22q13.31 | |
| Gene Type | protein-coding | GO ID | GO:0000902 | UniProtAcc | Q9HBI1 |
Top |
Malignant transformation analysis |
| Identification of the aberrant gene expression in precancerous and cancerous lesions by comparing the gene expression of stem-like cells in diseased tissues with normal stem cells |
| Entrez ID | Symbol | Replicates | Species | Organ | Tissue | Adj P-value | Log2FC | Malignancy |
| 29780 | PARVB | HTA11_7696_3000711011 | Human | Colorectum | AD | 4.29e-04 | 2.87e-01 | 0.0674 |
| 29780 | PARVB | HTA11_99999970781_79442 | Human | Colorectum | MSS | 8.69e-06 | 3.10e-01 | 0.294 |
| 29780 | PARVB | HTA11_99999965062_69753 | Human | Colorectum | MSI-H | 2.36e-04 | 7.66e-01 | 0.3487 |
| 29780 | PARVB | HTA11_99999971662_82457 | Human | Colorectum | MSS | 2.31e-12 | 4.08e-01 | 0.3859 |
| 29780 | PARVB | HTA11_99999973899_84307 | Human | Colorectum | MSS | 5.89e-09 | 4.65e-01 | 0.2585 |
| 29780 | PARVB | HTA11_99999974143_84620 | Human | Colorectum | MSS | 2.90e-10 | 3.51e-01 | 0.3005 |
| 29780 | PARVB | CRC-3-11773 | Human | Colorectum | CRC | 1.14e-24 | 8.19e-01 | 0.2564 |
| 29780 | PARVB | LZE4T | Human | Esophagus | ESCC | 1.38e-11 | 3.45e-01 | 0.0811 |
| 29780 | PARVB | LZE7T | Human | Esophagus | ESCC | 3.98e-06 | 3.82e-01 | 0.0667 |
| 29780 | PARVB | LZE24T | Human | Esophagus | ESCC | 2.44e-13 | 4.16e-01 | 0.0596 |
| 29780 | PARVB | P2T-E | Human | Esophagus | ESCC | 1.88e-11 | 2.33e-01 | 0.1177 |
| 29780 | PARVB | P4T-E | Human | Esophagus | ESCC | 1.32e-16 | 3.92e-01 | 0.1323 |
| 29780 | PARVB | P5T-E | Human | Esophagus | ESCC | 3.96e-39 | 6.86e-01 | 0.1327 |
| 29780 | PARVB | P9T-E | Human | Esophagus | ESCC | 4.11e-30 | 7.21e-01 | 0.1131 |
| 29780 | PARVB | P11T-E | Human | Esophagus | ESCC | 8.43e-16 | 5.33e-01 | 0.1426 |
| 29780 | PARVB | P15T-E | Human | Esophagus | ESCC | 9.43e-14 | 3.29e-01 | 0.1149 |
| 29780 | PARVB | P16T-E | Human | Esophagus | ESCC | 7.28e-26 | 4.71e-01 | 0.1153 |
| 29780 | PARVB | P17T-E | Human | Esophagus | ESCC | 4.68e-05 | 3.70e-01 | 0.1278 |
| 29780 | PARVB | P19T-E | Human | Esophagus | ESCC | 1.55e-09 | 7.96e-01 | 0.1662 |
| 29780 | PARVB | P20T-E | Human | Esophagus | ESCC | 4.92e-15 | 3.30e-01 | 0.1124 |
| Page: 1 2 3 4 5 |
| Tissue | Expression Dynamics | Abbreviation |
| Colorectum (GSE201348) |  | FAP: Familial adenomatous polyposis |
| CRC: Colorectal cancer | ||
| Colorectum (HTA11) |  | AD: Adenomas |
| SER: Sessile serrated lesions | ||
| MSI-H: Microsatellite-high colorectal cancer | ||
| MSS: Microsatellite stable colorectal cancer | ||
| Esophagus | 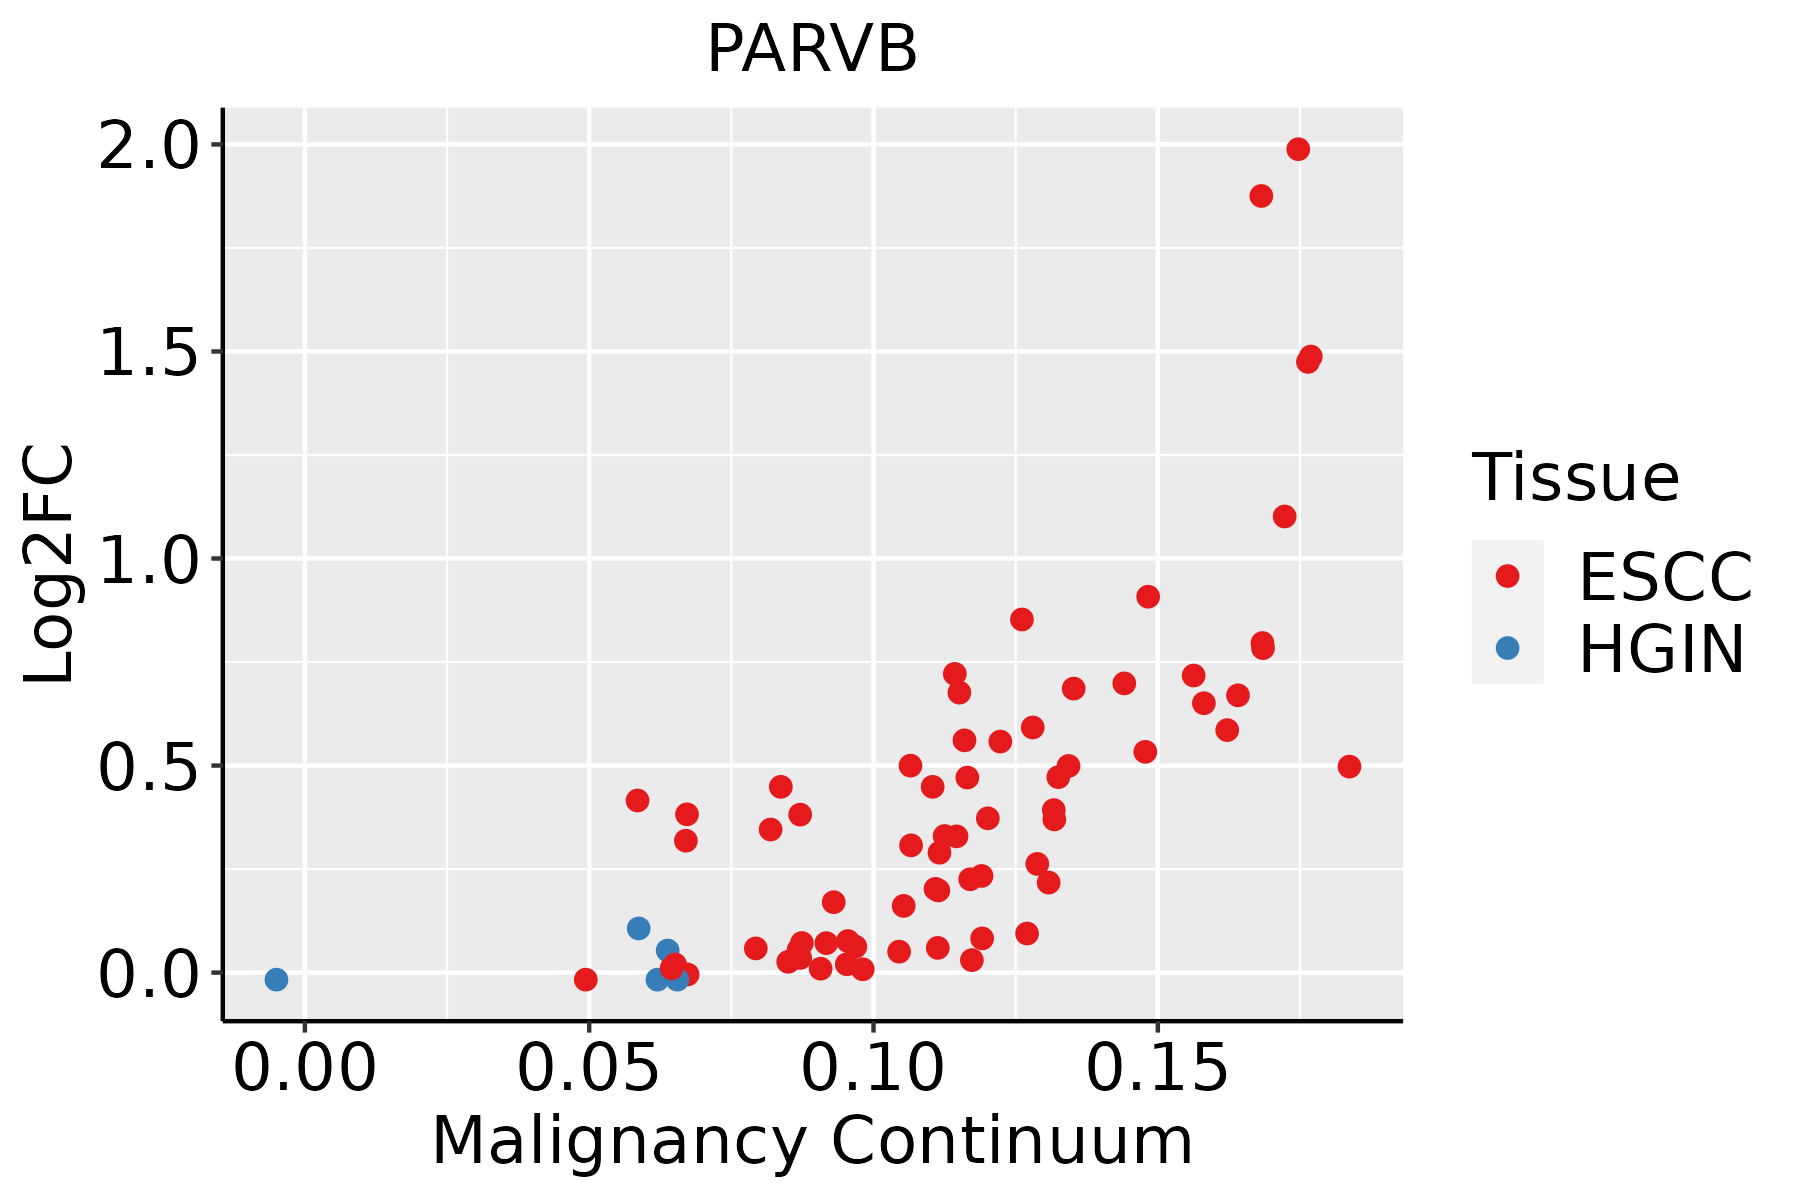 | ESCC: Esophageal squamous cell carcinoma |
| HGIN: High-grade intraepithelial neoplasias | ||
| LGIN: Low-grade intraepithelial neoplasias | ||
| Liver |  | HCC: Hepatocellular carcinoma |
| NAFLD: Non-alcoholic fatty liver disease | ||
| Oral Cavity |  | EOLP: Erosive Oral lichen planus |
| LP: leukoplakia | ||
| NEOLP: Non-erosive oral lichen planus | ||
| OSCC: Oral squamous cell carcinoma | ||
| Thyroid |  | ATC: Anaplastic thyroid cancer |
| HT: Hashimoto's thyroiditis | ||
| PTC: Papillary thyroid cancer |
| ∗log2FC in expression of this searched gene in stem-like cells from each diseased tissue sample relative to stem-like cells in normal samples in each tissue plotted against the malignancy continuum. Samples are colored based on if they are from different disease stage. |
Top |
Malignant transformation related pathway analysis |
| Find out the enriched GO biological processes and KEGG pathways involved in transition from healthy to precancer to cancer |
| Tissue | Disease Stage | Enriched GO biological Processes |
| Colorectum | AD |  |
| Colorectum | SER |  |
| Colorectum | MSS |  |
| Colorectum | MSI-H |  |
| Colorectum | FAP |  |
| ∗Top 15 enriched GO BP terms are showed in the bar plot of each disease state in each tissue. Each row represents a significant GO biological process which is colored according to the -log10(p.adjust). |
| Page: 1 2 3 4 5 6 7 8 9 |
| GO ID | Tissue | Disease Stage | Description | Gene Ratio | Bg Ratio | pvalue | p.adjust | Count |
| GO:0022604 | Colorectum | AD | regulation of cell morphogenesis | 109/3918 | 309/18723 | 3.08e-09 | 2.07e-07 | 109 |
| GO:0031589 | Colorectum | AD | cell-substrate adhesion | 116/3918 | 363/18723 | 4.68e-07 | 1.76e-05 | 116 |
| GO:0007163 | Colorectum | AD | establishment or maintenance of cell polarity | 77/3918 | 218/18723 | 5.72e-07 | 2.08e-05 | 77 |
| GO:0008360 | Colorectum | AD | regulation of cell shape | 56/3918 | 154/18723 | 7.01e-06 | 1.73e-04 | 56 |
| GO:0031532 | Colorectum | AD | actin cytoskeleton reorganization | 41/3918 | 107/18723 | 2.81e-05 | 5.28e-04 | 41 |
| GO:0097581 | Colorectum | AD | lamellipodium organization | 35/3918 | 90/18723 | 7.39e-05 | 1.18e-03 | 35 |
| GO:0034446 | Colorectum | AD | substrate adhesion-dependent cell spreading | 40/3918 | 108/18723 | 8.52e-05 | 1.32e-03 | 40 |
| GO:0030032 | Colorectum | AD | lamellipodium assembly | 26/3918 | 72/18723 | 2.12e-03 | 1.68e-02 | 26 |
| GO:00226042 | Colorectum | MSS | regulation of cell morphogenesis | 103/3467 | 309/18723 | 2.70e-10 | 2.56e-08 | 103 |
| GO:00071632 | Colorectum | MSS | establishment or maintenance of cell polarity | 72/3467 | 218/18723 | 1.90e-07 | 8.30e-06 | 72 |
| GO:00315322 | Colorectum | MSS | actin cytoskeleton reorganization | 41/3467 | 107/18723 | 1.21e-06 | 4.06e-05 | 41 |
| GO:00315892 | Colorectum | MSS | cell-substrate adhesion | 104/3467 | 363/18723 | 1.35e-06 | 4.51e-05 | 104 |
| GO:00083602 | Colorectum | MSS | regulation of cell shape | 52/3467 | 154/18723 | 4.40e-06 | 1.24e-04 | 52 |
| GO:00344462 | Colorectum | MSS | substrate adhesion-dependent cell spreading | 39/3467 | 108/18723 | 1.15e-05 | 2.71e-04 | 39 |
| GO:00975812 | Colorectum | MSS | lamellipodium organization | 33/3467 | 90/18723 | 3.70e-05 | 7.09e-04 | 33 |
| GO:00300321 | Colorectum | MSS | lamellipodium assembly | 24/3467 | 72/18723 | 1.91e-03 | 1.66e-02 | 24 |
| GO:00226043 | Colorectum | MSI-H | regulation of cell morphogenesis | 45/1319 | 309/18723 | 2.70e-06 | 1.54e-04 | 45 |
| GO:00344463 | Colorectum | MSI-H | substrate adhesion-dependent cell spreading | 19/1319 | 108/18723 | 1.80e-04 | 4.93e-03 | 19 |
| GO:00975813 | Colorectum | MSI-H | lamellipodium organization | 15/1319 | 90/18723 | 1.48e-03 | 2.23e-02 | 15 |
| GO:00226045 | Colorectum | CRC | regulation of cell morphogenesis | 74/2078 | 309/18723 | 9.25e-11 | 5.04e-08 | 74 |
| Page: 1 2 3 4 |
| Pathway ID | Tissue | Disease Stage | Description | Gene Ratio | Bg Ratio | pvalue | p.adjust | qvalue | Count |
| hsa045104 | Colorectum | CRC | Focal adhesion | 51/1091 | 203/8465 | 1.29e-06 | 5.41e-05 | 3.66e-05 | 51 |
| hsa045105 | Colorectum | CRC | Focal adhesion | 51/1091 | 203/8465 | 1.29e-06 | 5.41e-05 | 3.66e-05 | 51 |
| hsa0451020 | Esophagus | ESCC | Focal adhesion | 127/4205 | 203/8465 | 1.25e-04 | 4.99e-04 | 2.56e-04 | 127 |
| hsa04510111 | Esophagus | ESCC | Focal adhesion | 127/4205 | 203/8465 | 1.25e-04 | 4.99e-04 | 2.56e-04 | 127 |
| hsa0451041 | Liver | HCC | Focal adhesion | 125/4020 | 203/8465 | 3.12e-05 | 1.88e-04 | 1.04e-04 | 125 |
| hsa0451051 | Liver | HCC | Focal adhesion | 125/4020 | 203/8465 | 3.12e-05 | 1.88e-04 | 1.04e-04 | 125 |
| hsa0451019 | Oral cavity | OSCC | Focal adhesion | 128/3704 | 203/8465 | 1.71e-08 | 1.63e-07 | 8.31e-08 | 128 |
| hsa04510110 | Oral cavity | OSCC | Focal adhesion | 128/3704 | 203/8465 | 1.71e-08 | 1.63e-07 | 8.31e-08 | 128 |
| hsa0451026 | Oral cavity | EOLP | Focal adhesion | 60/1218 | 203/8465 | 1.42e-08 | 1.83e-07 | 1.08e-07 | 60 |
| hsa0451036 | Oral cavity | EOLP | Focal adhesion | 60/1218 | 203/8465 | 1.42e-08 | 1.83e-07 | 1.08e-07 | 60 |
| hsa0451043 | Oral cavity | NEOLP | Focal adhesion | 71/1112 | 203/8465 | 7.25e-16 | 7.68e-14 | 4.83e-14 | 71 |
| hsa0451053 | Oral cavity | NEOLP | Focal adhesion | 71/1112 | 203/8465 | 7.25e-16 | 7.68e-14 | 4.83e-14 | 71 |
| Page: 1 |
Top |
Cell-cell communication analysis |
| Identification of potential cell-cell interactions between two cell types and their ligand-receptor pairs for different disease states |
| Ligand | Receptor | LRpair | Pathway | Tissue | Disease Stage |
| Page: 1 |
Top |
Single-cell gene regulatory network inference analysis |
| Find out the significant the regulons (TFs) and the target genes of each regulon across cell types for different disease states |
| TF | Cell Type | Tissue | Disease Stage | Target Gene | RSS | Regulon Activity |
| ∗The dot plots of a searched regulon are shown for all cell subpopulations in each disease state of each tissue based on the regulon specific score inferred using pySCENIC and by calculating the average expression. |
| Page: 1 |
Top |
Somatic mutation of malignant transformation related genes |
| Annotation of somatic variants for genes involved in malignant transformation |
| Hugo Symbol | Variant Class | Variant Classification | dbSNP RS | HGVSc | HGVSp | HGVSp Short | SWISSPROT | BIOTYPE | SIFT | PolyPhen | Tumor Sample Barcode | Tissue | Histology | Sex | Age | Stage | Therapy Types | Drugs | Outcome |
| PARVB | SNV | Missense_Mutation | rs534947819 | c.317N>A | p.Arg106His | p.R106H | Q9HBI1 | protein_coding | deleterious(0.01) | probably_damaging(0.997) | TCGA-AC-A8OQ-01 | Breast | breast invasive carcinoma | Female | >=65 | I/II | Unknown | Unknown | SD |
| PARVB | SNV | Missense_Mutation | rs753352609 | c.1109G>A | p.Arg370His | p.R370H | Q9HBI1 | protein_coding | deleterious(0.01) | benign(0.03) | TCGA-AN-A0AK-01 | Breast | breast invasive carcinoma | Female | >=65 | I/II | Unknown | Unknown | SD |
| PARVB | SNV | Missense_Mutation | rs200997339 | c.692N>A | p.Arg231His | p.R231H | Q9HBI1 | protein_coding | tolerated(0.08) | benign(0.09) | TCGA-2W-A8YY-01 | Cervix | cervical & endocervical cancer | Female | <65 | I/II | Chemotherapy | cisplatin | CR |
| PARVB | SNV | Missense_Mutation | rs753954634 | c.451N>A | p.Gly151Ser | p.G151S | Q9HBI1 | protein_coding | deleterious(0) | probably_damaging(1) | TCGA-C5-A901-01 | Cervix | cervical & endocervical cancer | Female | <65 | I/II | Unknown | Unknown | SD |
| PARVB | SNV | Missense_Mutation | c.934N>A | p.Glu312Lys | p.E312K | Q9HBI1 | protein_coding | deleterious(0.04) | probably_damaging(0.939) | TCGA-IR-A3LA-01 | Cervix | cervical & endocervical cancer | Female | <65 | I/II | Chemotherapy | cisplatin | CR | |
| PARVB | SNV | Missense_Mutation | novel | c.802N>T | p.Gly268Cys | p.G268C | Q9HBI1 | protein_coding | deleterious(0.02) | probably_damaging(0.976) | TCGA-A6-5665-01 | Colorectum | colon adenocarcinoma | Female | >=65 | I/II | Unknown | Unknown | PD |
| PARVB | SNV | Missense_Mutation | rs750285011 | c.730C>T | p.Arg244Trp | p.R244W | Q9HBI1 | protein_coding | deleterious(0) | probably_damaging(0.963) | TCGA-AA-3664-01 | Colorectum | colon adenocarcinoma | Female | >=65 | I/II | Unknown | Unknown | SD |
| PARVB | SNV | Missense_Mutation | c.994T>G | p.Phe332Val | p.F332V | Q9HBI1 | protein_coding | deleterious(0) | possibly_damaging(0.888) | TCGA-AA-3715-01 | Colorectum | colon adenocarcinoma | Male | >=65 | I/II | Unknown | Unknown | PD | |
| PARVB | SNV | Missense_Mutation | rs749414411 | c.1063G>A | p.Ala355Thr | p.A355T | Q9HBI1 | protein_coding | deleterious(0) | probably_damaging(0.962) | TCGA-AA-3864-01 | Colorectum | colon adenocarcinoma | Male | >=65 | I/II | Unknown | Unknown | SD |
| PARVB | SNV | Missense_Mutation | rs370343316 | c.316N>T | p.Arg106Cys | p.R106C | Q9HBI1 | protein_coding | deleterious(0.01) | probably_damaging(0.999) | TCGA-AA-A00N-01 | Colorectum | colon adenocarcinoma | Male | >=65 | I/II | Unknown | Unknown | PD |
| Page: 1 2 3 4 |
Top |
Related drugs of malignant transformation related genes |
| Identification of chemicals and drugs interact with genes involved in malignant transfromation |
| (DGIdb 4.0) |
| Entrez ID | Symbol | Category | Interaction Types | Drug Claim Name | Drug Name | PMIDs |
| Page: 1 |

Copyright 2023-Present -The University of Texas Health Science Center at Houston |