
|
|||||
|
 | |
| |
| |
| |
| |
| |
|
Gene: PARVA |
Gene summary for PARVA |
| Gene information | Species | Human | Gene symbol | PARVA | Gene ID | 55742 |
| Gene name | parvin alpha | |
| Gene Alias | CH-ILKBP | |
| Cytomap | 11p15.3 | |
| Gene Type | protein-coding | GO ID | GO:0000902 | UniProtAcc | J3KNQ4 |
Top |
Malignant transformation analysis |
| Identification of the aberrant gene expression in precancerous and cancerous lesions by comparing the gene expression of stem-like cells in diseased tissues with normal stem cells |
| Entrez ID | Symbol | Replicates | Species | Organ | Tissue | Adj P-value | Log2FC | Malignancy |
| 55742 | PARVA | HTA11_99999974143_84620 | Human | Colorectum | MSS | 7.72e-09 | -3.40e-01 | 0.3005 |
| 55742 | PARVA | F007 | Human | Colorectum | FAP | 4.27e-03 | -3.41e-01 | 0.1176 |
| 55742 | PARVA | A002-C-010 | Human | Colorectum | FAP | 6.28e-05 | -1.80e-01 | 0.242 |
| 55742 | PARVA | A001-C-207 | Human | Colorectum | FAP | 1.13e-03 | -3.25e-01 | 0.1278 |
| 55742 | PARVA | A015-C-203 | Human | Colorectum | FAP | 1.81e-29 | -5.57e-01 | -0.1294 |
| 55742 | PARVA | A015-C-204 | Human | Colorectum | FAP | 1.60e-09 | -4.50e-01 | -0.0228 |
| 55742 | PARVA | A014-C-040 | Human | Colorectum | FAP | 1.75e-03 | -4.79e-01 | -0.1184 |
| 55742 | PARVA | A002-C-201 | Human | Colorectum | FAP | 2.48e-14 | -4.76e-01 | 0.0324 |
| 55742 | PARVA | A002-C-203 | Human | Colorectum | FAP | 1.27e-06 | -2.35e-01 | 0.2786 |
| 55742 | PARVA | A001-C-119 | Human | Colorectum | FAP | 1.05e-12 | -5.51e-01 | -0.1557 |
| 55742 | PARVA | A001-C-108 | Human | Colorectum | FAP | 5.36e-20 | -4.37e-01 | -0.0272 |
| 55742 | PARVA | A002-C-205 | Human | Colorectum | FAP | 1.09e-21 | -5.37e-01 | -0.1236 |
| 55742 | PARVA | A014-C-108 | Human | Colorectum | FAP | 8.05e-03 | -3.99e-01 | -0.124 |
| 55742 | PARVA | A001-C-104 | Human | Colorectum | FAP | 9.32e-10 | -4.00e-01 | 0.0184 |
| 55742 | PARVA | A015-C-005 | Human | Colorectum | FAP | 7.34e-06 | -3.74e-01 | -0.0336 |
| 55742 | PARVA | A015-C-006 | Human | Colorectum | FAP | 2.79e-16 | -6.01e-01 | -0.0994 |
| 55742 | PARVA | A015-C-106 | Human | Colorectum | FAP | 1.27e-14 | -3.68e-01 | -0.0511 |
| 55742 | PARVA | A002-C-114 | Human | Colorectum | FAP | 7.13e-18 | -5.24e-01 | -0.1561 |
| 55742 | PARVA | A015-C-104 | Human | Colorectum | FAP | 2.38e-30 | -5.52e-01 | -0.1899 |
| 55742 | PARVA | A001-C-014 | Human | Colorectum | FAP | 2.94e-20 | -4.75e-01 | 0.0135 |
| Page: 1 2 3 4 5 6 7 |
| Tissue | Expression Dynamics | Abbreviation |
| Colorectum (GSE201348) |  | FAP: Familial adenomatous polyposis |
| CRC: Colorectal cancer | ||
| Colorectum (HTA11) |  | AD: Adenomas |
| SER: Sessile serrated lesions | ||
| MSI-H: Microsatellite-high colorectal cancer | ||
| MSS: Microsatellite stable colorectal cancer | ||
| Esophagus | 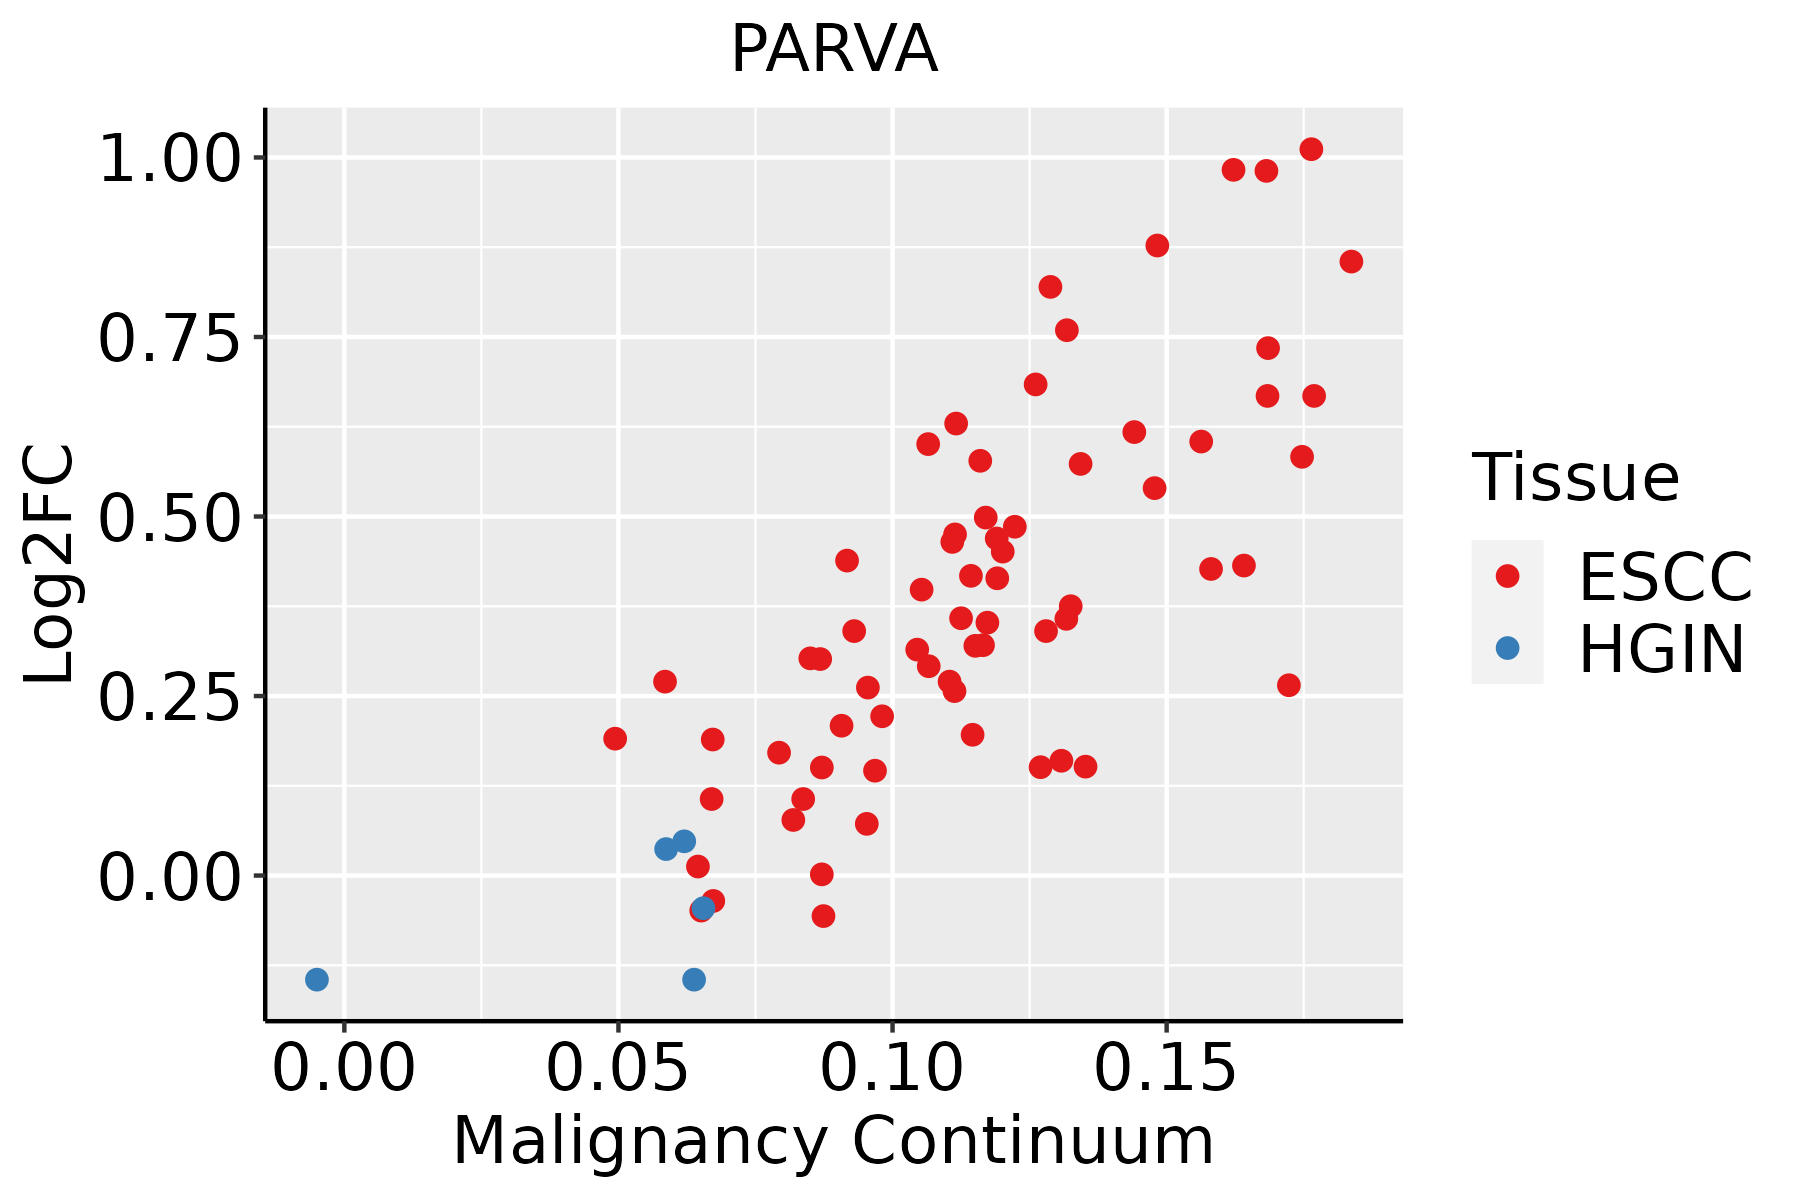 | ESCC: Esophageal squamous cell carcinoma |
| HGIN: High-grade intraepithelial neoplasias | ||
| LGIN: Low-grade intraepithelial neoplasias | ||
| Liver |  | HCC: Hepatocellular carcinoma |
| NAFLD: Non-alcoholic fatty liver disease | ||
| Oral Cavity | 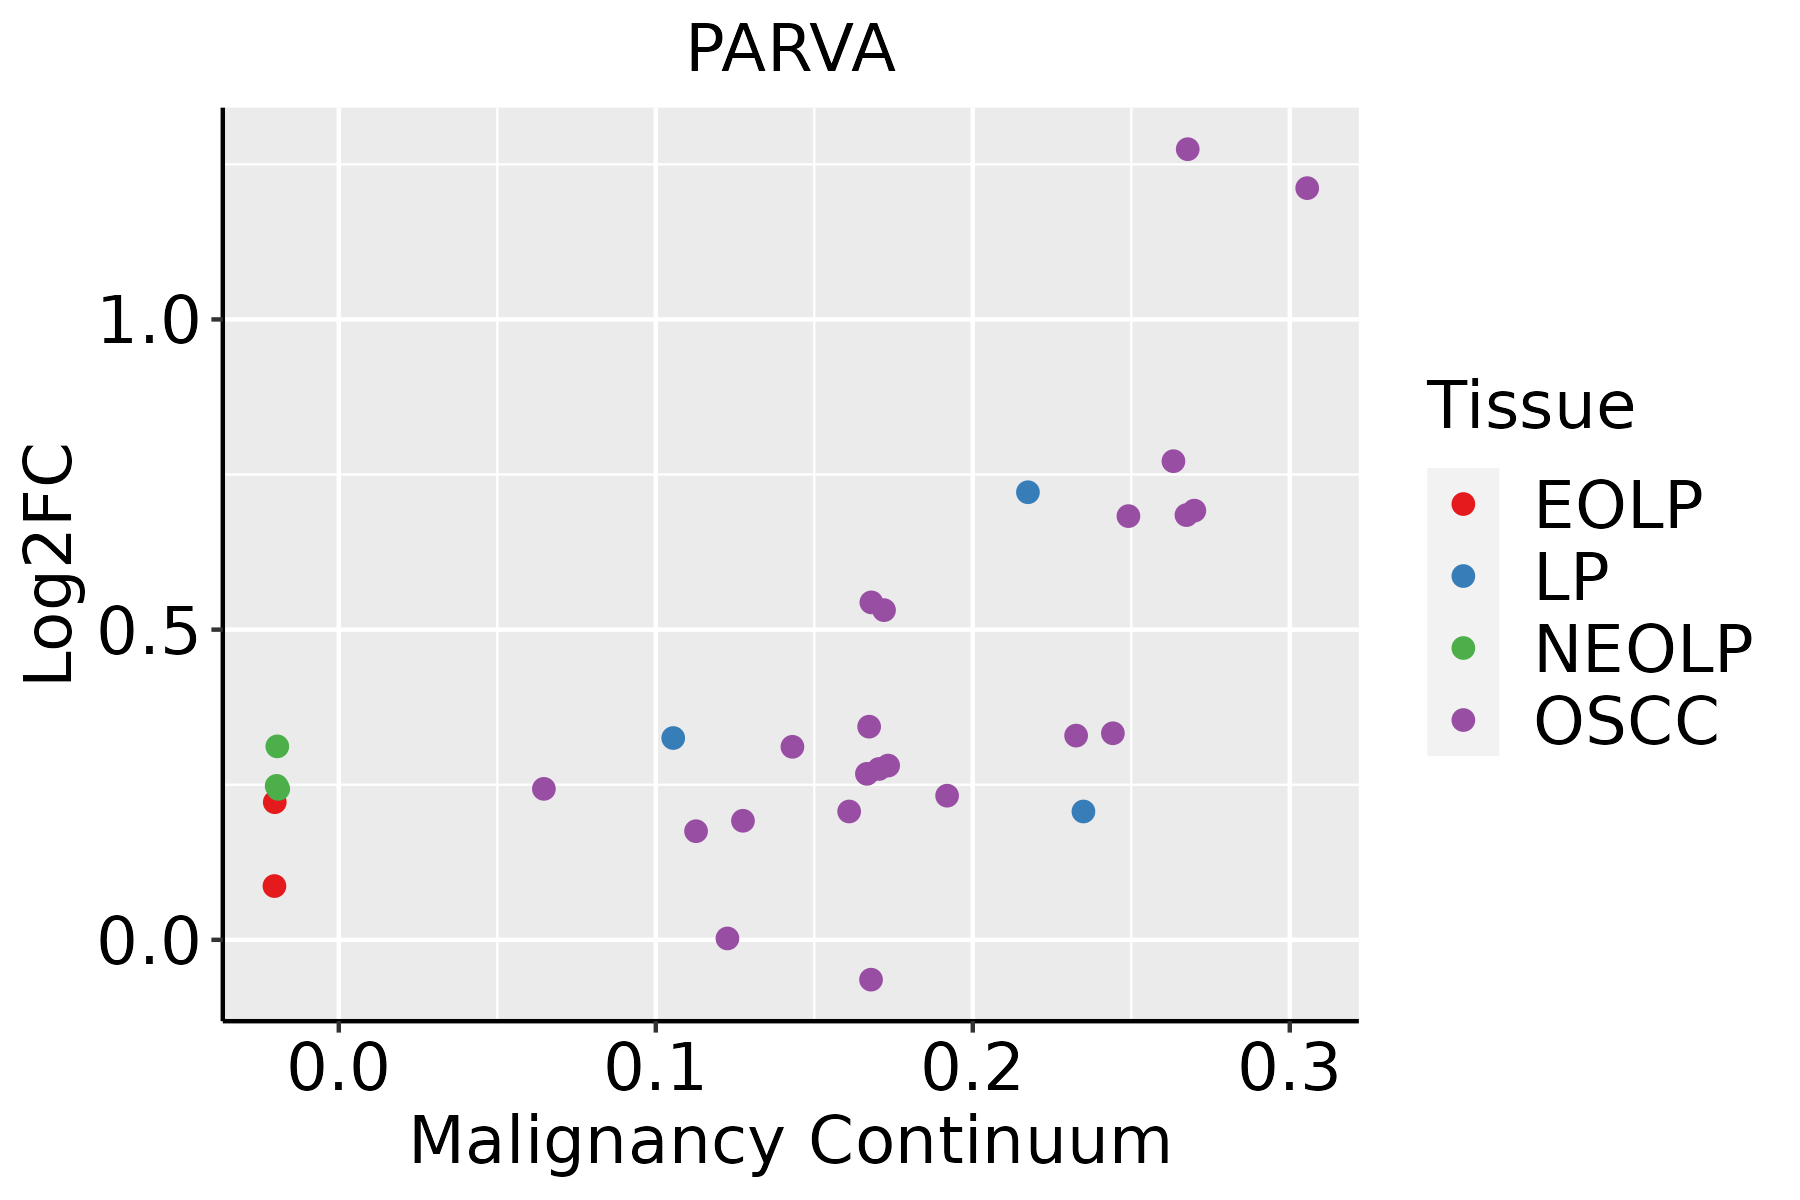 | EOLP: Erosive Oral lichen planus |
| LP: leukoplakia | ||
| NEOLP: Non-erosive oral lichen planus | ||
| OSCC: Oral squamous cell carcinoma | ||
| Skin | 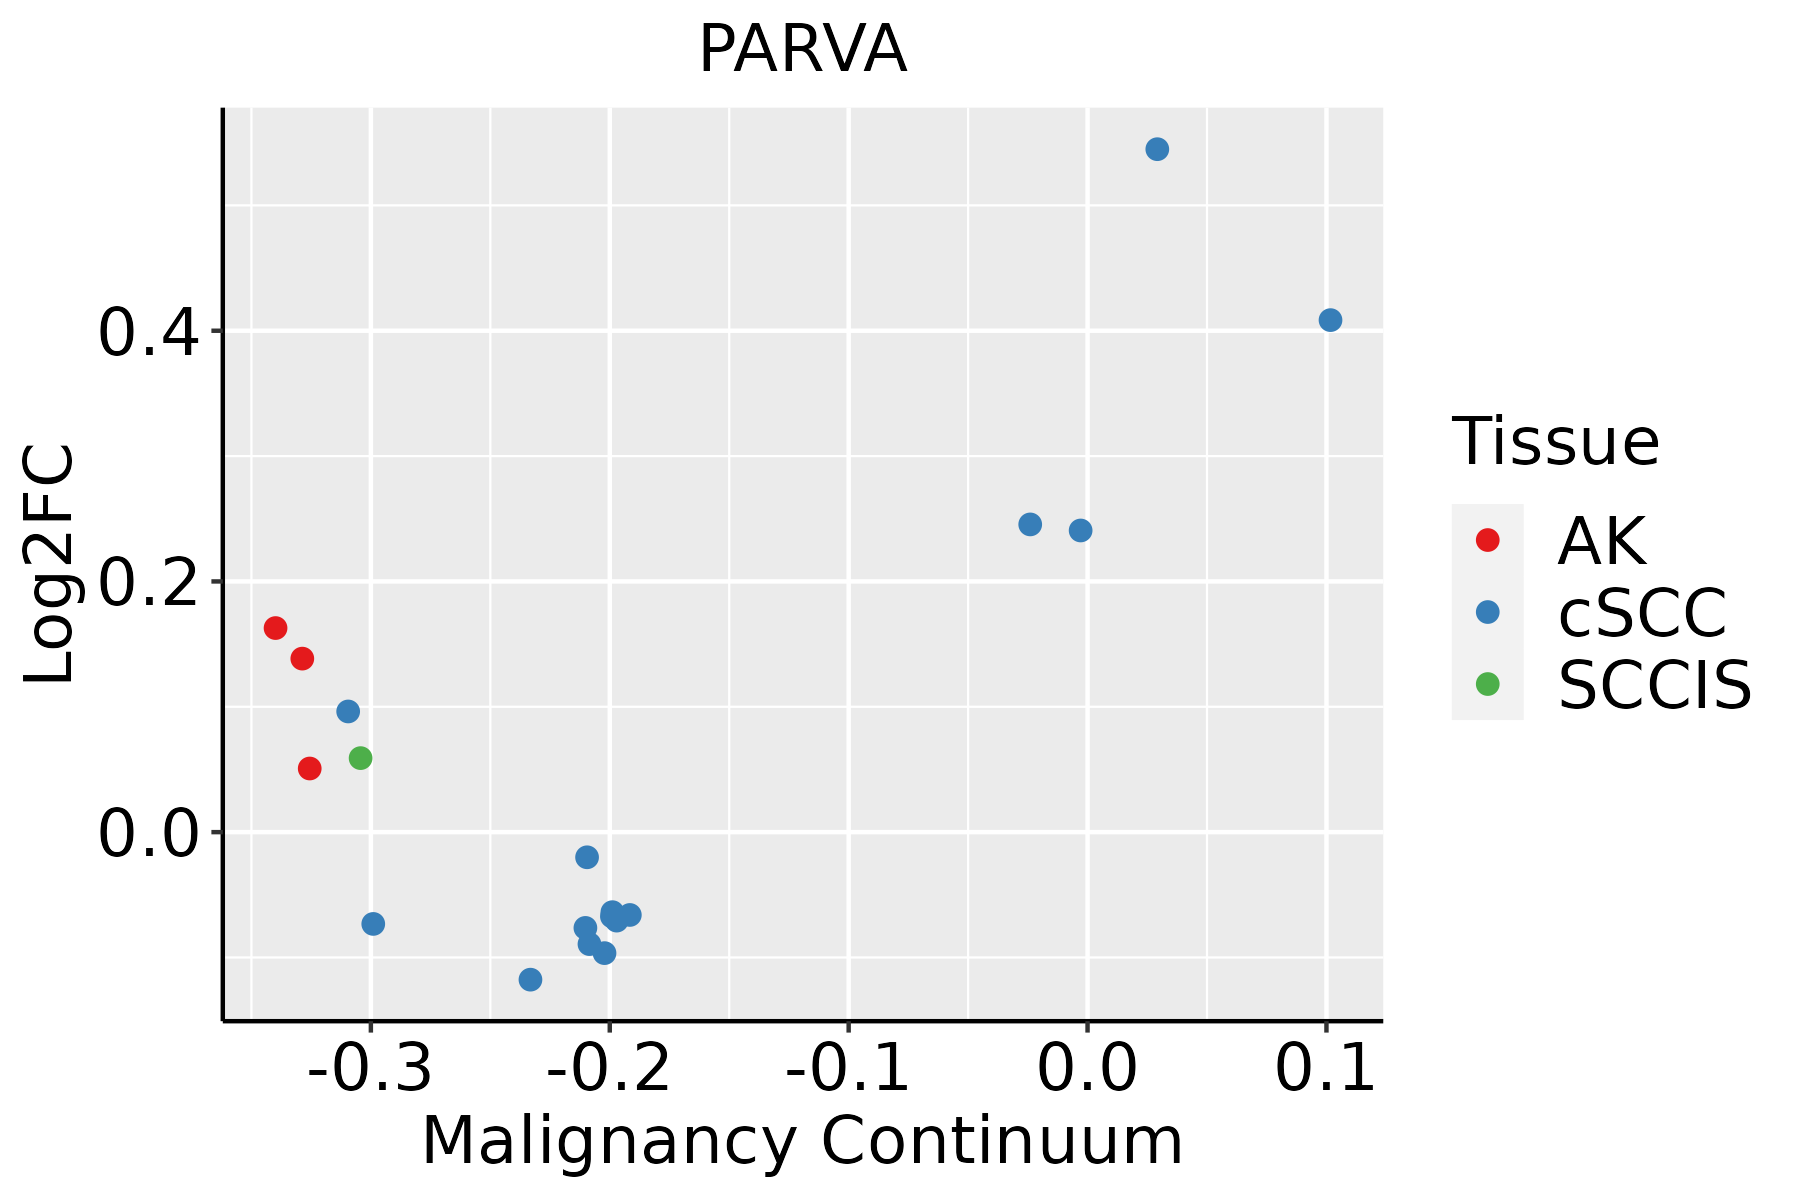 | AK: Actinic keratosis |
| cSCC: Cutaneous squamous cell carcinoma | ||
| SCCIS:squamous cell carcinoma in situ | ||
| Thyroid | 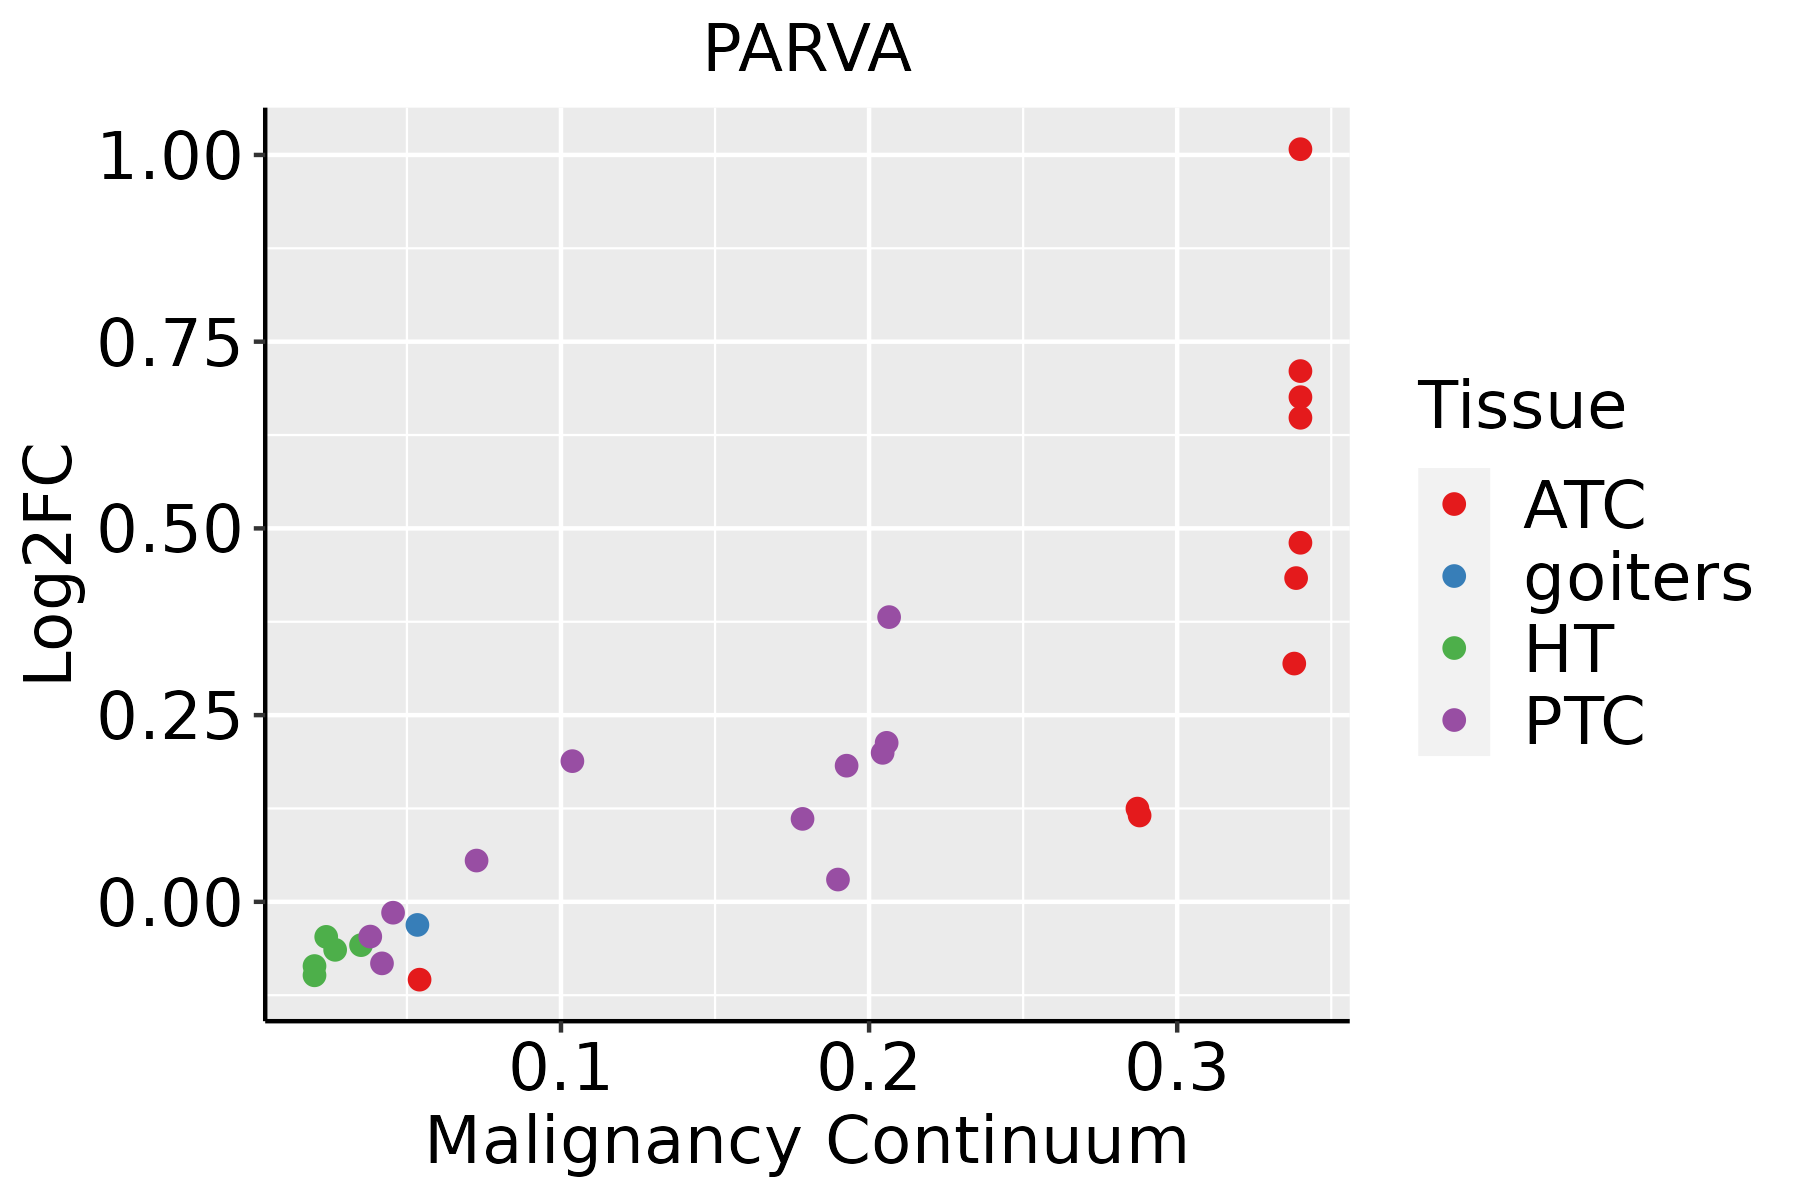 | ATC: Anaplastic thyroid cancer |
| HT: Hashimoto's thyroiditis | ||
| PTC: Papillary thyroid cancer |
| ∗log2FC in expression of this searched gene in stem-like cells from each diseased tissue sample relative to stem-like cells in normal samples in each tissue plotted against the malignancy continuum. Samples are colored based on if they are from different disease stage. |
Top |
Malignant transformation related pathway analysis |
| Find out the enriched GO biological processes and KEGG pathways involved in transition from healthy to precancer to cancer |
| Tissue | Disease Stage | Enriched GO biological Processes |
| Colorectum | AD |  |
| Colorectum | SER |  |
| Colorectum | MSS |  |
| Colorectum | MSI-H |  |
| Colorectum | FAP |  |
| ∗Top 15 enriched GO BP terms are showed in the bar plot of each disease state in each tissue. Each row represents a significant GO biological process which is colored according to the -log10(p.adjust). |
| Page: 1 2 3 4 5 6 7 8 9 |
| GO ID | Tissue | Disease Stage | Description | Gene Ratio | Bg Ratio | pvalue | p.adjust | Count |
| GO:00316472 | Colorectum | MSS | regulation of protein stability | 103/3467 | 298/18723 | 2.52e-11 | 3.49e-09 | 103 |
| GO:00226042 | Colorectum | MSS | regulation of cell morphogenesis | 103/3467 | 309/18723 | 2.70e-10 | 2.56e-08 | 103 |
| GO:00508212 | Colorectum | MSS | protein stabilization | 68/3467 | 191/18723 | 1.53e-08 | 8.81e-07 | 68 |
| GO:00071632 | Colorectum | MSS | establishment or maintenance of cell polarity | 72/3467 | 218/18723 | 1.90e-07 | 8.30e-06 | 72 |
| GO:00315322 | Colorectum | MSS | actin cytoskeleton reorganization | 41/3467 | 107/18723 | 1.21e-06 | 4.06e-05 | 41 |
| GO:00315892 | Colorectum | MSS | cell-substrate adhesion | 104/3467 | 363/18723 | 1.35e-06 | 4.51e-05 | 104 |
| GO:00083602 | Colorectum | MSS | regulation of cell shape | 52/3467 | 154/18723 | 4.40e-06 | 1.24e-04 | 52 |
| GO:00300482 | Colorectum | MSS | actin filament-based movement | 44/3467 | 127/18723 | 1.11e-05 | 2.64e-04 | 44 |
| GO:00344462 | Colorectum | MSS | substrate adhesion-dependent cell spreading | 39/3467 | 108/18723 | 1.15e-05 | 2.71e-04 | 39 |
| GO:0070252 | Colorectum | MSS | actin-mediated cell contraction | 29/3467 | 97/18723 | 4.38e-03 | 3.10e-02 | 29 |
| GO:00226044 | Colorectum | FAP | regulation of cell morphogenesis | 87/2622 | 309/18723 | 4.89e-11 | 1.87e-08 | 87 |
| GO:00315893 | Colorectum | FAP | cell-substrate adhesion | 93/2622 | 363/18723 | 2.48e-09 | 4.61e-07 | 93 |
| GO:00071633 | Colorectum | FAP | establishment or maintenance of cell polarity | 64/2622 | 218/18723 | 2.83e-09 | 5.07e-07 | 64 |
| GO:00300483 | Colorectum | FAP | actin filament-based movement | 44/2622 | 127/18723 | 3.48e-09 | 5.93e-07 | 44 |
| GO:00315323 | Colorectum | FAP | actin cytoskeleton reorganization | 34/2622 | 107/18723 | 1.99e-06 | 8.03e-05 | 34 |
| GO:00508214 | Colorectum | FAP | protein stabilization | 51/2622 | 191/18723 | 2.63e-06 | 9.96e-05 | 51 |
| GO:00083603 | Colorectum | FAP | regulation of cell shape | 43/2622 | 154/18723 | 4.55e-06 | 1.52e-04 | 43 |
| GO:00316474 | Colorectum | FAP | regulation of protein stability | 70/2622 | 298/18723 | 6.60e-06 | 2.04e-04 | 70 |
| GO:00702521 | Colorectum | FAP | actin-mediated cell contraction | 28/2622 | 97/18723 | 1.06e-04 | 1.76e-03 | 28 |
| GO:00344464 | Colorectum | FAP | substrate adhesion-dependent cell spreading | 30/2622 | 108/18723 | 1.32e-04 | 2.12e-03 | 30 |
| Page: 1 2 3 4 5 6 7 |
| Pathway ID | Tissue | Disease Stage | Description | Gene Ratio | Bg Ratio | pvalue | p.adjust | qvalue | Count |
| hsa045102 | Colorectum | FAP | Focal adhesion | 61/1404 | 203/8465 | 1.03e-06 | 2.15e-05 | 1.31e-05 | 61 |
| hsa045103 | Colorectum | FAP | Focal adhesion | 61/1404 | 203/8465 | 1.03e-06 | 2.15e-05 | 1.31e-05 | 61 |
| hsa045104 | Colorectum | CRC | Focal adhesion | 51/1091 | 203/8465 | 1.29e-06 | 5.41e-05 | 3.66e-05 | 51 |
| hsa045105 | Colorectum | CRC | Focal adhesion | 51/1091 | 203/8465 | 1.29e-06 | 5.41e-05 | 3.66e-05 | 51 |
| hsa0451020 | Esophagus | ESCC | Focal adhesion | 127/4205 | 203/8465 | 1.25e-04 | 4.99e-04 | 2.56e-04 | 127 |
| hsa04510111 | Esophagus | ESCC | Focal adhesion | 127/4205 | 203/8465 | 1.25e-04 | 4.99e-04 | 2.56e-04 | 127 |
| hsa0451021 | Liver | Cirrhotic | Focal adhesion | 93/2530 | 203/8465 | 9.27e-07 | 1.10e-05 | 6.80e-06 | 93 |
| hsa0451031 | Liver | Cirrhotic | Focal adhesion | 93/2530 | 203/8465 | 9.27e-07 | 1.10e-05 | 6.80e-06 | 93 |
| hsa0451041 | Liver | HCC | Focal adhesion | 125/4020 | 203/8465 | 3.12e-05 | 1.88e-04 | 1.04e-04 | 125 |
| hsa0451051 | Liver | HCC | Focal adhesion | 125/4020 | 203/8465 | 3.12e-05 | 1.88e-04 | 1.04e-04 | 125 |
| hsa0451019 | Oral cavity | OSCC | Focal adhesion | 128/3704 | 203/8465 | 1.71e-08 | 1.63e-07 | 8.31e-08 | 128 |
| hsa04510110 | Oral cavity | OSCC | Focal adhesion | 128/3704 | 203/8465 | 1.71e-08 | 1.63e-07 | 8.31e-08 | 128 |
| hsa0451043 | Oral cavity | NEOLP | Focal adhesion | 71/1112 | 203/8465 | 7.25e-16 | 7.68e-14 | 4.83e-14 | 71 |
| hsa0451053 | Oral cavity | NEOLP | Focal adhesion | 71/1112 | 203/8465 | 7.25e-16 | 7.68e-14 | 4.83e-14 | 71 |
| Page: 1 |
Top |
Cell-cell communication analysis |
| Identification of potential cell-cell interactions between two cell types and their ligand-receptor pairs for different disease states |
| Ligand | Receptor | LRpair | Pathway | Tissue | Disease Stage |
| Page: 1 |
Top |
Single-cell gene regulatory network inference analysis |
| Find out the significant the regulons (TFs) and the target genes of each regulon across cell types for different disease states |
| TF | Cell Type | Tissue | Disease Stage | Target Gene | RSS | Regulon Activity |
| ∗The dot plots of a searched regulon are shown for all cell subpopulations in each disease state of each tissue based on the regulon specific score inferred using pySCENIC and by calculating the average expression. |
| Page: 1 |
Top |
Somatic mutation of malignant transformation related genes |
| Annotation of somatic variants for genes involved in malignant transformation |
| Hugo Symbol | Variant Class | Variant Classification | dbSNP RS | HGVSc | HGVSp | HGVSp Short | SWISSPROT | BIOTYPE | SIFT | PolyPhen | Tumor Sample Barcode | Tissue | Histology | Sex | Age | Stage | Therapy Types | Drugs | Outcome |
| PARVA | SNV | Missense_Mutation | rs138341373 | c.331G>A | p.Glu111Lys | p.E111K | protein_coding | tolerated(0.12) | probably_damaging(0.997) | TCGA-A8-A0A9-01 | Breast | breast invasive carcinoma | Female | >=65 | I/II | Hormone Therapy | anastrozole | SD | |
| PARVA | SNV | Missense_Mutation | novel | c.43N>G | p.Gln15Glu | p.Q15E | protein_coding | benign(0.095) | TCGA-UC-A7PG-06 | Cervix | cervical & endocervical cancer | Female | <65 | III/IV | Chemotherapy | cisplatin | PD | ||
| PARVA | SNV | Missense_Mutation | novel | c.236N>A | p.Arg79Gln | p.R79Q | protein_coding | deleterious(0.01) | possibly_damaging(0.897) | TCGA-A6-5659-01 | Colorectum | colon adenocarcinoma | Male | >=65 | I/II | Unknown | Unknown | SD | |
| PARVA | SNV | Missense_Mutation | c.917A>G | p.Lys306Arg | p.K306R | protein_coding | tolerated(0.27) | benign(0.027) | TCGA-AA-3811-01 | Colorectum | colon adenocarcinoma | Female | >=65 | III/IV | Unknown | Unknown | PD | ||
| PARVA | SNV | Missense_Mutation | c.731N>A | p.Pro244Gln | p.P244Q | protein_coding | deleterious(0.03) | probably_damaging(1) | TCGA-A5-A0G2-01 | Endometrium | uterine corpus endometrioid carcinoma | Female | <65 | III/IV | Unknown | Unknown | SD | ||
| PARVA | SNV | Missense_Mutation | novel | c.793N>A | p.Leu265Ile | p.L265I | protein_coding | deleterious(0.03) | probably_damaging(0.997) | TCGA-AJ-A3EK-01 | Endometrium | uterine corpus endometrioid carcinoma | Female | <65 | I/II | Chemotherapy | carboplatin | CR | |
| PARVA | SNV | Missense_Mutation | novel | c.1126G>T | p.Asp376Tyr | p.D376Y | protein_coding | deleterious(0) | probably_damaging(1) | TCGA-AJ-A5DW-01 | Endometrium | uterine corpus endometrioid carcinoma | Female | <65 | I/II | Unknown | Unknown | SD | |
| PARVA | SNV | Missense_Mutation | novel | c.395N>A | p.Pro132His | p.P132H | protein_coding | deleterious(0) | possibly_damaging(0.525) | TCGA-AP-A1DK-01 | Endometrium | uterine corpus endometrioid carcinoma | Female | <65 | I/II | Unknown | Unknown | SD | |
| PARVA | SNV | Missense_Mutation | novel | c.287N>T | p.Ala96Val | p.A96V | protein_coding | deleterious(0) | possibly_damaging(0.898) | TCGA-B5-A3FC-01 | Endometrium | uterine corpus endometrioid carcinoma | Female | <65 | I/II | Unknown | Unknown | SD | |
| PARVA | SNV | Missense_Mutation | novel | c.432N>T | p.Trp144Cys | p.W144C | protein_coding | deleterious(0) | probably_damaging(0.959) | TCGA-BG-A222-01 | Endometrium | uterine corpus endometrioid carcinoma | Female | <65 | I/II | Unknown | Unknown | SD |
| Page: 1 2 |
Top |
Related drugs of malignant transformation related genes |
| Identification of chemicals and drugs interact with genes involved in malignant transfromation |
| (DGIdb 4.0) |
| Entrez ID | Symbol | Category | Interaction Types | Drug Claim Name | Drug Name | PMIDs |
| Page: 1 |

Copyright 2023-Present -The University of Texas Health Science Center at Houston |