Schematic overview of the cellular and molecular mechanisms involved in the cancer progression, including the proposed cellular and molecular mechanisms in cancer cells trajectory. AT1: alveolar type 1 cells; AT2: alveolar type 2 cells; AAH: atypical adenomatous hyperplasia; AIS: adenocarcinoma in situ; MIA: minimally invasive adenocarcinoma; IA: invasive adenocarcinoma; EMT: epithelial-mesenchymal transition

Home

Download

Statistics

Help

Contact

Center for Computational Systems Medicine
leaf

Gene summary

leaf

Malignant transformation analysis

leaf

Malignant transformation related pathway analysis

leaf

Cell-cell communication analysis

leaf

Single-cell gene regulatory network inference analysis

leaf

Somatic mutation of malignant transformation related genes

leaf

Related drugs of malignant transformation related genes

Gene: PARP9

Gene summary for PARP9

check button Gene summary.

Gene informationSpeciesHuman
Gene symbol

PARP9

Gene ID

83666

Gene namepoly(ADP-ribose) polymerase family member 9
Gene AliasARTD9
Cytomap3q21.1
Gene Typeprotein-coding
GO ID

GO:0000122

UniProtAcc

Q8IXQ6


Top

Malignant transformation analysis

check button Identification of the aberrant gene expression in precancerous and cancerous lesions by comparing the gene expression of stem-like cells in diseased tissues with normal stem cells
check button Malignant transformation involving gene list.
Entrez IDSymbolReplicatesSpeciesOrganTissueAdj P-valueLog2FCMalignancy
83666PARP9CA_HPV_1HumanCervixCC6.64e-062.89e-010.0264
83666PARP9CA_HPV_2HumanCervixCC1.87e-052.90e-010.0391
83666PARP9CCI_1HumanCervixCC1.68e-047.68e-010.528
83666PARP9CCI_2HumanCervixCC1.70e-081.04e+000.5249
83666PARP9CCI_3HumanCervixCC6.34e-161.41e+000.516
83666PARP9TumorHumanCervixCC5.47e-316.60e-010.1241
83666PARP9sample3HumanCervixCC6.88e-366.68e-010.1387
83666PARP9T3HumanCervixCC9.19e-336.38e-010.1389
83666PARP9HTA11_1391_2000001011HumanColorectumAD1.71e-044.04e-01-0.059
83666PARP9HTA11_99999970781_79442HumanColorectumMSS1.92e-218.15e-010.294
83666PARP9HTA11_99999965062_69753HumanColorectumMSI-H1.32e-041.06e+000.3487
83666PARP9LZE4THumanEsophagusESCC1.65e-134.30e-010.0811
83666PARP9LZE5THumanEsophagusESCC1.39e-032.56e-010.0514
83666PARP9LZE7THumanEsophagusESCC4.74e-022.99e-010.0667
83666PARP9LZE8THumanEsophagusESCC1.17e-063.53e-010.067
83666PARP9LZE20THumanEsophagusESCC1.01e-052.70e-010.0662
83666PARP9LZE22THumanEsophagusESCC1.85e-021.70e-010.068
83666PARP9LZE24THumanEsophagusESCC3.65e-381.11e+000.0596
83666PARP9LZE21THumanEsophagusESCC1.03e-022.47e-010.0655
83666PARP9P1T-EHumanEsophagusESCC8.35e-147.49e-010.0875
Page: 1 2 3 4 5 6 7 

check button Transcriptomic changes along malignancy continuum.
TissueExpression DynamicsAbbreviation
CervixThe image shows the transcriptomic changes along malignancy continuum.log2FC in expression of this searched gene in stem-like cells from each diseased tissue sample relative to stem-like cells in normal samples in each tissue plotted against the malignancy continuum. Samples are colored based on if they are from different disease stage.CC: Cervix cancer
HSIL_HPV: HPV-infected high-grade squamous intraepithelial lesions
N_HPV: HPV-infected normal cervix
Colorectum (GSE201348)The image shows the transcriptomic changes along malignancy continuum.log2FC in expression of this searched gene in stem-like cells from each diseased tissue sample relative to stem-like cells in normal samples in each tissue plotted against the malignancy continuum. Samples are colored based on if they are from different disease stage.FAP: Familial adenomatous polyposis
CRC: Colorectal cancer
Colorectum (HTA11)The image shows the transcriptomic changes along malignancy continuum.log2FC in expression of this searched gene in stem-like cells from each diseased tissue sample relative to stem-like cells in normal samples in each tissue plotted against the malignancy continuum. Samples are colored based on if they are from different disease stage.AD: Adenomas
SER: Sessile serrated lesions
MSI-H: Microsatellite-high colorectal cancer
MSS: Microsatellite stable colorectal cancer
EsophagusThe image shows the transcriptomic changes along malignancy continuum.log2FC in expression of this searched gene in stem-like cells from each diseased tissue sample relative to stem-like cells in normal samples in each tissue plotted against the malignancy continuum. Samples are colored based on if they are from different disease stage.ESCC: Esophageal squamous cell carcinoma
HGIN: High-grade intraepithelial neoplasias
LGIN: Low-grade intraepithelial neoplasias
LiverThe image shows the transcriptomic changes along malignancy continuum.log2FC in expression of this searched gene in stem-like cells from each diseased tissue sample relative to stem-like cells in normal samples in each tissue plotted against the malignancy continuum. Samples are colored based on if they are from different disease stage.
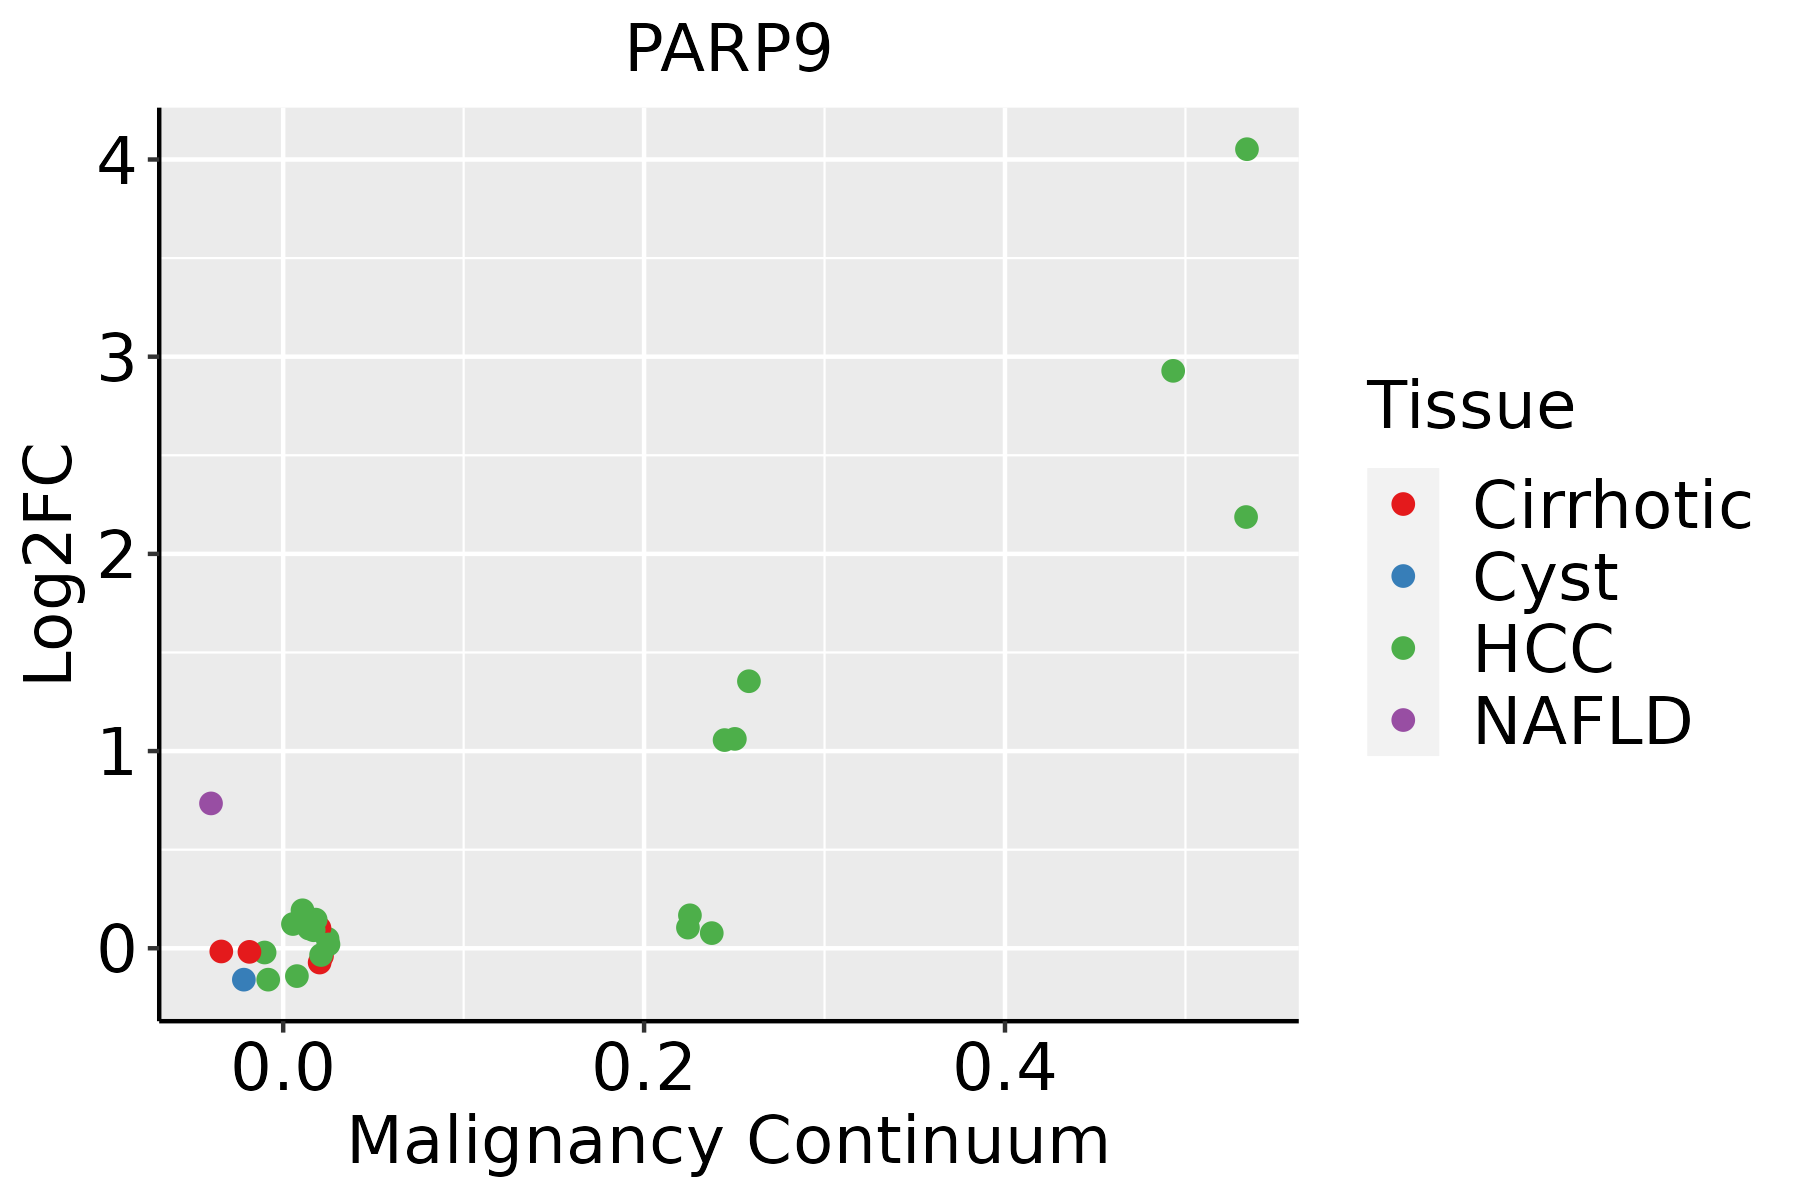
HCC: Hepatocellular carcinoma
NAFLD: Non-alcoholic fatty liver disease
Oral CavityThe image shows the transcriptomic changes along malignancy continuum.log2FC in expression of this searched gene in stem-like cells from each diseased tissue sample relative to stem-like cells in normal samples in each tissue plotted against the malignancy continuum. Samples are colored based on if they are from different disease stage.
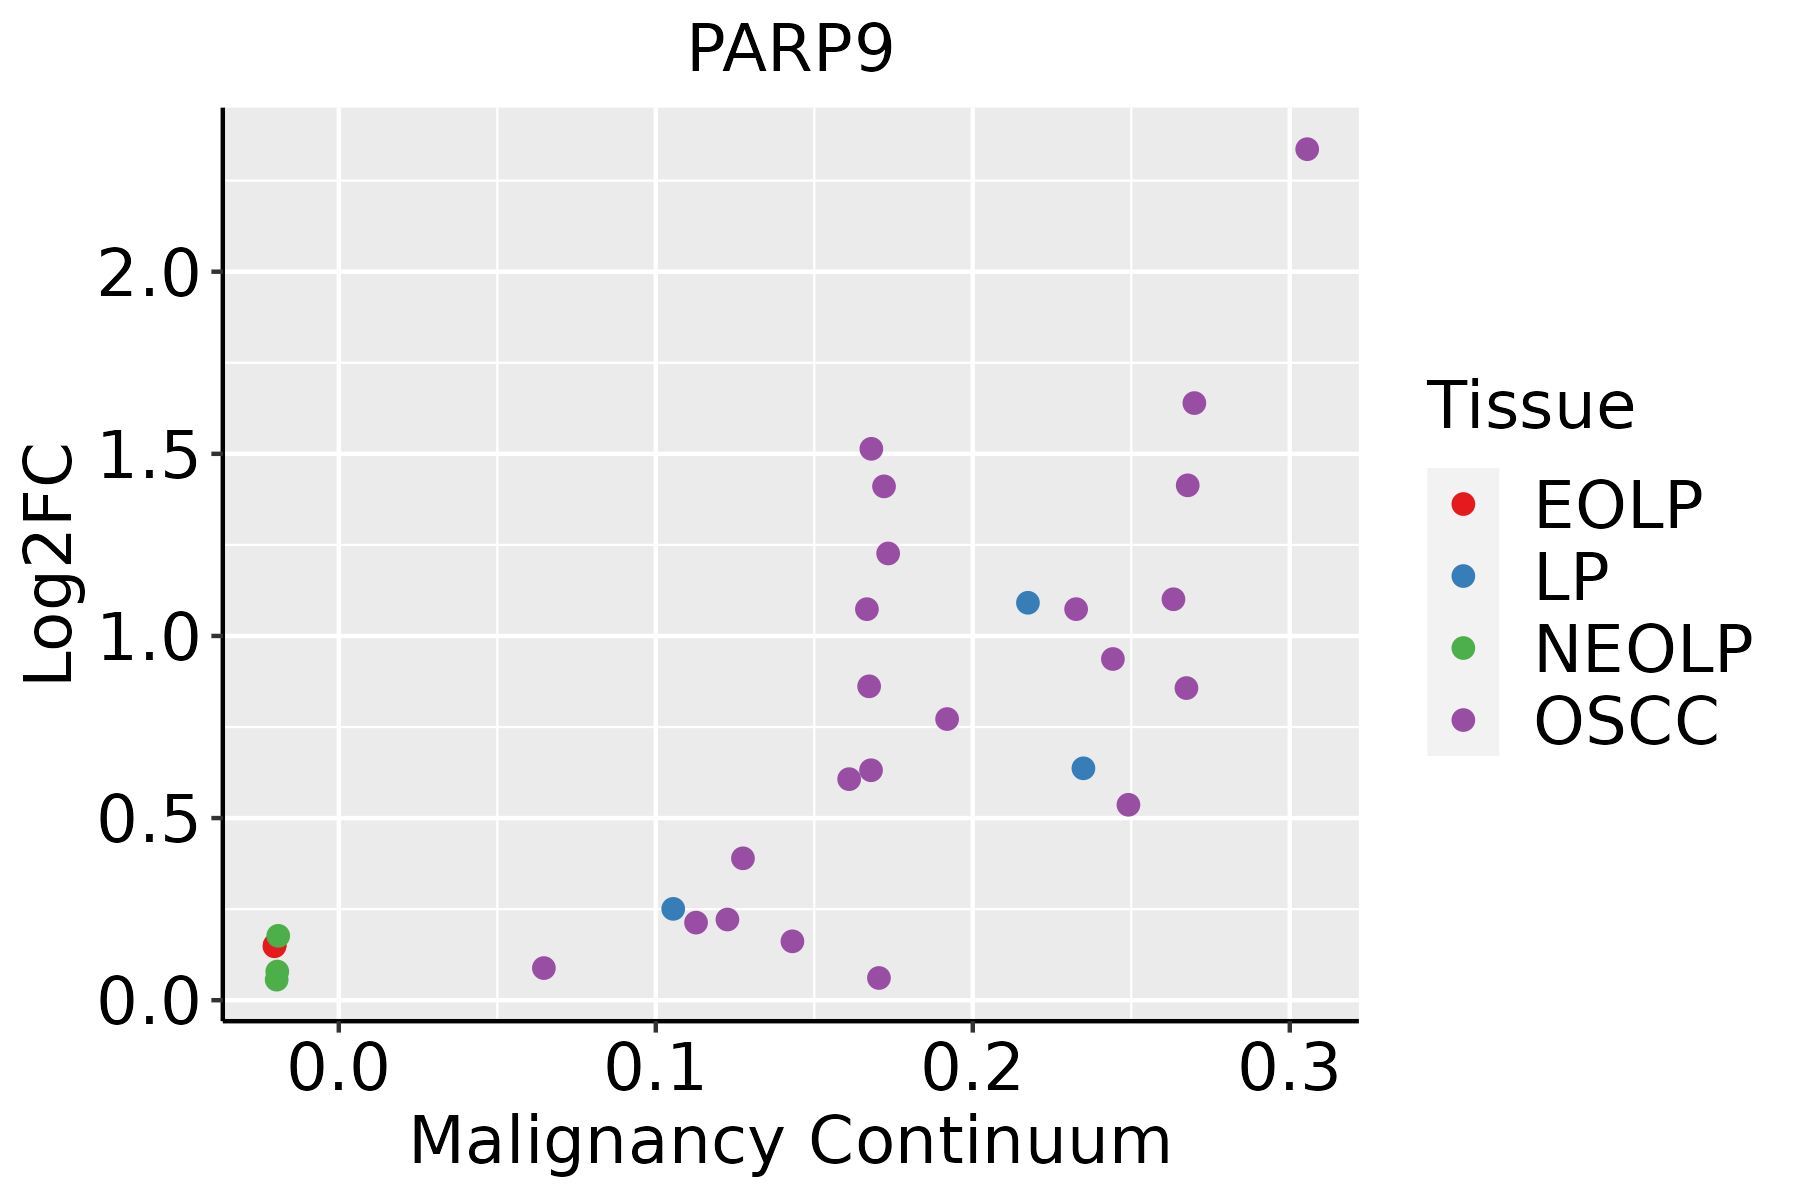
EOLP: Erosive Oral lichen planus
LP: leukoplakia
NEOLP: Non-erosive oral lichen planus
OSCC: Oral squamous cell carcinoma
SkinThe image shows the transcriptomic changes along malignancy continuum.log2FC in expression of this searched gene in stem-like cells from each diseased tissue sample relative to stem-like cells in normal samples in each tissue plotted against the malignancy continuum. Samples are colored based on if they are from different disease stage.
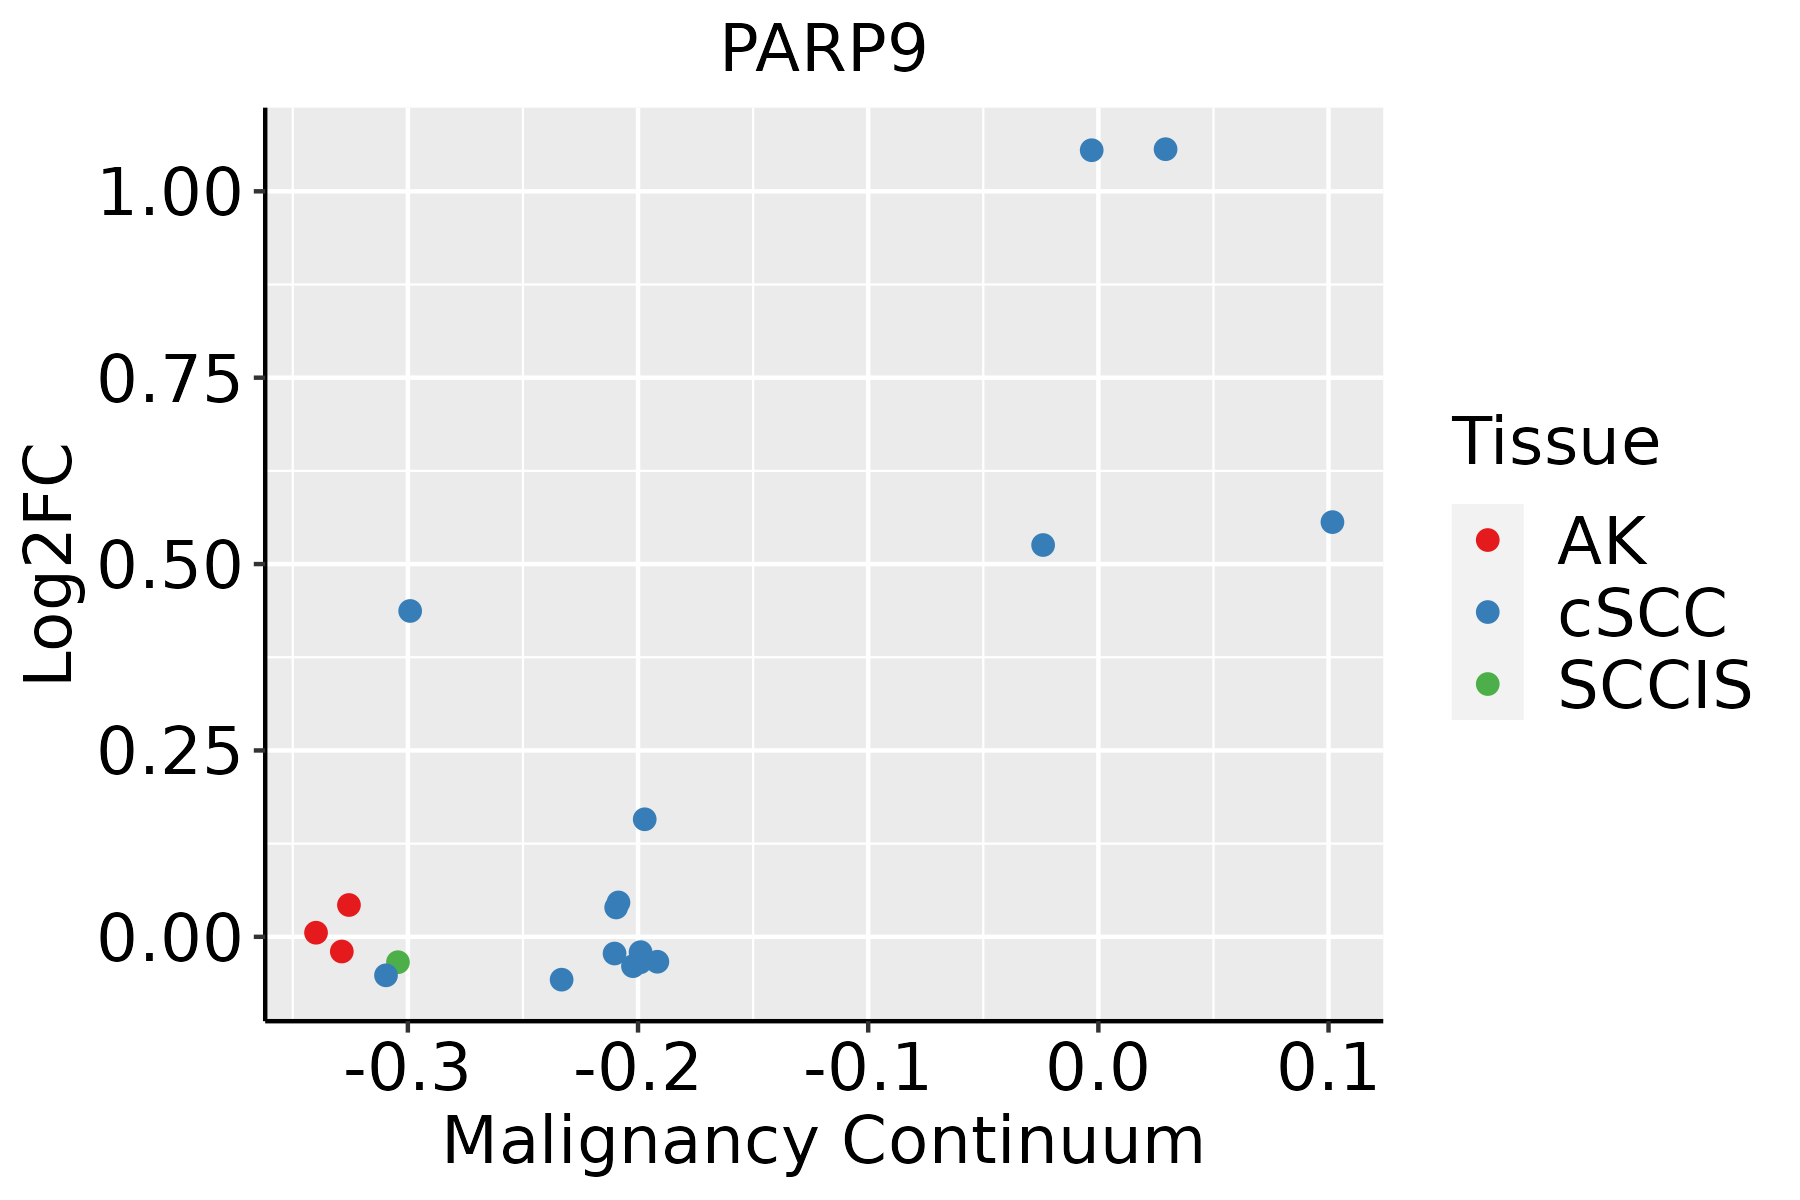
AK: Actinic keratosis
cSCC: Cutaneous squamous cell carcinoma
SCCIS:squamous cell carcinoma in situ
ThyroidThe image shows the transcriptomic changes along malignancy continuum.log2FC in expression of this searched gene in stem-like cells from each diseased tissue sample relative to stem-like cells in normal samples in each tissue plotted against the malignancy continuum. Samples are colored based on if they are from different disease stage.ATC: Anaplastic thyroid cancer
HT: Hashimoto's thyroiditis
PTC: Papillary thyroid cancer
∗log2FC in expression of this searched gene in stem-like cells from each diseased tissue sample relative to stem-like cells in normal samples in each tissue plotted against the malignancy continuum. Samples are colored based on if they are from different disease stage.

Top

Malignant transformation related pathway analysis

check buttonFind out the enriched GO biological processes and KEGG pathways involved in transition from healthy to precancer to cancer
check button Figure of enriched GO biological processes.
TissueDisease StageEnriched GO biological Processes
ColorectumADGO analysis - Figure of enriched GO biological processes: Top 15 enriched GO BP terms are showed in the bar plot of each disease state in each tissue. Each row represents a significant GO biological process which is colored according to the -log10(p.adjust).
ColorectumSERGO analysis - Figure of enriched GO biological processes: Top 15 enriched GO BP terms are showed in the bar plot of each disease state in each tissue. Each row represents a significant GO biological process which is colored according to the -log10(p.adjust).
ColorectumMSSGO analysis - Figure of enriched GO biological processes: Top 15 enriched GO BP terms are showed in the bar plot of each disease state in each tissue. Each row represents a significant GO biological process which is colored according to the -log10(p.adjust).
ColorectumMSI-HGO analysis - Figure of enriched GO biological processes: Top 15 enriched GO BP terms are showed in the bar plot of each disease state in each tissue. Each row represents a significant GO biological process which is colored according to the -log10(p.adjust).
ColorectumFAPGO analysis - Figure of enriched GO biological processes: Top 15 enriched GO BP terms are showed in the bar plot of each disease state in each tissue. Each row represents a significant GO biological process which is colored according to the -log10(p.adjust).
∗Top 15 enriched GO BP terms are showed in the bar plot of each disease state in each tissue. Each row represents a significant GO biological process which is colored according to the -log10(p.adjust).
Page: 1 2 3 4 5 6 7 8 9 

check button Enriched GO biological processes.
GO IDTissueDisease StageDescriptionGene RatioBg Ratiopvaluep.adjustCount
GO:001603210CervixCCviral process109/2311415/187235.40e-156.46e-12109
GO:190382910CervixCCpositive regulation of cellular protein localization72/2311276/187233.20e-104.46e-0872
GO:00321035CervixCCpositive regulation of response to external stimulus95/2311427/187235.44e-095.03e-0795
GO:00345048CervixCCprotein localization to nucleus68/2311290/187239.91e-085.25e-0668
GO:005109810CervixCCregulation of binding80/2311363/187231.32e-076.42e-0680
GO:00313494CervixCCpositive regulation of defense response60/2311278/187239.38e-062.11e-0460
GO:005109910CervixCCpositive regulation of binding42/2311173/187231.07e-052.33e-0442
GO:00028315CervixCCregulation of response to biotic stimulus67/2311327/187231.79e-053.36e-0467
GO:00096158CervixCCresponse to virus73/2311367/187232.22e-053.95e-0473
GO:20010209CervixCCregulation of response to DNA damage stimulus46/2311219/187231.92e-042.23e-0346
GO:00192213CervixCCcytokine-mediated signaling pathway84/2311472/187233.25e-043.44e-0384
GO:19001808CervixCCregulation of protein localization to nucleus31/2311136/187234.76e-044.69e-0331
GO:00450882CervixCCregulation of innate immune response44/2311218/187236.40e-045.97e-0344
GO:19001827CervixCCpositive regulation of protein localization to nucleus22/231187/187237.03e-046.40e-0322
GO:00510528CervixCCregulation of DNA metabolic process65/2311359/187239.25e-047.84e-0365
GO:00028331CervixCCpositive regulation of response to biotic stimulus35/2311168/187231.23e-039.87e-0335
GO:00343415CervixCCresponse to interferon-gamma30/2311141/187231.88e-031.39e-0230
GO:00603333CervixCCinterferon-gamma-mediated signaling pathway9/231127/187233.82e-032.41e-029
GO:00713463CervixCCcellular response to interferon-gamma25/2311118/187234.54e-032.75e-0225
GO:00190807CervixCCviral gene expression21/231194/187234.68e-032.82e-0221
Page: 1 2 3 4 5 6 7 8 9 10 11 12 13 14 15 16 17 18 19 20 21 22 

check button Enriched KEGG pathways.
Pathway IDTissueDisease StageDescriptionGene RatioBg Ratiopvaluep.adjustqvalueCount
Page: 1 

Top

Cell-cell communication analysis

check buttonIdentification of potential cell-cell interactions between two cell types and their ligand-receptor pairs for different disease states
LigandReceptorLRpairPathwayTissueDisease Stage
Page: 1 

Top

Single-cell gene regulatory network inference analysis

check buttonFind out the significant the regulons (TFs) and the target genes of each regulon across cell types for different disease states
TFCell TypeTissueDisease StageTarget GeneRSSRegulon Activity
∗The dot plots of a searched regulon are shown for all cell subpopulations in each disease state of each tissue based on the regulon specific score inferred using pySCENIC and by calculating the average expression.
Page: 1 

Top

Somatic mutation of malignant transformation related genes

check buttonAnnotation of somatic variants for genes involved in malignant transformation
Hugo SymbolVariant ClassVariant ClassificationdbSNP RSHGVScHGVSpHGVSp ShortSWISSPROTBIOTYPESIFTPolyPhenTumor Sample BarcodeTissueHistologySexAgeStageTherapy TypesDrugsOutcome
PARP9SNVMissense_Mutationnovelc.914N>Ap.Thr305Asnp.T305NQ8IXQ6protein_codingdeleterious(0.04)possibly_damaging(0.598)TCGA-AC-A5EH-01Breastbreast invasive carcinomaFemale>=65I/IIUnknownUnknownSD
PARP9SNVMissense_Mutationnovelc.1010N>Ap.Ser337Tyrp.S337YQ8IXQ6protein_codingdeleterious(0)probably_damaging(0.995)TCGA-AN-A046-01Breastbreast invasive carcinomaFemale>=65I/IIUnknownUnknownSD
PARP9SNVMissense_Mutationc.2293G>Ap.Glu765Lysp.E765KQ8IXQ6protein_codingdeleterious(0)possibly_damaging(0.53)TCGA-AR-A0TX-01Breastbreast invasive carcinomaFemale<65I/IIUnknownUnknownSD
PARP9SNVMissense_Mutationc.152N>Tp.Ser51Leup.S51LQ8IXQ6protein_codingdeleterious(0.01)benign(0.049)TCGA-BH-A0H7-01Breastbreast invasive carcinomaFemale>=65III/IVChemotherapydoxorubicinSD
PARP9SNVMissense_Mutationnovelc.615N>Ap.Asp205Glup.D205EQ8IXQ6protein_codingtolerated(0.53)benign(0.022)TCGA-BH-A8FY-01Breastbreast invasive carcinomaFemale>=65I/IIUnknownUnknownSD
PARP9SNVMissense_Mutationc.170N>Cp.Gly57Alap.G57AQ8IXQ6protein_codingtolerated(0.72)benign(0.024)TCGA-D8-A27G-01Breastbreast invasive carcinomaFemale>=65I/IIUnknownUnknownSD
PARP9SNVMissense_Mutationc.1370A>Cp.His457Prop.H457PQ8IXQ6protein_codingdeleterious(0.01)benign(0.015)TCGA-E9-A1RF-01Breastbreast invasive carcinomaFemale>=65III/IVHormone TherapytamoxiphenSD
PARP9SNVMissense_Mutationnovelc.1903G>Cp.Asp635Hisp.D635HQ8IXQ6protein_codingtolerated(0.15)possibly_damaging(0.751)TCGA-EW-A3E8-01Breastbreast invasive carcinomaFemale<65I/IIHormone TherapyanastrozoleSD
PARP9SNVMissense_Mutationc.1678N>Tp.Asp560Tyrp.D560YQ8IXQ6protein_codingdeleterious(0.03)possibly_damaging(0.459)TCGA-GM-A2DO-01Breastbreast invasive carcinomaFemale<65I/IIHormone TherapytamoxiphenCR
PARP9insertionFrame_Shift_Insnovelc.1041_1042insCAAAAAACAAACAAAACAACAAp.Val348GlnfsTer19p.V348Qfs*19Q8IXQ6protein_codingTCGA-AO-A03T-01Breastbreast invasive carcinomaFemale<65I/IIChemotherapycyclophosphamideSD
Page: 1 2 3 4 5 6 7 8 9 

Top

Related drugs of malignant transformation related genes

check buttonIdentification of chemicals and drugs interact with genes involved in malignant transfromation
(DGIdb 4.0)
Entrez IDSymbolCategoryInteraction TypesDrug Claim NameDrug NamePMIDs
Page: 1