
|
|||||
|
 | |
| |
| |
| |
| |
| |
|
Gene: PARP8 |
Gene summary for PARP8 |
| Gene information | Species | Human | Gene symbol | PARP8 | Gene ID | 79668 |
| Gene name | poly(ADP-ribose) polymerase family member 8 | |
| Gene Alias | ARTD16 | |
| Cytomap | 5q11.1 | |
| Gene Type | protein-coding | GO ID | GO:0006464 | UniProtAcc | B2RB27 |
Top |
Malignant transformation analysis |
| Identification of the aberrant gene expression in precancerous and cancerous lesions by comparing the gene expression of stem-like cells in diseased tissues with normal stem cells |
| Entrez ID | Symbol | Replicates | Species | Organ | Tissue | Adj P-value | Log2FC | Malignancy |
| 79668 | PARP8 | CCI_2 | Human | Cervix | CC | 1.14e-13 | 1.05e+00 | 0.5249 |
| 79668 | PARP8 | CCI_3 | Human | Cervix | CC | 2.52e-16 | 8.81e-01 | 0.516 |
| 79668 | PARP8 | HTA11_99999970781_79442 | Human | Colorectum | MSS | 1.16e-07 | -2.33e-01 | 0.294 |
| 79668 | PARP8 | HTA11_99999965104_69814 | Human | Colorectum | MSS | 2.36e-02 | 4.12e-01 | 0.281 |
| 79668 | PARP8 | A002-C-010 | Human | Colorectum | FAP | 4.95e-02 | 4.90e-01 | 0.242 |
| 79668 | PARP8 | A015-C-203 | Human | Colorectum | FAP | 2.19e-03 | -1.75e-01 | -0.1294 |
| 79668 | PARP8 | A002-C-203 | Human | Colorectum | FAP | 6.91e-04 | 4.44e-01 | 0.2786 |
| 79668 | PARP8 | A002-C-021 | Human | Colorectum | FAP | 6.04e-09 | 3.86e-01 | 0.1171 |
| 79668 | PARP8 | A015-C-104 | Human | Colorectum | FAP | 3.26e-04 | -1.97e-01 | -0.1899 |
| 79668 | PARP8 | A015-C-202 | Human | Colorectum | FAP | 4.23e-05 | -2.69e-01 | -0.0849 |
| 79668 | PARP8 | A002-C-116 | Human | Colorectum | FAP | 7.42e-03 | 6.54e-02 | -0.0452 |
| 79668 | PARP8 | F034 | Human | Colorectum | FAP | 4.40e-03 | -1.10e-01 | -0.0665 |
| 79668 | PARP8 | F072B | Human | Colorectum | FAP | 6.96e-04 | 5.31e-01 | 0.257 |
| 79668 | PARP8 | CRC-1-8810 | Human | Colorectum | CRC | 2.12e-05 | 4.20e-01 | 0.6257 |
| 79668 | PARP8 | CRC-3-11773 | Human | Colorectum | CRC | 1.34e-09 | -2.73e-01 | 0.2564 |
| 79668 | PARP8 | LZE7T | Human | Esophagus | ESCC | 2.56e-10 | 3.70e-01 | 0.0667 |
| 79668 | PARP8 | LZE24T | Human | Esophagus | ESCC | 4.12e-11 | 4.07e-01 | 0.0596 |
| 79668 | PARP8 | LZE6T | Human | Esophagus | ESCC | 1.29e-03 | 2.51e-01 | 0.0845 |
| 79668 | PARP8 | P1T-E | Human | Esophagus | ESCC | 1.68e-04 | 2.70e-01 | 0.0875 |
| 79668 | PARP8 | P2T-E | Human | Esophagus | ESCC | 1.06e-05 | 2.01e-01 | 0.1177 |
| Page: 1 2 3 4 5 |
| Tissue | Expression Dynamics | Abbreviation |
| Cervix | 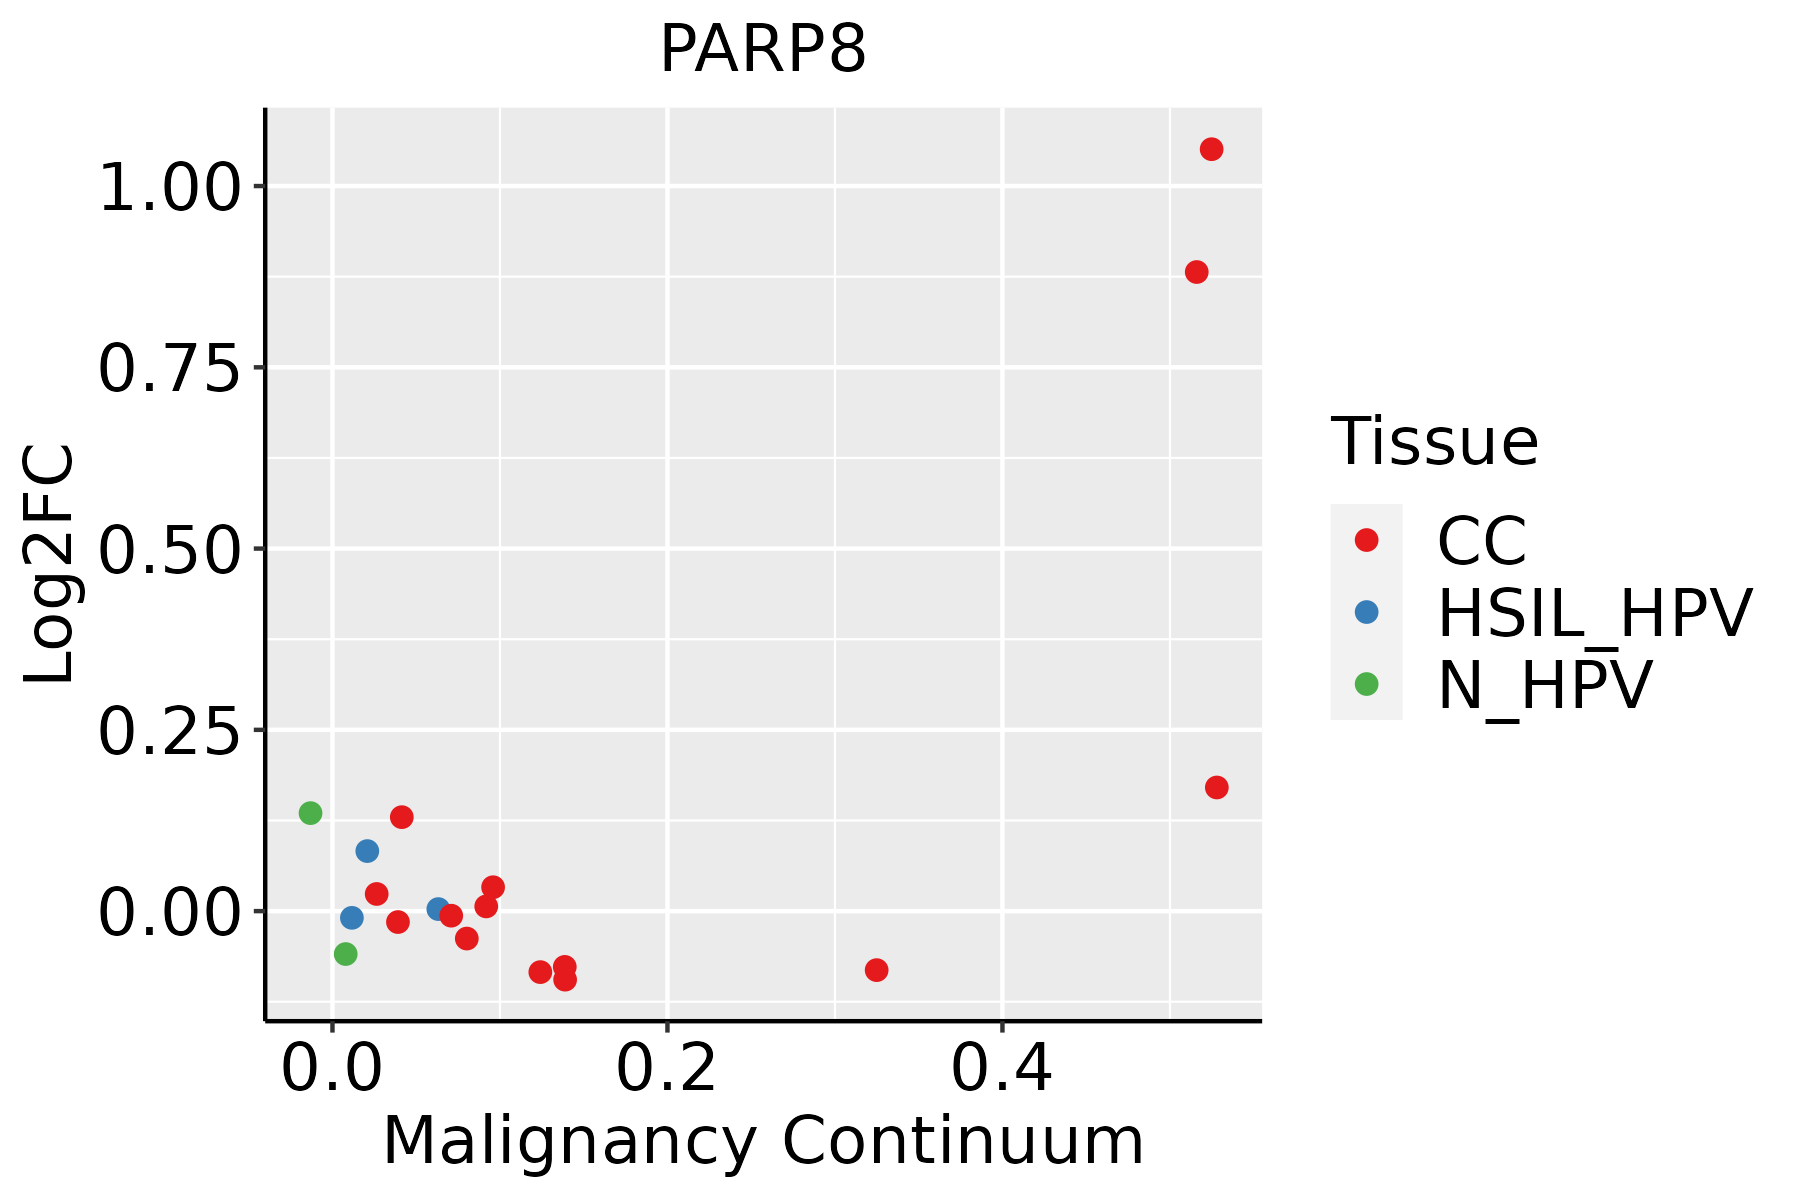 | CC: Cervix cancer |
| HSIL_HPV: HPV-infected high-grade squamous intraepithelial lesions | ||
| N_HPV: HPV-infected normal cervix | ||
| Colorectum (GSE201348) |  | FAP: Familial adenomatous polyposis |
| CRC: Colorectal cancer | ||
| Colorectum (HTA11) |  | AD: Adenomas |
| SER: Sessile serrated lesions | ||
| MSI-H: Microsatellite-high colorectal cancer | ||
| MSS: Microsatellite stable colorectal cancer | ||
| Esophagus | 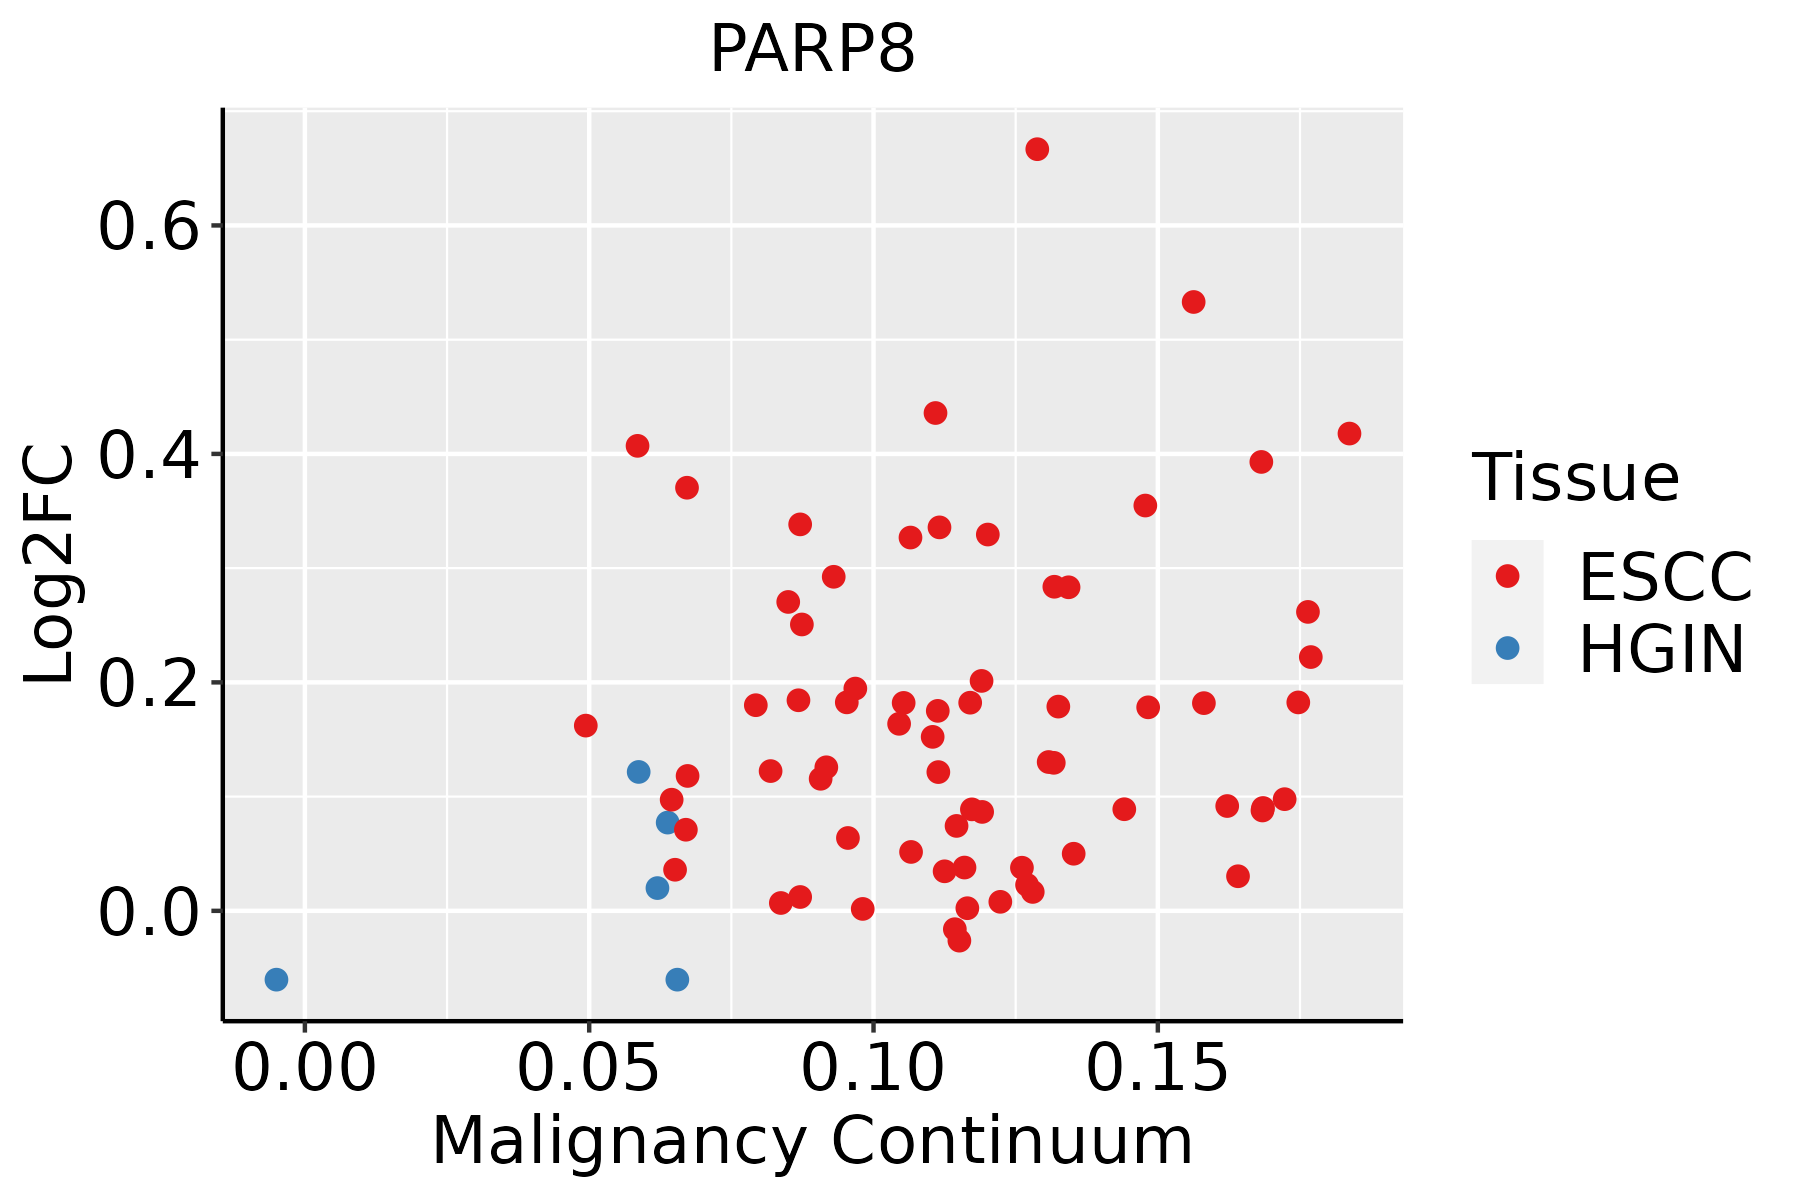 | ESCC: Esophageal squamous cell carcinoma |
| HGIN: High-grade intraepithelial neoplasias | ||
| LGIN: Low-grade intraepithelial neoplasias | ||
| Lung | 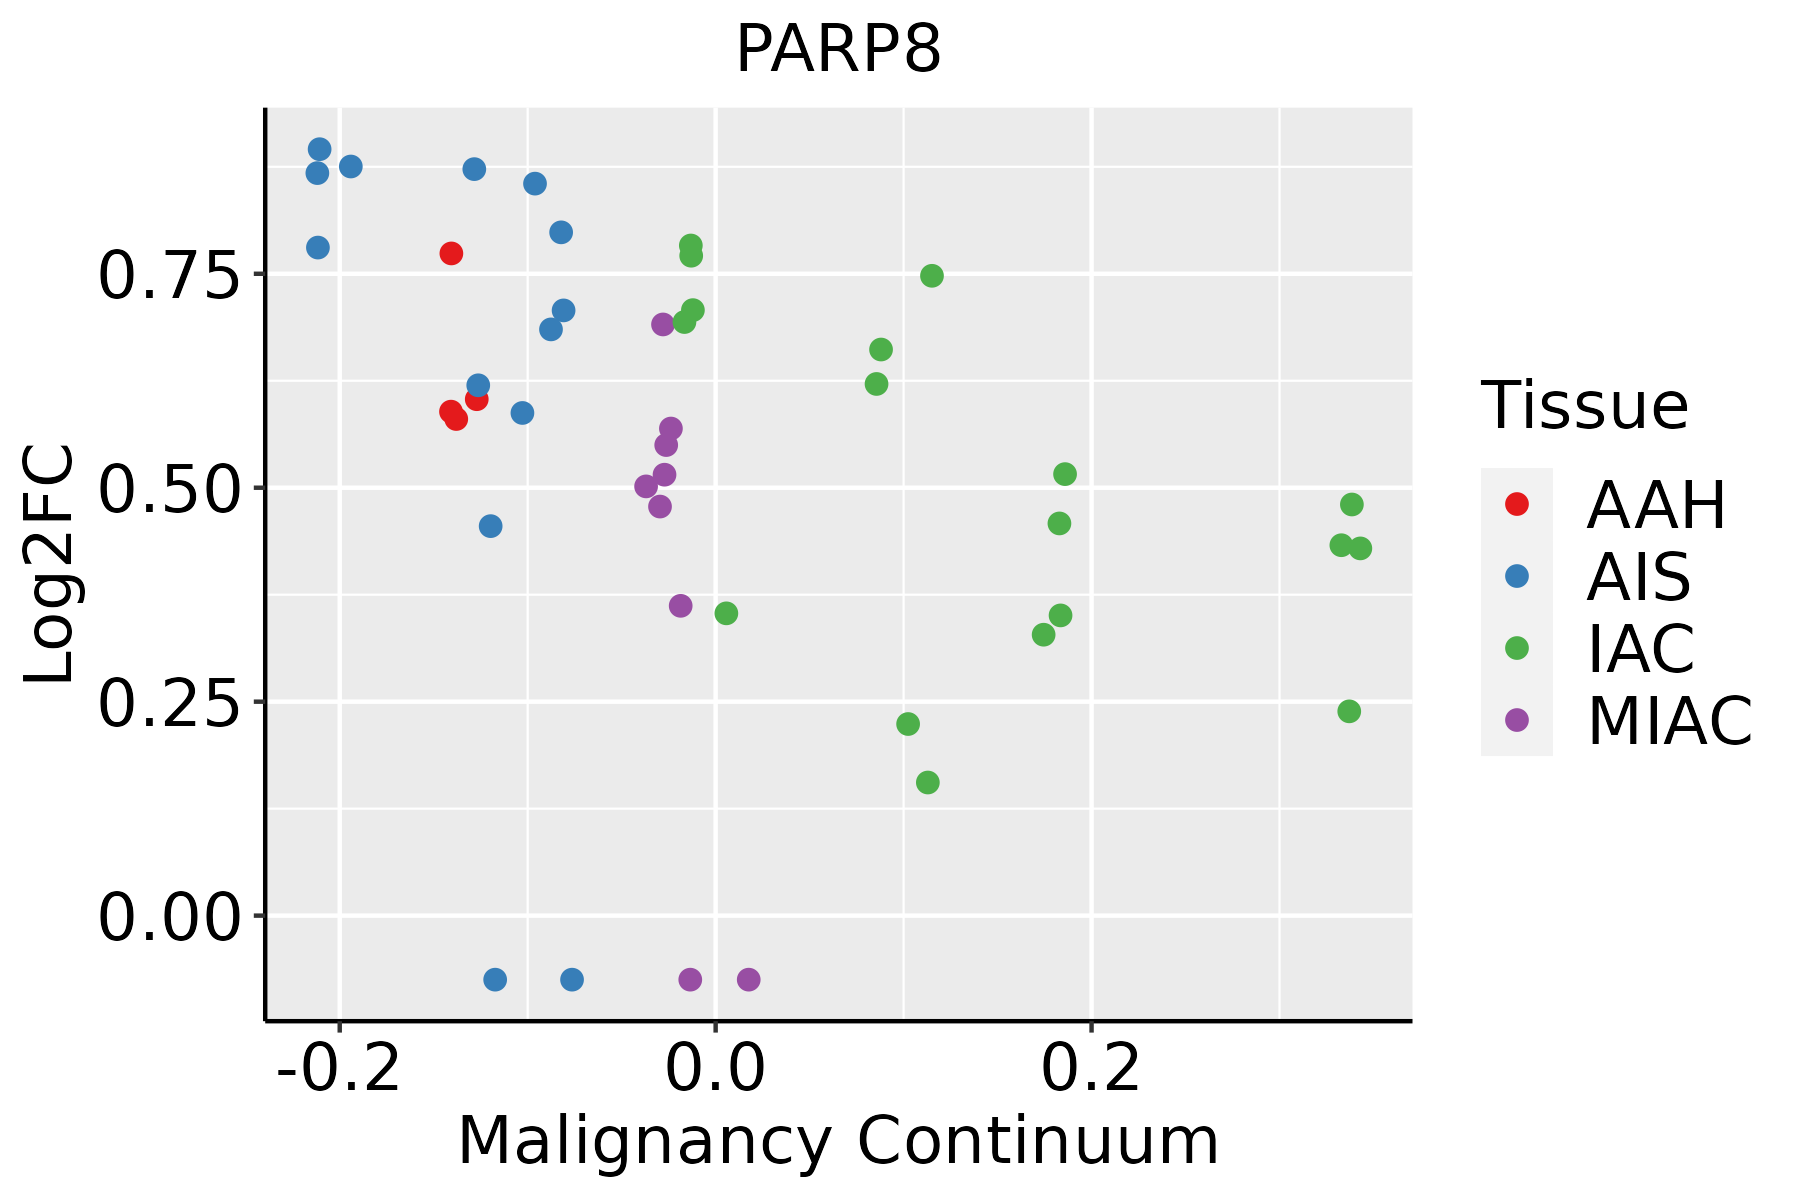 | AAH: Atypical adenomatous hyperplasia |
| AIS: Adenocarcinoma in situ | ||
| IAC: Invasive lung adenocarcinoma | ||
| MIA: Minimally invasive adenocarcinoma | ||
| Thyroid | 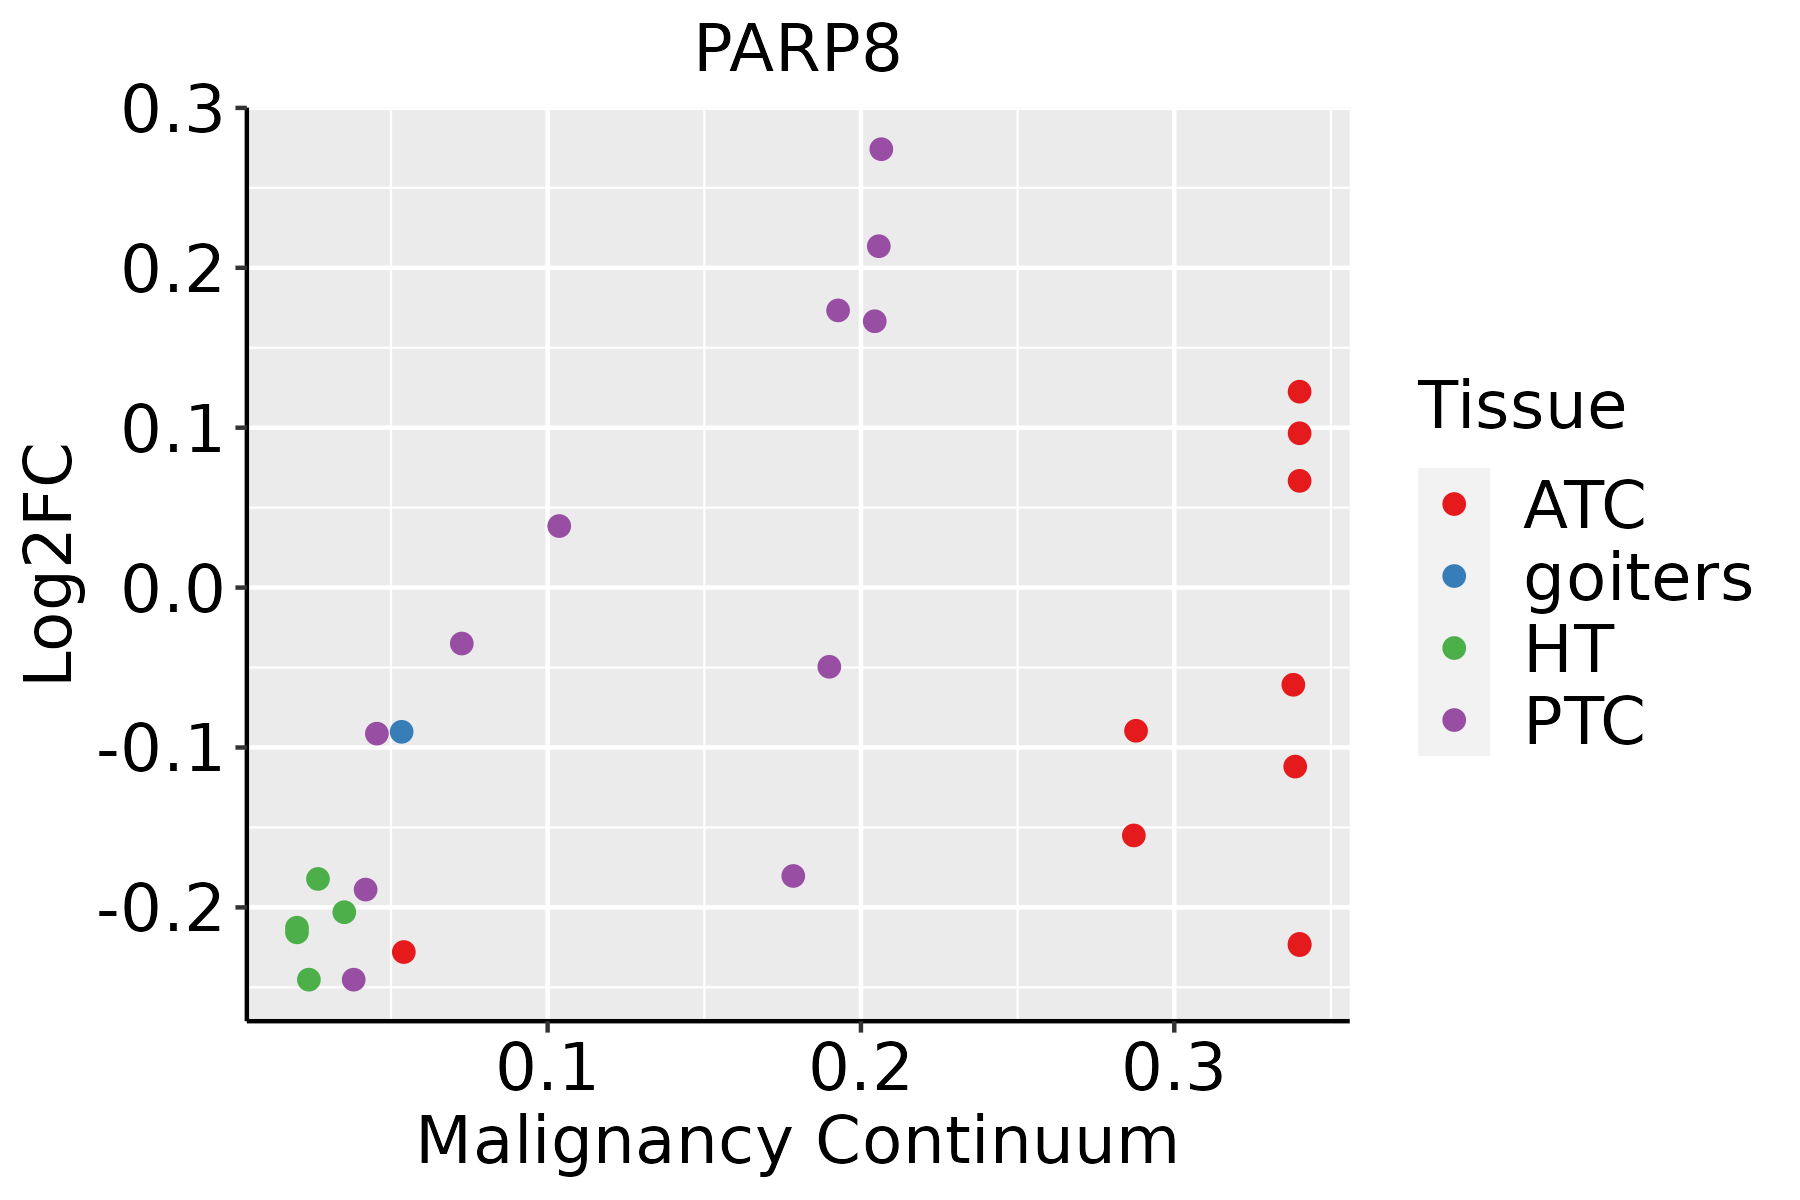 | ATC: Anaplastic thyroid cancer |
| HT: Hashimoto's thyroiditis | ||
| PTC: Papillary thyroid cancer |
| ∗log2FC in expression of this searched gene in stem-like cells from each diseased tissue sample relative to stem-like cells in normal samples in each tissue plotted against the malignancy continuum. Samples are colored based on if they are from different disease stage. |
Top |
Malignant transformation related pathway analysis |
| Find out the enriched GO biological processes and KEGG pathways involved in transition from healthy to precancer to cancer |
| Tissue | Disease Stage | Enriched GO biological Processes |
| Colorectum | AD |  |
| Colorectum | SER |  |
| Colorectum | MSS |  |
| Colorectum | MSI-H |  |
| Colorectum | FAP |  |
| ∗Top 15 enriched GO BP terms are showed in the bar plot of each disease state in each tissue. Each row represents a significant GO biological process which is colored according to the -log10(p.adjust). |
| Page: 1 2 3 4 5 6 7 8 9 |
| GO ID | Tissue | Disease Stage | Description | Gene Ratio | Bg Ratio | pvalue | p.adjust | Count |
| GO:00702131 | Esophagus | ESCC | protein auto-ADP-ribosylation | 11/8552 | 12/18723 | 1.26e-03 | 6.06e-03 | 11 |
| GO:0006471 | Esophagus | ESCC | protein ADP-ribosylation | 24/8552 | 35/18723 | 5.25e-03 | 1.97e-02 | 24 |
| GO:00064712 | Thyroid | PTC | protein ADP-ribosylation | 18/5968 | 35/18723 | 1.26e-02 | 4.90e-02 | 18 |
| GO:00064711 | Thyroid | ATC | protein ADP-ribosylation | 19/6293 | 35/18723 | 9.36e-03 | 3.44e-02 | 19 |
| Page: 1 |
| Pathway ID | Tissue | Disease Stage | Description | Gene Ratio | Bg Ratio | pvalue | p.adjust | qvalue | Count |
| Page: 1 |
Top |
Cell-cell communication analysis |
| Identification of potential cell-cell interactions between two cell types and their ligand-receptor pairs for different disease states |
| Ligand | Receptor | LRpair | Pathway | Tissue | Disease Stage |
| Page: 1 |
Top |
Single-cell gene regulatory network inference analysis |
| Find out the significant the regulons (TFs) and the target genes of each regulon across cell types for different disease states |
| TF | Cell Type | Tissue | Disease Stage | Target Gene | RSS | Regulon Activity |
| ∗The dot plots of a searched regulon are shown for all cell subpopulations in each disease state of each tissue based on the regulon specific score inferred using pySCENIC and by calculating the average expression. |
| Page: 1 |
Top |
Somatic mutation of malignant transformation related genes |
| Annotation of somatic variants for genes involved in malignant transformation |
| Hugo Symbol | Variant Class | Variant Classification | dbSNP RS | HGVSc | HGVSp | HGVSp Short | SWISSPROT | BIOTYPE | SIFT | PolyPhen | Tumor Sample Barcode | Tissue | Histology | Sex | Age | Stage | Therapy Types | Drugs | Outcome |
| PARP8 | SNV | Missense_Mutation | rs372763367 | c.1735G>A | p.Glu579Lys | p.E579K | Q8N3A8 | protein_coding | deleterious(0.04) | possibly_damaging(0.541) | TCGA-AC-A2FM-01 | Breast | breast invasive carcinoma | Female | >=65 | I/II | Unknown | Unknown | PD |
| PARP8 | SNV | Missense_Mutation | novel | c.2357N>T | p.Lys786Ile | p.K786I | Q8N3A8 | protein_coding | tolerated(0.14) | probably_damaging(0.959) | TCGA-AC-A3QQ-01 | Breast | breast invasive carcinoma | Female | <65 | I/II | Unknown | Unknown | SD |
| PARP8 | SNV | Missense_Mutation | novel | c.332N>C | p.Lys111Thr | p.K111T | Q8N3A8 | protein_coding | tolerated_low_confidence(0.49) | benign(0) | TCGA-AN-A046-01 | Breast | breast invasive carcinoma | Female | >=65 | I/II | Unknown | Unknown | SD |
| PARP8 | SNV | Missense_Mutation | rs376492269 | c.611N>A | p.Arg204Gln | p.R204Q | Q8N3A8 | protein_coding | deleterious(0.03) | probably_damaging(0.921) | TCGA-AN-A046-01 | Breast | breast invasive carcinoma | Female | >=65 | I/II | Unknown | Unknown | SD |
| PARP8 | SNV | Missense_Mutation | novel | c.2355A>T | p.Leu785Phe | p.L785F | Q8N3A8 | protein_coding | deleterious(0) | probably_damaging(0.995) | TCGA-AN-A0FX-01 | Breast | breast invasive carcinoma | Female | <65 | I/II | Unknown | Unknown | SD |
| PARP8 | SNV | Missense_Mutation | c.851N>G | p.Ser284Cys | p.S284C | Q8N3A8 | protein_coding | deleterious_low_confidence(0.04) | probably_damaging(0.987) | TCGA-AR-A250-01 | Breast | breast invasive carcinoma | Female | <65 | I/II | Chemotherapy | doxorubicin | SD | |
| PARP8 | SNV | Missense_Mutation | c.2241N>G | p.Asn747Lys | p.N747K | Q8N3A8 | protein_coding | tolerated(0.06) | probably_damaging(0.992) | TCGA-BH-A18V-01 | Breast | breast invasive carcinoma | Female | <65 | I/II | Unknown | Unknown | SD | |
| PARP8 | SNV | Missense_Mutation | c.788C>G | p.Ser263Cys | p.S263C | Q8N3A8 | protein_coding | tolerated(0.06) | possibly_damaging(0.635) | TCGA-D8-A1J9-01 | Breast | breast invasive carcinoma | Female | <65 | I/II | Unknown | Unknown | SD | |
| PARP8 | SNV | Missense_Mutation | c.1022N>T | p.Gly341Val | p.G341V | Q8N3A8 | protein_coding | deleterious_low_confidence(0.02) | probably_damaging(0.997) | TCGA-HN-A2OB-01 | Breast | breast invasive carcinoma | Female | <65 | I/II | Chemotherapy | fluorouracil | PD | |
| PARP8 | SNV | Missense_Mutation | novel | c.1118N>T | p.Ser373Leu | p.S373L | Q8N3A8 | protein_coding | tolerated_low_confidence(0.33) | benign(0.01) | TCGA-JL-A3YW-01 | Breast | breast invasive carcinoma | Female | <65 | I/II | Unknown | Unknown | SD |
| Page: 1 2 3 4 5 6 7 8 9 10 |
Top |
Related drugs of malignant transformation related genes |
| Identification of chemicals and drugs interact with genes involved in malignant transfromation |
| (DGIdb 4.0) |
| Entrez ID | Symbol | Category | Interaction Types | Drug Claim Name | Drug Name | PMIDs |
| Page: 1 |

Copyright 2023-Present -The University of Texas Health Science Center at Houston |