
|
|||||
|
 | |
| |
| |
| |
| |
| |
|
Gene: PARP6 |
Gene summary for PARP6 |
| Gene information | Species | Human | Gene symbol | PARP6 | Gene ID | 56965 |
| Gene name | poly(ADP-ribose) polymerase family member 6 | |
| Gene Alias | ARTD17 | |
| Cytomap | 15q23 | |
| Gene Type | protein-coding | GO ID | GO:0000902 | UniProtAcc | A0A024R5Z4 |
Top |
Malignant transformation analysis |
| Identification of the aberrant gene expression in precancerous and cancerous lesions by comparing the gene expression of stem-like cells in diseased tissues with normal stem cells |
| Entrez ID | Symbol | Replicates | Species | Organ | Tissue | Adj P-value | Log2FC | Malignancy |
| 56965 | PARP6 | LZE4T | Human | Esophagus | ESCC | 1.03e-02 | 1.18e-01 | 0.0811 |
| 56965 | PARP6 | LZE7T | Human | Esophagus | ESCC | 7.39e-05 | 1.86e-01 | 0.0667 |
| 56965 | PARP6 | LZE20T | Human | Esophagus | ESCC | 1.27e-02 | 3.86e-02 | 0.0662 |
| 56965 | PARP6 | LZE22T | Human | Esophagus | ESCC | 7.08e-03 | 3.26e-01 | 0.068 |
| 56965 | PARP6 | LZE24T | Human | Esophagus | ESCC | 5.37e-13 | 3.75e-01 | 0.0596 |
| 56965 | PARP6 | P1T-E | Human | Esophagus | ESCC | 4.05e-09 | 5.55e-01 | 0.0875 |
| 56965 | PARP6 | P2T-E | Human | Esophagus | ESCC | 1.81e-10 | 2.78e-01 | 0.1177 |
| 56965 | PARP6 | P4T-E | Human | Esophagus | ESCC | 2.43e-08 | 2.37e-01 | 0.1323 |
| 56965 | PARP6 | P5T-E | Human | Esophagus | ESCC | 1.66e-07 | 2.84e-02 | 0.1327 |
| 56965 | PARP6 | P8T-E | Human | Esophagus | ESCC | 2.60e-18 | 3.17e-01 | 0.0889 |
| 56965 | PARP6 | P9T-E | Human | Esophagus | ESCC | 4.11e-13 | 1.45e-01 | 0.1131 |
| 56965 | PARP6 | P10T-E | Human | Esophagus | ESCC | 1.25e-23 | 2.69e-01 | 0.116 |
| 56965 | PARP6 | P11T-E | Human | Esophagus | ESCC | 1.12e-07 | 4.00e-01 | 0.1426 |
| 56965 | PARP6 | P12T-E | Human | Esophagus | ESCC | 3.13e-26 | 4.96e-01 | 0.1122 |
| 56965 | PARP6 | P15T-E | Human | Esophagus | ESCC | 2.32e-11 | 2.26e-01 | 0.1149 |
| 56965 | PARP6 | P16T-E | Human | Esophagus | ESCC | 2.34e-19 | 4.25e-01 | 0.1153 |
| 56965 | PARP6 | P17T-E | Human | Esophagus | ESCC | 8.81e-03 | 1.70e-01 | 0.1278 |
| 56965 | PARP6 | P19T-E | Human | Esophagus | ESCC | 4.45e-02 | 4.31e-01 | 0.1662 |
| 56965 | PARP6 | P20T-E | Human | Esophagus | ESCC | 4.47e-19 | 3.99e-01 | 0.1124 |
| 56965 | PARP6 | P21T-E | Human | Esophagus | ESCC | 2.39e-21 | 3.00e-01 | 0.1617 |
| Page: 1 2 3 4 |
| Tissue | Expression Dynamics | Abbreviation |
| Esophagus |  | ESCC: Esophageal squamous cell carcinoma |
| HGIN: High-grade intraepithelial neoplasias | ||
| LGIN: Low-grade intraepithelial neoplasias | ||
| Liver | 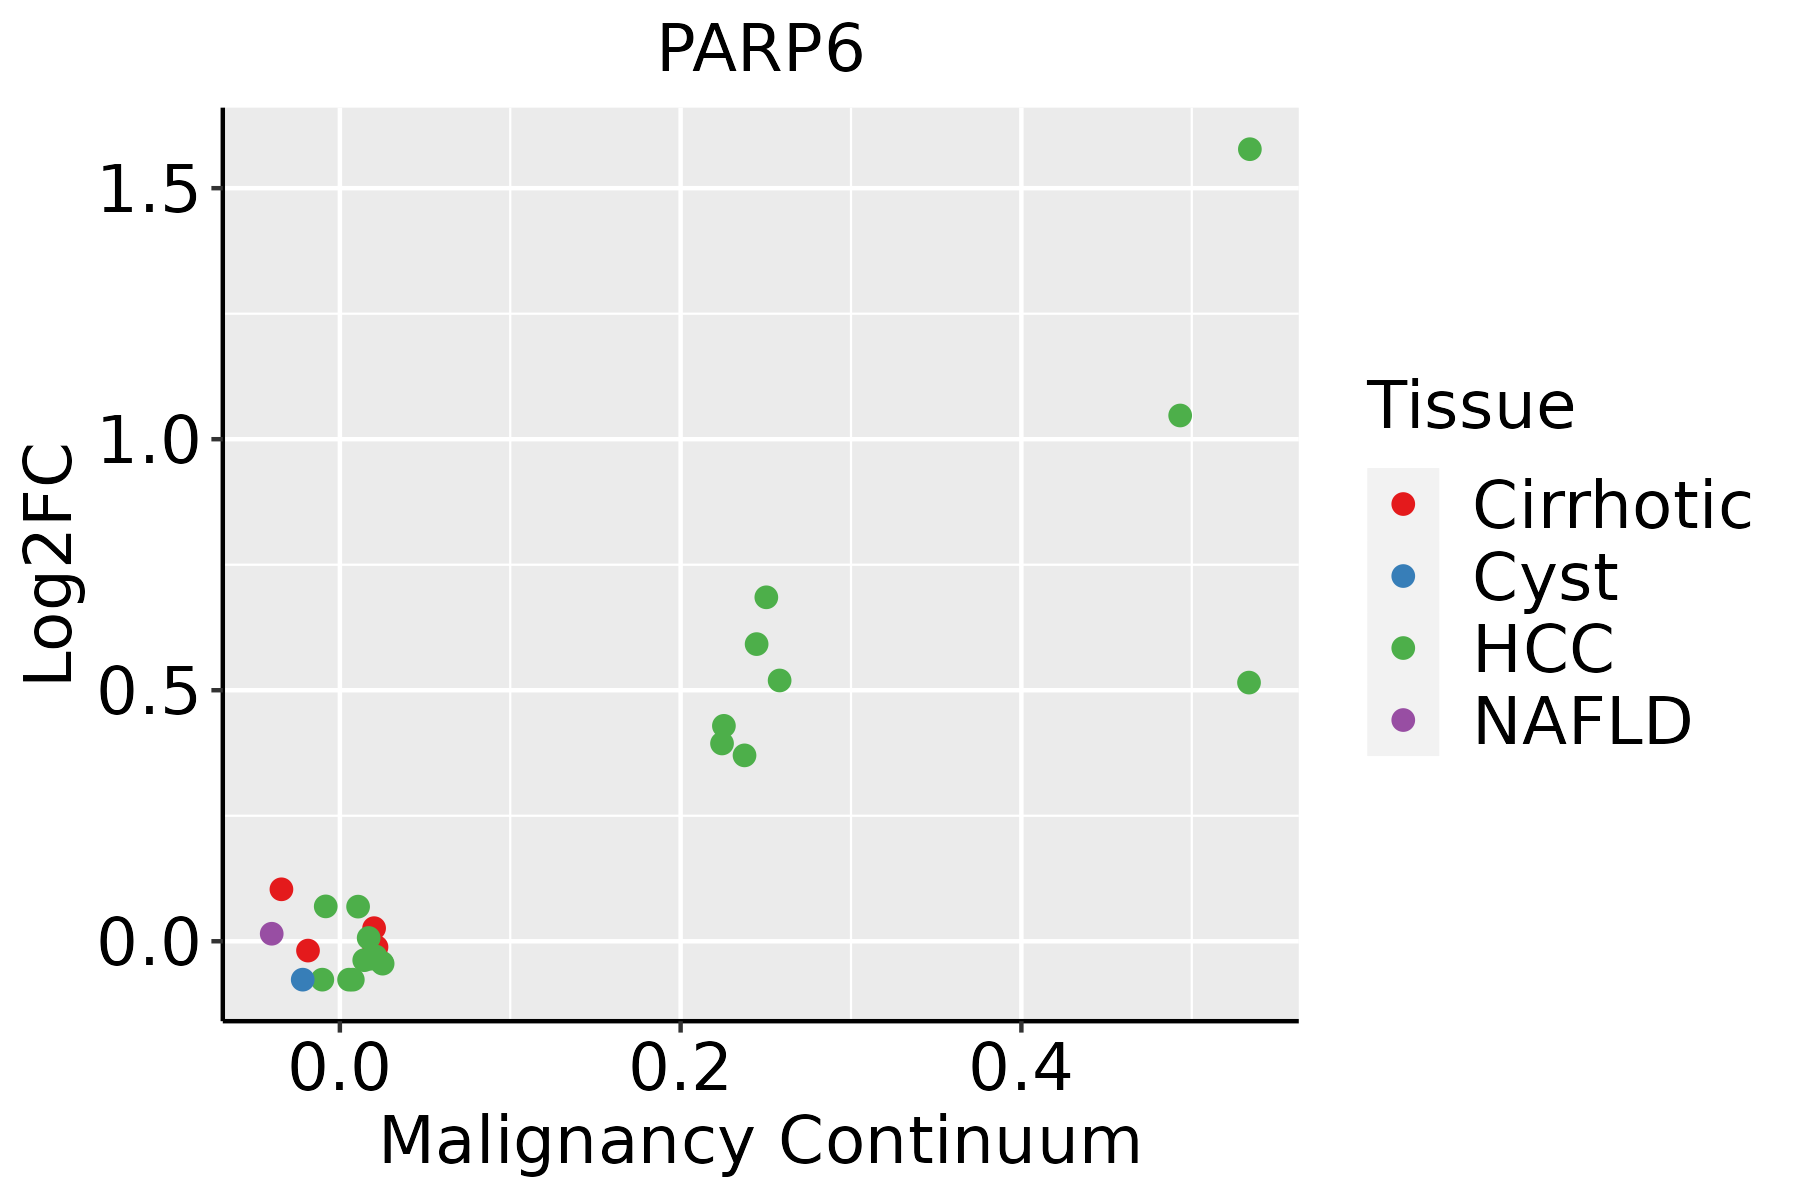 | HCC: Hepatocellular carcinoma |
| NAFLD: Non-alcoholic fatty liver disease |
| ∗log2FC in expression of this searched gene in stem-like cells from each diseased tissue sample relative to stem-like cells in normal samples in each tissue plotted against the malignancy continuum. Samples are colored based on if they are from different disease stage. |
Top |
Malignant transformation related pathway analysis |
| Find out the enriched GO biological processes and KEGG pathways involved in transition from healthy to precancer to cancer |
| Tissue | Disease Stage | Enriched GO biological Processes |
| Colorectum | AD |  |
| Colorectum | SER |  |
| Colorectum | MSS |  |
| Colorectum | MSI-H |  |
| Colorectum | FAP |  |
| ∗Top 15 enriched GO BP terms are showed in the bar plot of each disease state in each tissue. Each row represents a significant GO biological process which is colored according to the -log10(p.adjust). |
| Page: 1 2 3 4 5 6 7 8 9 |
| GO ID | Tissue | Disease Stage | Description | Gene Ratio | Bg Ratio | pvalue | p.adjust | Count |
| GO:002260420 | Esophagus | ESCC | regulation of cell morphogenesis | 180/8552 | 309/18723 | 5.19e-06 | 5.45e-05 | 180 |
| GO:003134616 | Esophagus | ESCC | positive regulation of cell projection organization | 201/8552 | 353/18723 | 1.19e-05 | 1.11e-04 | 201 |
| GO:001072010 | Esophagus | ESCC | positive regulation of cell development | 172/8552 | 298/18723 | 1.74e-05 | 1.55e-04 | 172 |
| GO:005076710 | Esophagus | ESCC | regulation of neurogenesis | 203/8552 | 364/18723 | 6.10e-05 | 4.68e-04 | 203 |
| GO:00507697 | Esophagus | ESCC | positive regulation of neurogenesis | 131/8552 | 225/18723 | 9.71e-05 | 6.90e-04 | 131 |
| GO:001097516 | Esophagus | ESCC | regulation of neuron projection development | 240/8552 | 445/18723 | 2.48e-04 | 1.53e-03 | 240 |
| GO:001076920 | Esophagus | ESCC | regulation of cell morphogenesis involved in differentiation | 61/8552 | 96/18723 | 3.12e-04 | 1.85e-03 | 61 |
| GO:00519606 | Esophagus | ESCC | regulation of nervous system development | 237/8552 | 443/18723 | 5.02e-04 | 2.78e-03 | 237 |
| GO:001077018 | Esophagus | ESCC | positive regulation of cell morphogenesis involved in differentiation | 51/8552 | 79/18723 | 5.48e-04 | 3.00e-03 | 51 |
| GO:00702131 | Esophagus | ESCC | protein auto-ADP-ribosylation | 11/8552 | 12/18723 | 1.26e-03 | 6.06e-03 | 11 |
| GO:00519625 | Esophagus | ESCC | positive regulation of nervous system development | 149/8552 | 272/18723 | 1.50e-03 | 7.06e-03 | 149 |
| GO:0006471 | Esophagus | ESCC | protein ADP-ribosylation | 24/8552 | 35/18723 | 5.25e-03 | 1.97e-02 | 24 |
| GO:001635816 | Esophagus | ESCC | dendrite development | 130/8552 | 243/18723 | 8.33e-03 | 2.95e-02 | 130 |
| GO:002260422 | Liver | HCC | regulation of cell morphogenesis | 188/7958 | 309/18723 | 4.84e-11 | 1.82e-09 | 188 |
| GO:001076922 | Liver | HCC | regulation of cell morphogenesis involved in differentiation | 65/7958 | 96/18723 | 5.17e-07 | 8.37e-06 | 65 |
| GO:003134611 | Liver | HCC | positive regulation of cell projection organization | 193/7958 | 353/18723 | 2.28e-06 | 3.08e-05 | 193 |
| GO:001077022 | Liver | HCC | positive regulation of cell morphogenesis involved in differentiation | 53/7958 | 79/18723 | 8.69e-06 | 1.02e-04 | 53 |
| GO:001072011 | Liver | HCC | positive regulation of cell development | 155/7958 | 298/18723 | 5.39e-04 | 3.48e-03 | 155 |
| GO:001097511 | Liver | HCC | regulation of neuron projection development | 220/7958 | 445/18723 | 1.68e-03 | 8.78e-03 | 220 |
| GO:00507674 | Liver | HCC | regulation of neurogenesis | 181/7958 | 364/18723 | 3.00e-03 | 1.40e-02 | 181 |
| Page: 1 2 |
| Pathway ID | Tissue | Disease Stage | Description | Gene Ratio | Bg Ratio | pvalue | p.adjust | qvalue | Count |
| Page: 1 |
Top |
Cell-cell communication analysis |
| Identification of potential cell-cell interactions between two cell types and their ligand-receptor pairs for different disease states |
| Ligand | Receptor | LRpair | Pathway | Tissue | Disease Stage |
| Page: 1 |
Top |
Single-cell gene regulatory network inference analysis |
| Find out the significant the regulons (TFs) and the target genes of each regulon across cell types for different disease states |
| TF | Cell Type | Tissue | Disease Stage | Target Gene | RSS | Regulon Activity |
| ∗The dot plots of a searched regulon are shown for all cell subpopulations in each disease state of each tissue based on the regulon specific score inferred using pySCENIC and by calculating the average expression. |
| Page: 1 |
Top |
Somatic mutation of malignant transformation related genes |
| Annotation of somatic variants for genes involved in malignant transformation |
| Hugo Symbol | Variant Class | Variant Classification | dbSNP RS | HGVSc | HGVSp | HGVSp Short | SWISSPROT | BIOTYPE | SIFT | PolyPhen | Tumor Sample Barcode | Tissue | Histology | Sex | Age | Stage | Therapy Types | Drugs | Outcome |
| PARP6 | SNV | Missense_Mutation | novel | c.736C>A | p.Pro246Thr | p.P246T | Q2NL67 | protein_coding | tolerated(0.15) | possibly_damaging(0.641) | TCGA-A7-A0DB-01 | Breast | breast invasive carcinoma | Female | <65 | I/II | Hormone Therapy | arimidex | SD |
| PARP6 | SNV | Missense_Mutation | c.31N>A | p.Asp11Asn | p.D11N | Q2NL67 | protein_coding | tolerated_low_confidence(0.38) | benign(0.075) | TCGA-A8-A07O-01 | Breast | breast invasive carcinoma | Female | <65 | I/II | Chemotherapy | CR | ||
| PARP6 | SNV | Missense_Mutation | novel | c.447C>A | p.Phe149Leu | p.F149L | Q2NL67 | protein_coding | tolerated(0.64) | benign(0.006) | TCGA-AN-A046-01 | Breast | breast invasive carcinoma | Female | >=65 | I/II | Unknown | Unknown | SD |
| PARP6 | SNV | Missense_Mutation | c.1218N>C | p.Gln406His | p.Q406H | Q2NL67 | protein_coding | deleterious(0.01) | probably_damaging(0.965) | TCGA-AN-A0XW-01 | Breast | breast invasive carcinoma | Female | <65 | III/IV | Unknown | Unknown | SD | |
| PARP6 | SNV | Missense_Mutation | c.1142G>C | p.Arg381Pro | p.R381P | Q2NL67 | protein_coding | deleterious(0.01) | probably_damaging(0.986) | TCGA-E9-A243-01 | Breast | breast invasive carcinoma | Female | <65 | I/II | Chemotherapy | 5-fluorouracil | PD | |
| PARP6 | insertion | Nonsense_Mutation | novel | c.200_201insAAAGGCAGTGACTTTGGGCAAGTGGGTGGTCTGA | p.Asp68LysfsTer11 | p.D68Kfs*11 | Q2NL67 | protein_coding | TCGA-AR-A0TY-01 | Breast | breast invasive carcinoma | Female | <65 | I/II | Unspecific | Paclitaxel | PD | ||
| PARP6 | insertion | Nonsense_Mutation | novel | c.759_760insTCCTGATATAGAGGGCCTCAAATTCCTACCCTGTTTTAG | p.Ser254_Gly255insTer | p.S254_G255ins* | Q2NL67 | protein_coding | TCGA-BH-A0B8-01 | Breast | breast invasive carcinoma | Female | <65 | I/II | Hormone Therapy | arimidex | SD | ||
| PARP6 | SNV | Missense_Mutation | novel | c.1075N>T | p.Pro359Ser | p.P359S | Q2NL67 | protein_coding | deleterious(0) | probably_damaging(0.986) | TCGA-C5-A1MH-01 | Cervix | cervical & endocervical cancer | Female | >=65 | III/IV | Chemotherapy | cisplatin | PD |
| PARP6 | SNV | Missense_Mutation | novel | c.1828N>G | p.Thr610Ala | p.T610A | Q2NL67 | protein_coding | deleterious(0.04) | possibly_damaging(0.899) | TCGA-AA-3966-01 | Colorectum | colon adenocarcinoma | Female | >=65 | I/II | Unknown | Unknown | SD |
| PARP6 | SNV | Missense_Mutation | rs759456839 | c.1861C>T | p.Arg621Cys | p.R621C | Q2NL67 | protein_coding | deleterious(0) | probably_damaging(0.973) | TCGA-AA-3977-01 | Colorectum | colon adenocarcinoma | Male | >=65 | I/II | Unknown | Unknown | SD |
| Page: 1 2 3 4 5 6 7 |
Top |
Related drugs of malignant transformation related genes |
| Identification of chemicals and drugs interact with genes involved in malignant transfromation |
| (DGIdb 4.0) |
| Entrez ID | Symbol | Category | Interaction Types | Drug Claim Name | Drug Name | PMIDs |
| Page: 1 |

Copyright 2023-Present -The University of Texas Health Science Center at Houston |