
|
|||||
|
 | |
| |
| |
| |
| |
| |
|
Gene: PARP4 |
Gene summary for PARP4 |
| Gene information | Species | Human | Gene symbol | PARP4 | Gene ID | 143 |
| Gene name | poly(ADP-ribose) polymerase family member 4 | |
| Gene Alias | ADPRTL1 | |
| Cytomap | 13q12.12 | |
| Gene Type | protein-coding | GO ID | GO:0006139 | UniProtAcc | Q9UKK3 |
Top |
Malignant transformation analysis |
| Identification of the aberrant gene expression in precancerous and cancerous lesions by comparing the gene expression of stem-like cells in diseased tissues with normal stem cells |
| Entrez ID | Symbol | Replicates | Species | Organ | Tissue | Adj P-value | Log2FC | Malignancy |
| 143 | PARP4 | HTA11_1938_2000001011 | Human | Colorectum | AD | 2.34e-06 | 5.70e-01 | -0.0811 |
| 143 | PARP4 | HTA11_78_2000001011 | Human | Colorectum | AD | 7.89e-05 | 4.33e-01 | -0.1088 |
| 143 | PARP4 | HTA11_347_2000001011 | Human | Colorectum | AD | 8.03e-24 | 8.02e-01 | -0.1954 |
| 143 | PARP4 | HTA11_411_2000001011 | Human | Colorectum | SER | 1.47e-04 | 8.48e-01 | -0.2602 |
| 143 | PARP4 | HTA11_1391_2000001011 | Human | Colorectum | AD | 1.18e-05 | 5.88e-01 | -0.059 |
| 143 | PARP4 | HTA11_99999965104_69814 | Human | Colorectum | MSS | 3.11e-18 | 9.93e-01 | 0.281 |
| 143 | PARP4 | HTA11_99999971662_82457 | Human | Colorectum | MSS | 1.87e-05 | 7.37e-01 | 0.3859 |
| 143 | PARP4 | A015-C-203 | Human | Colorectum | FAP | 4.75e-28 | -4.31e-01 | -0.1294 |
| 143 | PARP4 | A015-C-204 | Human | Colorectum | FAP | 5.87e-10 | -5.24e-01 | -0.0228 |
| 143 | PARP4 | A014-C-040 | Human | Colorectum | FAP | 2.35e-03 | -2.40e-01 | -0.1184 |
| 143 | PARP4 | A002-C-201 | Human | Colorectum | FAP | 2.34e-13 | -4.35e-01 | 0.0324 |
| 143 | PARP4 | A002-C-203 | Human | Colorectum | FAP | 8.04e-03 | -8.38e-02 | 0.2786 |
| 143 | PARP4 | A001-C-119 | Human | Colorectum | FAP | 1.87e-09 | -3.68e-01 | -0.1557 |
| 143 | PARP4 | A001-C-108 | Human | Colorectum | FAP | 2.58e-17 | -2.63e-01 | -0.0272 |
| 143 | PARP4 | A002-C-205 | Human | Colorectum | FAP | 8.64e-22 | -2.78e-01 | -0.1236 |
| 143 | PARP4 | A015-C-006 | Human | Colorectum | FAP | 1.59e-15 | -4.09e-01 | -0.0994 |
| 143 | PARP4 | A015-C-106 | Human | Colorectum | FAP | 4.15e-15 | -3.16e-01 | -0.0511 |
| 143 | PARP4 | A002-C-114 | Human | Colorectum | FAP | 4.56e-19 | -4.42e-01 | -0.1561 |
| 143 | PARP4 | A015-C-104 | Human | Colorectum | FAP | 8.47e-30 | -4.39e-01 | -0.1899 |
| 143 | PARP4 | A001-C-014 | Human | Colorectum | FAP | 3.57e-13 | -3.53e-01 | 0.0135 |
| Page: 1 2 3 |
| Tissue | Expression Dynamics | Abbreviation |
| Colorectum (GSE201348) |  | FAP: Familial adenomatous polyposis |
| CRC: Colorectal cancer | ||
| Colorectum (HTA11) |  | AD: Adenomas |
| SER: Sessile serrated lesions | ||
| MSI-H: Microsatellite-high colorectal cancer | ||
| MSS: Microsatellite stable colorectal cancer | ||
| Liver |  | HCC: Hepatocellular carcinoma |
| NAFLD: Non-alcoholic fatty liver disease | ||
| Thyroid | 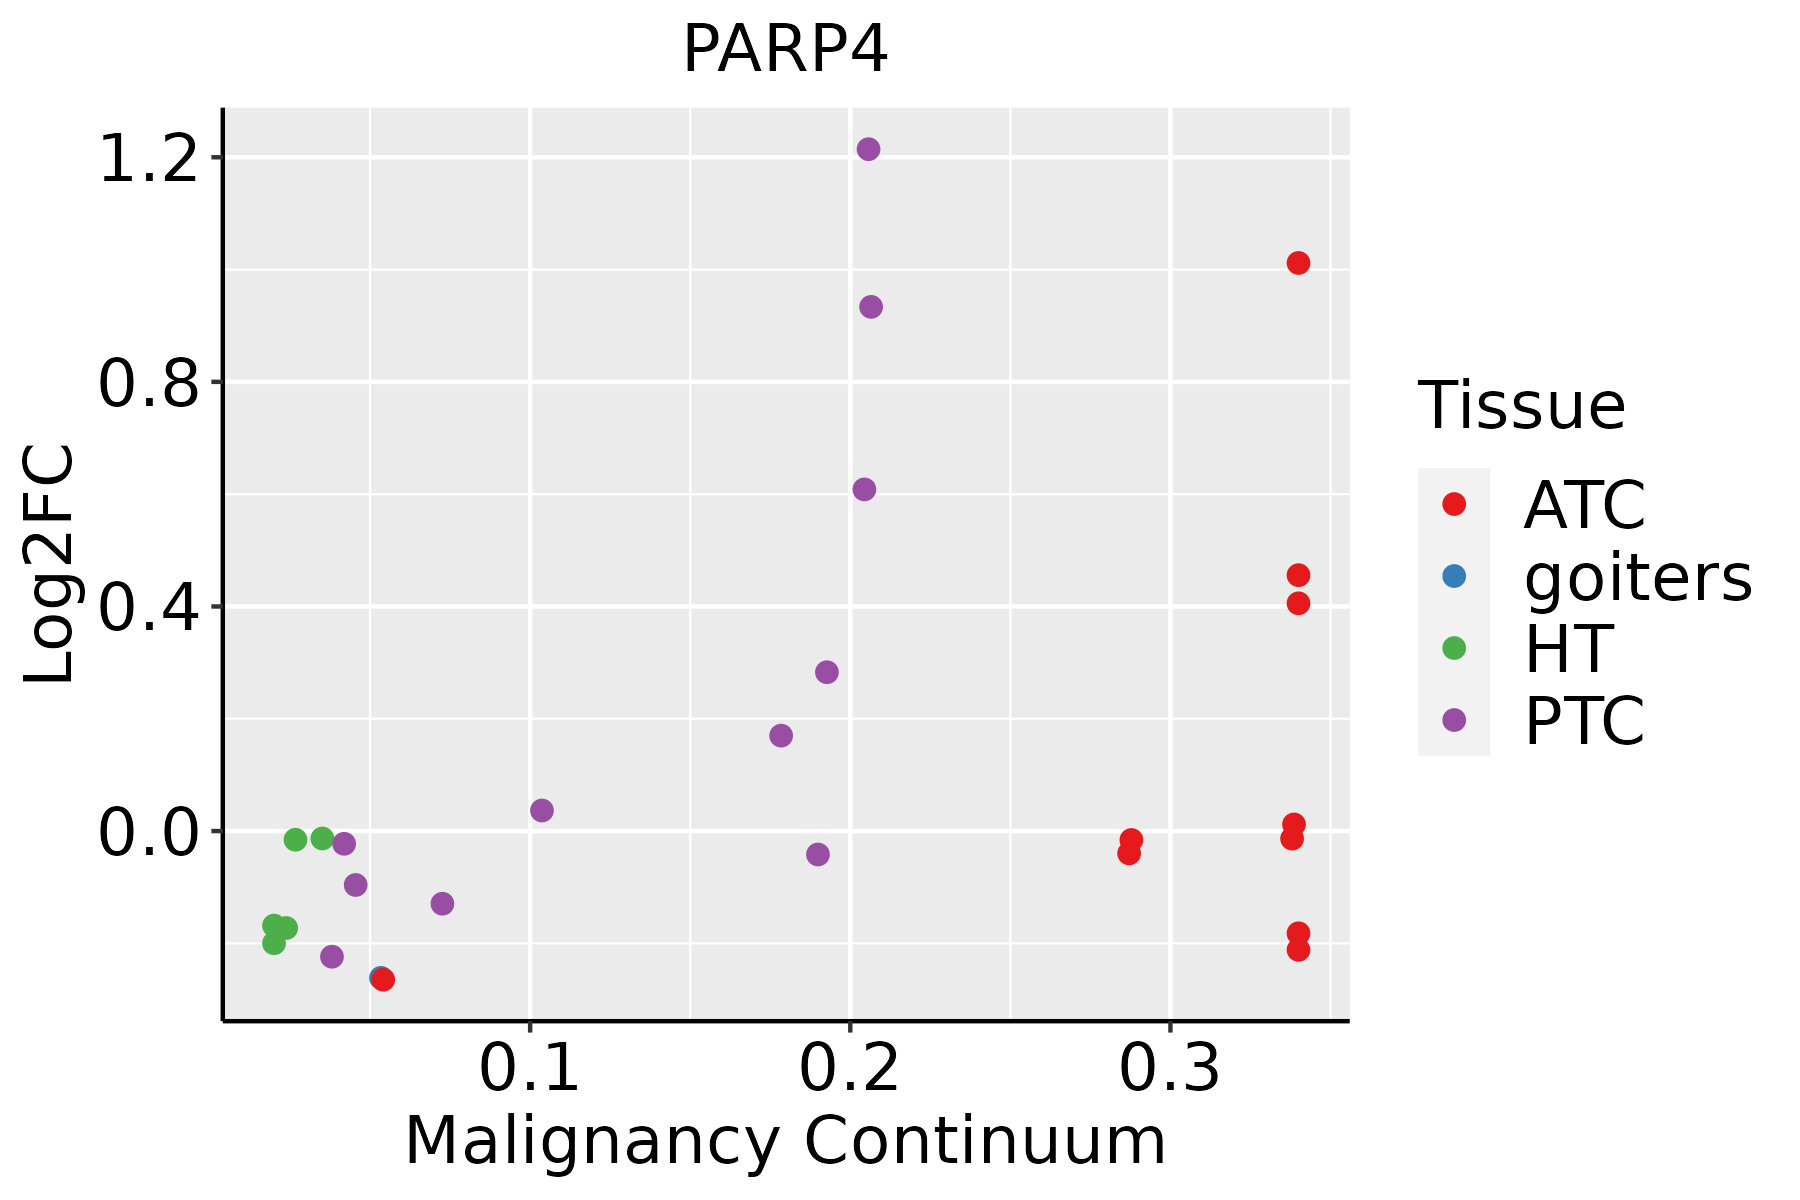 | ATC: Anaplastic thyroid cancer |
| HT: Hashimoto's thyroiditis | ||
| PTC: Papillary thyroid cancer |
| ∗log2FC in expression of this searched gene in stem-like cells from each diseased tissue sample relative to stem-like cells in normal samples in each tissue plotted against the malignancy continuum. Samples are colored based on if they are from different disease stage. |
Top |
Malignant transformation related pathway analysis |
| Find out the enriched GO biological processes and KEGG pathways involved in transition from healthy to precancer to cancer |
| Tissue | Disease Stage | Enriched GO biological Processes |
| Colorectum | AD |  |
| Colorectum | SER |  |
| Colorectum | MSS |  |
| Colorectum | MSI-H |  |
| Colorectum | FAP |  |
| ∗Top 15 enriched GO BP terms are showed in the bar plot of each disease state in each tissue. Each row represents a significant GO biological process which is colored according to the -log10(p.adjust). |
| Page: 1 2 3 4 5 6 7 8 9 |
| GO ID | Tissue | Disease Stage | Description | Gene Ratio | Bg Ratio | pvalue | p.adjust | Count |
| GO:0051052 | Colorectum | AD | regulation of DNA metabolic process | 116/3918 | 359/18723 | 2.47e-07 | 1.00e-05 | 116 |
| GO:2000278 | Colorectum | AD | regulation of DNA biosynthetic process | 41/3918 | 106/18723 | 2.17e-05 | 4.33e-04 | 41 |
| GO:0051972 | Colorectum | AD | regulation of telomerase activity | 22/3918 | 47/18723 | 6.45e-05 | 1.07e-03 | 22 |
| GO:0009410 | Colorectum | AD | response to xenobiotic stimulus | 128/3918 | 462/18723 | 2.69e-04 | 3.31e-03 | 128 |
| GO:0071897 | Colorectum | AD | DNA biosynthetic process | 55/3918 | 180/18723 | 1.46e-03 | 1.24e-02 | 55 |
| GO:20002781 | Colorectum | SER | regulation of DNA biosynthetic process | 33/2897 | 106/18723 | 3.83e-05 | 9.82e-04 | 33 |
| GO:00510521 | Colorectum | SER | regulation of DNA metabolic process | 83/2897 | 359/18723 | 8.03e-05 | 1.77e-03 | 83 |
| GO:00718971 | Colorectum | SER | DNA biosynthetic process | 43/2897 | 180/18723 | 1.99e-03 | 1.98e-02 | 43 |
| GO:00519721 | Colorectum | SER | regulation of telomerase activity | 15/2897 | 47/18723 | 3.68e-03 | 3.07e-02 | 15 |
| GO:00510522 | Colorectum | MSS | regulation of DNA metabolic process | 108/3467 | 359/18723 | 5.86e-08 | 3.10e-06 | 108 |
| GO:00519722 | Colorectum | MSS | regulation of telomerase activity | 21/3467 | 47/18723 | 3.36e-05 | 6.56e-04 | 21 |
| GO:20002782 | Colorectum | MSS | regulation of DNA biosynthetic process | 37/3467 | 106/18723 | 4.48e-05 | 8.28e-04 | 37 |
| GO:00718972 | Colorectum | MSS | DNA biosynthetic process | 50/3467 | 180/18723 | 1.45e-03 | 1.35e-02 | 50 |
| GO:00094101 | Colorectum | MSS | response to xenobiotic stimulus | 110/3467 | 462/18723 | 2.36e-03 | 1.92e-02 | 110 |
| GO:00510524 | Colorectum | FAP | regulation of DNA metabolic process | 84/2622 | 359/18723 | 9.80e-07 | 4.38e-05 | 84 |
| GO:00519724 | Colorectum | FAP | regulation of telomerase activity | 20/2622 | 47/18723 | 1.69e-06 | 7.06e-05 | 20 |
| GO:20002784 | Colorectum | FAP | regulation of DNA biosynthetic process | 33/2622 | 106/18723 | 4.62e-06 | 1.54e-04 | 33 |
| GO:00094102 | Colorectum | FAP | response to xenobiotic stimulus | 87/2622 | 462/18723 | 2.15e-03 | 1.77e-02 | 87 |
| GO:00510525 | Colorectum | CRC | regulation of DNA metabolic process | 70/2078 | 359/18723 | 1.75e-06 | 8.92e-05 | 70 |
| GO:20002785 | Colorectum | CRC | regulation of DNA biosynthetic process | 27/2078 | 106/18723 | 2.59e-05 | 7.16e-04 | 27 |
| Page: 1 2 3 |
| Pathway ID | Tissue | Disease Stage | Description | Gene Ratio | Bg Ratio | pvalue | p.adjust | qvalue | Count |
| hsa04210 | Colorectum | MSS | Apoptosis | 44/1875 | 136/8465 | 3.66e-03 | 1.66e-02 | 1.01e-02 | 44 |
| hsa042101 | Colorectum | MSS | Apoptosis | 44/1875 | 136/8465 | 3.66e-03 | 1.66e-02 | 1.01e-02 | 44 |
| hsa042102 | Liver | HCC | Apoptosis | 83/4020 | 136/8465 | 9.51e-04 | 3.58e-03 | 1.99e-03 | 83 |
| hsa042103 | Liver | HCC | Apoptosis | 83/4020 | 136/8465 | 9.51e-04 | 3.58e-03 | 1.99e-03 | 83 |
| Page: 1 |
Top |
Cell-cell communication analysis |
| Identification of potential cell-cell interactions between two cell types and their ligand-receptor pairs for different disease states |
| Ligand | Receptor | LRpair | Pathway | Tissue | Disease Stage |
| Page: 1 |
Top |
Single-cell gene regulatory network inference analysis |
| Find out the significant the regulons (TFs) and the target genes of each regulon across cell types for different disease states |
| TF | Cell Type | Tissue | Disease Stage | Target Gene | RSS | Regulon Activity |
| ∗The dot plots of a searched regulon are shown for all cell subpopulations in each disease state of each tissue based on the regulon specific score inferred using pySCENIC and by calculating the average expression. |
| Page: 1 |
Top |
Somatic mutation of malignant transformation related genes |
| Annotation of somatic variants for genes involved in malignant transformation |
| Hugo Symbol | Variant Class | Variant Classification | dbSNP RS | HGVSc | HGVSp | HGVSp Short | SWISSPROT | BIOTYPE | SIFT | PolyPhen | Tumor Sample Barcode | Tissue | Histology | Sex | Age | Stage | Therapy Types | Drugs | Outcome |
| PARP4 | SNV | Missense_Mutation | novel | c.3223G>A | p.Val1075Met | p.V1075M | Q9UKK3 | protein_coding | deleterious(0) | possibly_damaging(0.799) | TCGA-A2-A0EY-01 | Breast | breast invasive carcinoma | Female | <65 | I/II | Chemotherapy | adriamycin | SD |
| PARP4 | SNV | Missense_Mutation | c.2491N>A | p.Leu831Ile | p.L831I | Q9UKK3 | protein_coding | deleterious(0.01) | probably_damaging(0.928) | TCGA-A2-A25A-01 | Breast | breast invasive carcinoma | Female | <65 | I/II | Unspecific | Cytoxan | SD | |
| PARP4 | SNV | Missense_Mutation | c.1171N>A | p.Glu391Lys | p.E391K | Q9UKK3 | protein_coding | deleterious(0) | probably_damaging(0.998) | TCGA-A8-A06Q-01 | Breast | breast invasive carcinoma | Female | <65 | III/IV | Unknown | Unknown | SD | |
| PARP4 | SNV | Missense_Mutation | novel | c.1595N>C | p.Gly532Ala | p.G532A | Q9UKK3 | protein_coding | deleterious(0) | probably_damaging(0.999) | TCGA-AC-A5XS-01 | Breast | breast invasive carcinoma | Female | >=65 | I/II | Hormone Therapy | femara | SD |
| PARP4 | SNV | Missense_Mutation | rs753015710 | c.2581C>G | p.Gln861Glu | p.Q861E | Q9UKK3 | protein_coding | tolerated(0.06) | benign(0.132) | TCGA-AC-A5XU-01 | Breast | breast invasive carcinoma | Female | >=65 | I/II | Hormone Therapy | letrozole | SD |
| PARP4 | SNV | Missense_Mutation | c.3061N>T | p.Ala1021Ser | p.A1021S | Q9UKK3 | protein_coding | deleterious(0.03) | benign(0.396) | TCGA-B6-A0RG-01 | Breast | breast invasive carcinoma | Female | <65 | I/II | Unknown | Unknown | SD | |
| PARP4 | SNV | Missense_Mutation | c.2158N>T | p.Asn720Tyr | p.N720Y | Q9UKK3 | protein_coding | deleterious(0) | probably_damaging(0.999) | TCGA-B6-A0RG-01 | Breast | breast invasive carcinoma | Female | <65 | I/II | Unknown | Unknown | SD | |
| PARP4 | SNV | Missense_Mutation | c.2355G>C | p.Leu785Phe | p.L785F | Q9UKK3 | protein_coding | deleterious(0) | probably_damaging(0.996) | TCGA-D8-A1J8-01 | Breast | breast invasive carcinoma | Female | >=65 | I/II | Hormone Therapy | nolvadex | SD | |
| PARP4 | SNV | Missense_Mutation | c.1843N>A | p.Asp615Asn | p.D615N | Q9UKK3 | protein_coding | deleterious(0.01) | probably_damaging(0.994) | TCGA-D8-A1JN-01 | Breast | breast invasive carcinoma | Female | >=65 | III/IV | Hormone Therapy | anastrozolum | SD | |
| PARP4 | insertion | In_Frame_Ins | novel | c.4594_4595insATATTTTTA | p.Leu1532delinsHisIlePheIle | p.L1532delinsHIFI | Q9UKK3 | protein_coding | TCGA-A8-A06X-01 | Breast | breast invasive carcinoma | Female | >=65 | I/II | Unknown | Unknown | SD |
| Page: 1 2 3 4 5 6 7 8 9 10 11 12 13 14 15 16 |
Top |
Related drugs of malignant transformation related genes |
| Identification of chemicals and drugs interact with genes involved in malignant transfromation |
| (DGIdb 4.0) |
| Entrez ID | Symbol | Category | Interaction Types | Drug Claim Name | Drug Name | PMIDs |
| Page: 1 |

Copyright 2023-Present -The University of Texas Health Science Center at Houston |