
|
|||||
|
 | |
| |
| |
| |
| |
| |
|
Gene: PARP3 |
Gene summary for PARP3 |
| Gene information | Species | Human | Gene symbol | PARP3 | Gene ID | 10039 |
| Gene name | poly(ADP-ribose) polymerase family member 3 | |
| Gene Alias | ADPRT3 | |
| Cytomap | 3p21.2 | |
| Gene Type | protein-coding | GO ID | GO:0000018 | UniProtAcc | Q9Y6F1 |
Top |
Malignant transformation analysis |
| Identification of the aberrant gene expression in precancerous and cancerous lesions by comparing the gene expression of stem-like cells in diseased tissues with normal stem cells |
| Entrez ID | Symbol | Replicates | Species | Organ | Tissue | Adj P-value | Log2FC | Malignancy |
| 10039 | PARP3 | LZE4T | Human | Esophagus | ESCC | 1.10e-04 | 1.69e-01 | 0.0811 |
| 10039 | PARP3 | LZE20T | Human | Esophagus | ESCC | 4.41e-02 | 7.39e-02 | 0.0662 |
| 10039 | PARP3 | LZE24T | Human | Esophagus | ESCC | 4.17e-10 | 1.92e-01 | 0.0596 |
| 10039 | PARP3 | P2T-E | Human | Esophagus | ESCC | 1.08e-07 | 1.22e-01 | 0.1177 |
| 10039 | PARP3 | P4T-E | Human | Esophagus | ESCC | 1.39e-04 | 1.36e-01 | 0.1323 |
| 10039 | PARP3 | P5T-E | Human | Esophagus | ESCC | 6.18e-06 | 5.63e-02 | 0.1327 |
| 10039 | PARP3 | P8T-E | Human | Esophagus | ESCC | 9.02e-15 | 2.27e-01 | 0.0889 |
| 10039 | PARP3 | P9T-E | Human | Esophagus | ESCC | 1.23e-08 | 1.68e-01 | 0.1131 |
| 10039 | PARP3 | P10T-E | Human | Esophagus | ESCC | 2.38e-05 | 9.82e-02 | 0.116 |
| 10039 | PARP3 | P11T-E | Human | Esophagus | ESCC | 2.15e-10 | 3.81e-01 | 0.1426 |
| 10039 | PARP3 | P12T-E | Human | Esophagus | ESCC | 3.41e-14 | 2.20e-01 | 0.1122 |
| 10039 | PARP3 | P15T-E | Human | Esophagus | ESCC | 4.64e-08 | 1.58e-01 | 0.1149 |
| 10039 | PARP3 | P16T-E | Human | Esophagus | ESCC | 4.08e-16 | 1.53e-01 | 0.1153 |
| 10039 | PARP3 | P17T-E | Human | Esophagus | ESCC | 1.04e-04 | 2.81e-01 | 0.1278 |
| 10039 | PARP3 | P19T-E | Human | Esophagus | ESCC | 6.81e-05 | 2.48e-01 | 0.1662 |
| 10039 | PARP3 | P20T-E | Human | Esophagus | ESCC | 4.10e-14 | 2.57e-01 | 0.1124 |
| 10039 | PARP3 | P21T-E | Human | Esophagus | ESCC | 3.97e-17 | 2.13e-01 | 0.1617 |
| 10039 | PARP3 | P22T-E | Human | Esophagus | ESCC | 7.22e-10 | 1.31e-01 | 0.1236 |
| 10039 | PARP3 | P23T-E | Human | Esophagus | ESCC | 2.53e-16 | 3.22e-01 | 0.108 |
| 10039 | PARP3 | P24T-E | Human | Esophagus | ESCC | 1.03e-16 | 3.50e-01 | 0.1287 |
| Page: 1 2 3 4 |
| Tissue | Expression Dynamics | Abbreviation |
| Esophagus | 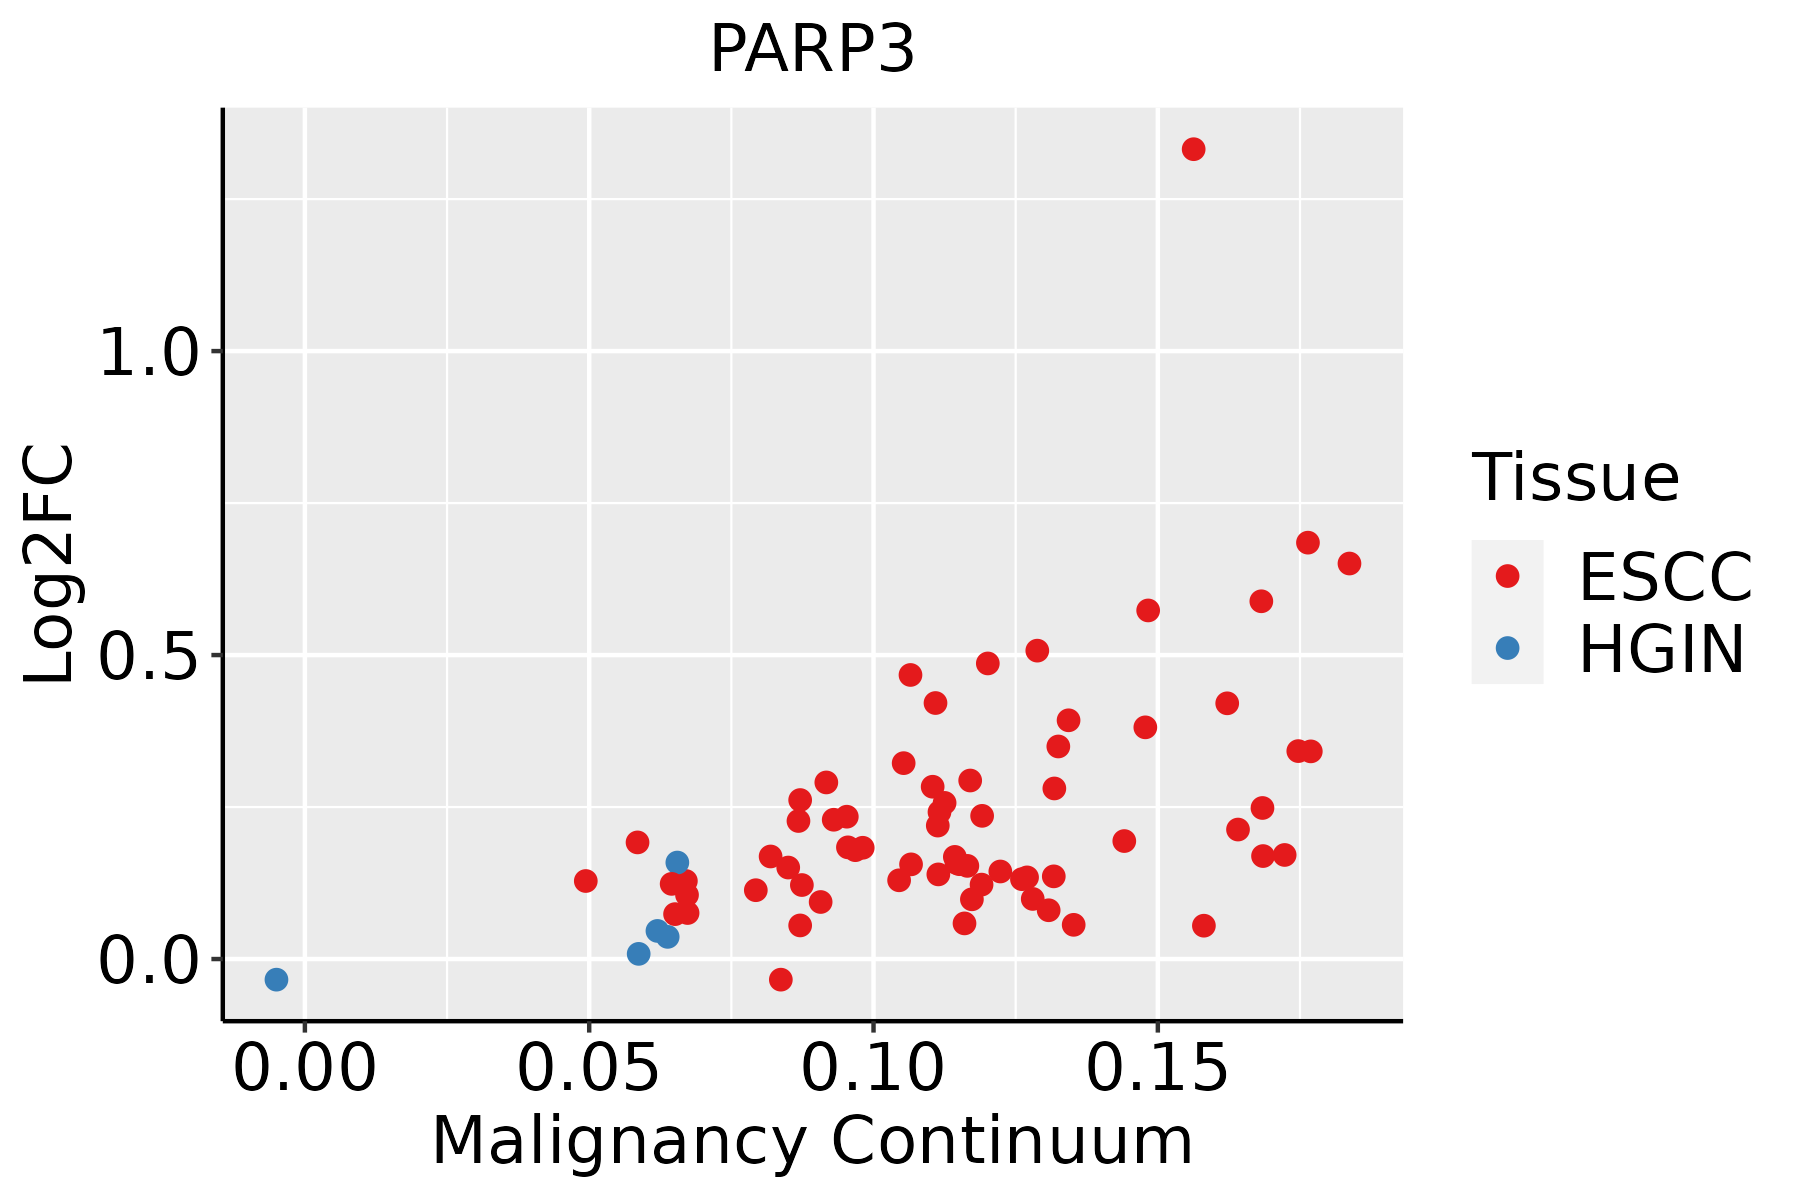 | ESCC: Esophageal squamous cell carcinoma |
| HGIN: High-grade intraepithelial neoplasias | ||
| LGIN: Low-grade intraepithelial neoplasias | ||
| Liver | 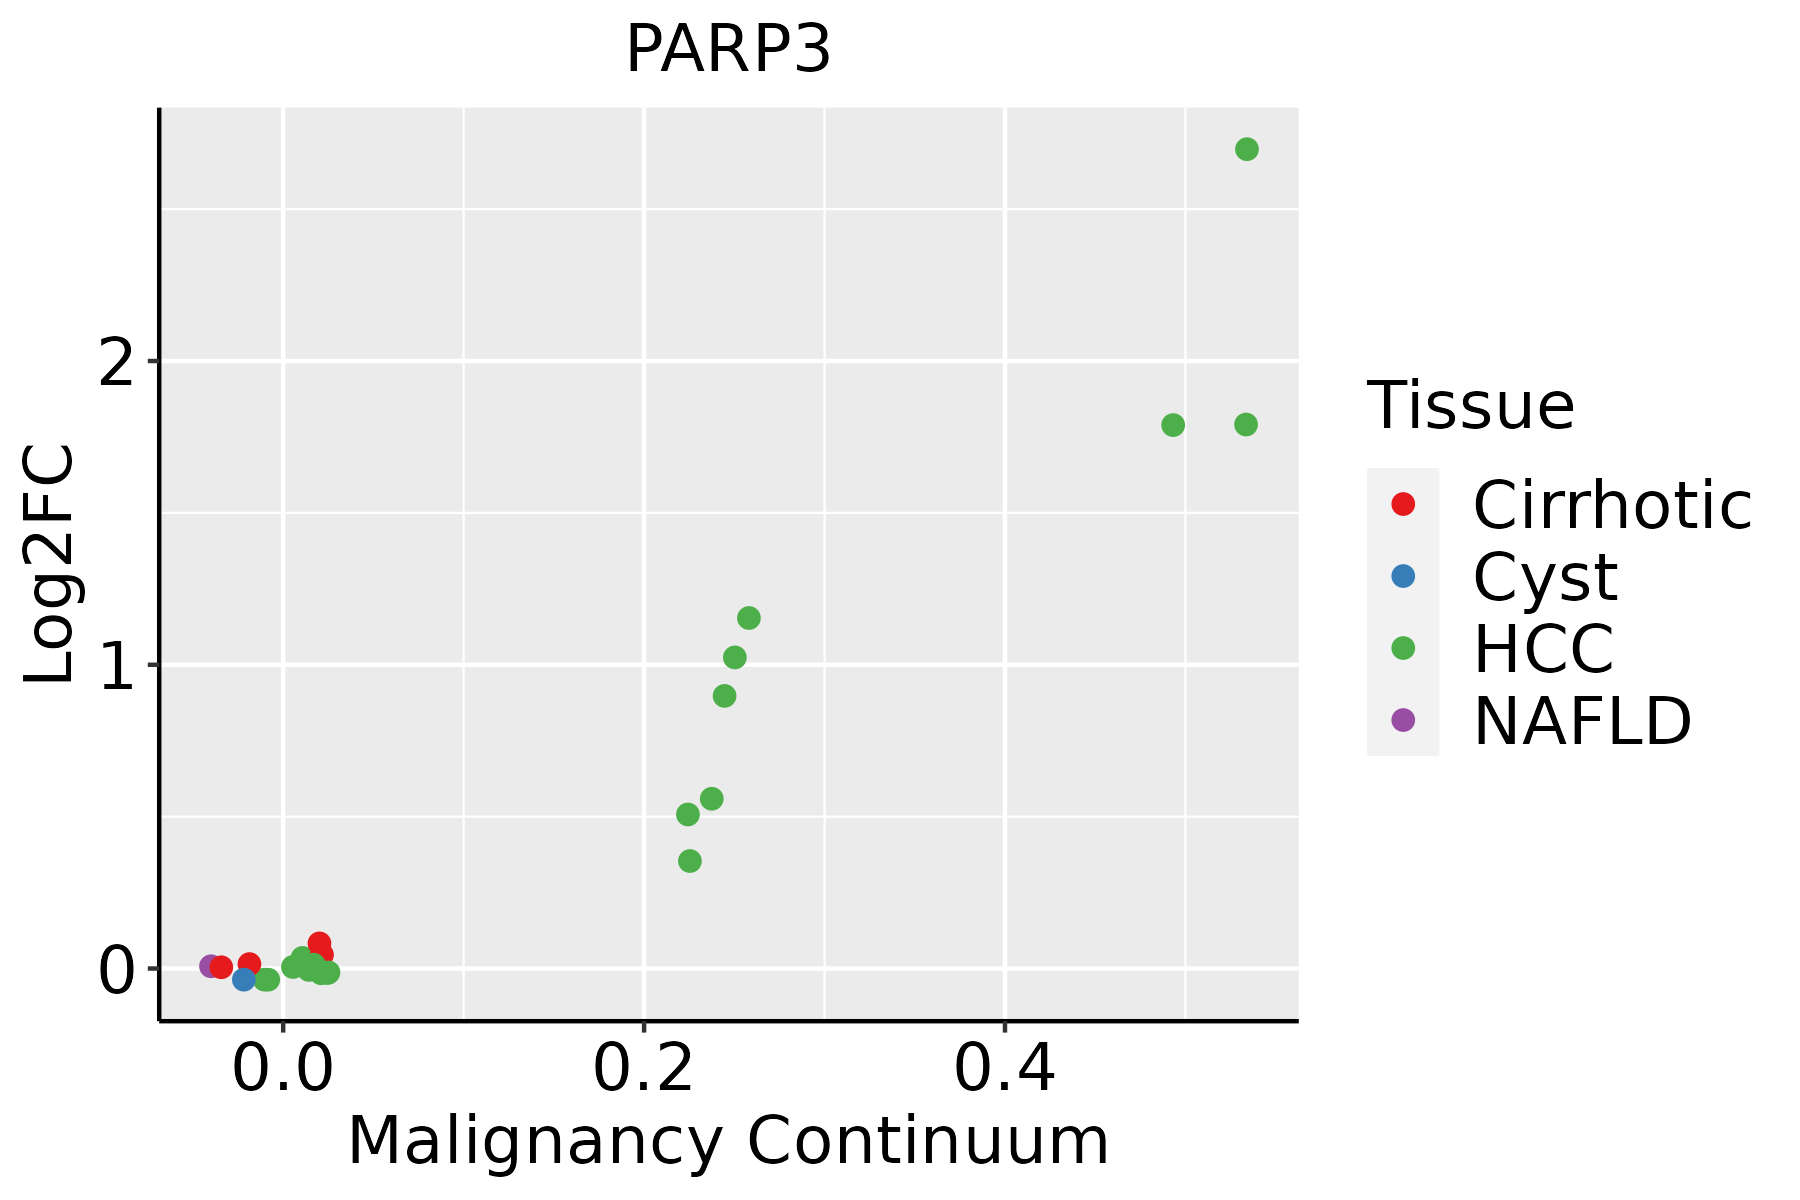 | HCC: Hepatocellular carcinoma |
| NAFLD: Non-alcoholic fatty liver disease | ||
| Oral Cavity | 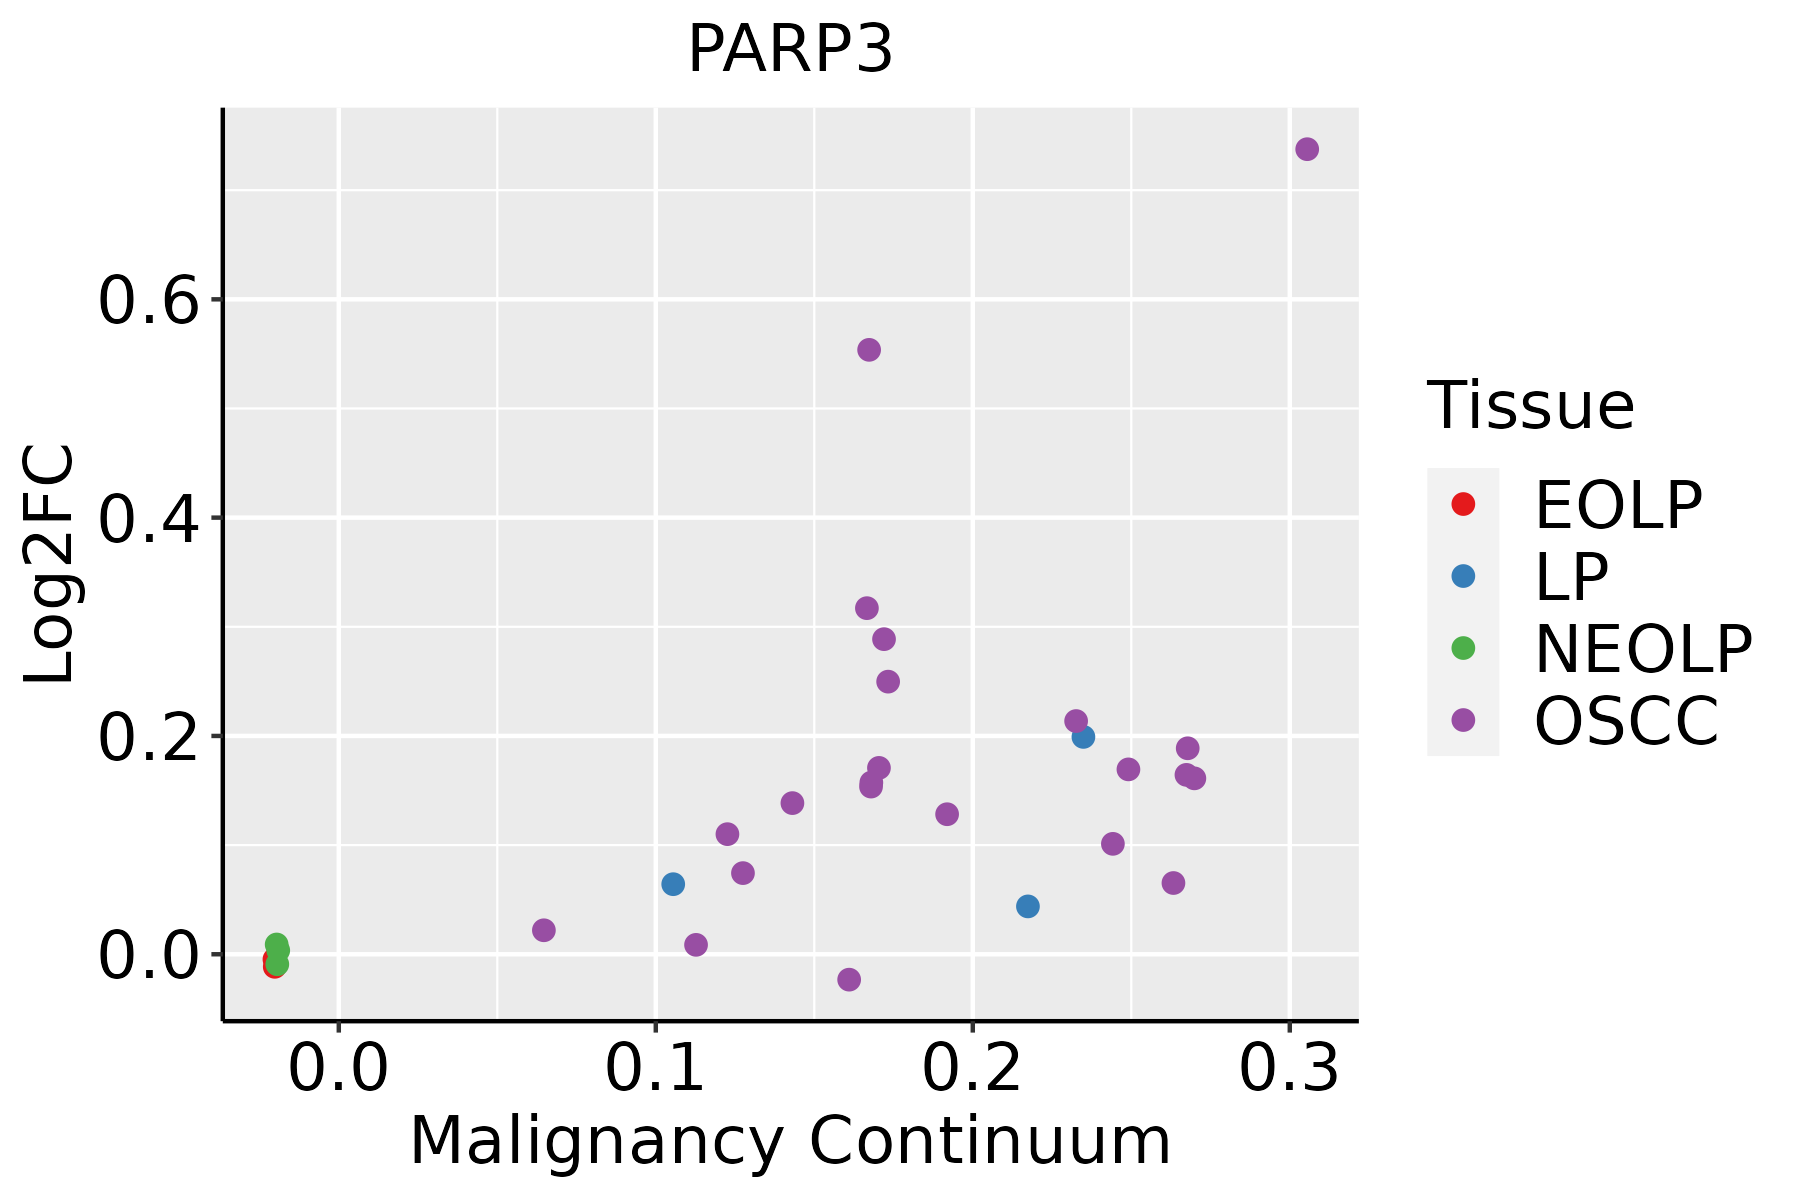 | EOLP: Erosive Oral lichen planus |
| LP: leukoplakia | ||
| NEOLP: Non-erosive oral lichen planus | ||
| OSCC: Oral squamous cell carcinoma |
| ∗log2FC in expression of this searched gene in stem-like cells from each diseased tissue sample relative to stem-like cells in normal samples in each tissue plotted against the malignancy continuum. Samples are colored based on if they are from different disease stage. |
Top |
Malignant transformation related pathway analysis |
| Find out the enriched GO biological processes and KEGG pathways involved in transition from healthy to precancer to cancer |
| Tissue | Disease Stage | Enriched GO biological Processes |
| Colorectum | AD |  |
| Colorectum | SER |  |
| Colorectum | MSS |  |
| Colorectum | MSI-H |  |
| Colorectum | FAP |  |
| ∗Top 15 enriched GO BP terms are showed in the bar plot of each disease state in each tissue. Each row represents a significant GO biological process which is colored according to the -log10(p.adjust). |
| Page: 1 2 3 4 5 6 7 8 9 |
| GO ID | Tissue | Disease Stage | Description | Gene Ratio | Bg Ratio | pvalue | p.adjust | Count |
| GO:190285015 | Esophagus | ESCC | microtubule cytoskeleton organization involved in mitosis | 116/8552 | 147/18723 | 1.25e-16 | 9.91e-15 | 116 |
| GO:000705214 | Esophagus | ESCC | mitotic spindle organization | 97/8552 | 120/18723 | 2.17e-15 | 1.33e-13 | 97 |
| GO:000705114 | Esophagus | ESCC | spindle organization | 134/8552 | 184/18723 | 5.70e-14 | 2.87e-12 | 134 |
| GO:005105215 | Esophagus | ESCC | regulation of DNA metabolic process | 232/8552 | 359/18723 | 2.40e-13 | 1.13e-11 | 232 |
| GO:000072319 | Esophagus | ESCC | telomere maintenance | 99/8552 | 131/18723 | 2.68e-12 | 1.08e-10 | 99 |
| GO:007189716 | Esophagus | ESCC | DNA biosynthetic process | 127/8552 | 180/18723 | 1.04e-11 | 3.85e-10 | 127 |
| GO:0051348111 | Esophagus | ESCC | negative regulation of transferase activity | 177/8552 | 268/18723 | 1.08e-11 | 4.00e-10 | 177 |
| GO:005105417 | Esophagus | ESCC | positive regulation of DNA metabolic process | 139/8552 | 201/18723 | 1.20e-11 | 4.33e-10 | 139 |
| GO:2000278110 | Esophagus | ESCC | regulation of DNA biosynthetic process | 81/8552 | 106/18723 | 9.81e-11 | 2.96e-09 | 81 |
| GO:2001020110 | Esophagus | ESCC | regulation of response to DNA damage stimulus | 145/8552 | 219/18723 | 5.97e-10 | 1.50e-08 | 145 |
| GO:003450211 | Esophagus | ESCC | protein localization to chromosome | 70/8552 | 92/18723 | 2.54e-09 | 5.64e-08 | 70 |
| GO:00705078 | Esophagus | ESCC | regulation of microtubule cytoskeleton organization | 99/8552 | 148/18723 | 1.43e-07 | 2.29e-06 | 99 |
| GO:005197217 | Esophagus | ESCC | regulation of telomerase activity | 39/8552 | 47/18723 | 1.48e-07 | 2.35e-06 | 39 |
| GO:00063024 | Esophagus | ESCC | double-strand break repair | 152/8552 | 251/18723 | 1.33e-06 | 1.62e-05 | 152 |
| GO:009022413 | Esophagus | ESCC | regulation of spindle organization | 32/8552 | 39/18723 | 3.27e-06 | 3.65e-05 | 32 |
| GO:006023614 | Esophagus | ESCC | regulation of mitotic spindle organization | 29/8552 | 35/18723 | 6.61e-06 | 6.75e-05 | 29 |
| GO:003220014 | Esophagus | ESCC | telomere organization | 99/8552 | 159/18723 | 1.77e-05 | 1.57e-04 | 99 |
| GO:20010228 | Esophagus | ESCC | positive regulation of response to DNA damage stimulus | 69/8552 | 105/18723 | 2.66e-05 | 2.22e-04 | 69 |
| GO:00062826 | Esophagus | ESCC | regulation of DNA repair | 82/8552 | 130/18723 | 4.65e-05 | 3.66e-04 | 82 |
| GO:00457395 | Esophagus | ESCC | positive regulation of DNA repair | 49/8552 | 73/18723 | 1.74e-04 | 1.14e-03 | 49 |
| Page: 1 2 3 4 5 |
| Pathway ID | Tissue | Disease Stage | Description | Gene Ratio | Bg Ratio | pvalue | p.adjust | qvalue | Count |
| hsa0421027 | Esophagus | ESCC | Apoptosis | 102/4205 | 136/8465 | 1.05e-09 | 1.21e-08 | 6.21e-09 | 102 |
| hsa034104 | Esophagus | ESCC | Base excision repair | 38/4205 | 44/8465 | 3.59e-07 | 2.62e-06 | 1.34e-06 | 38 |
| hsa0421037 | Esophagus | ESCC | Apoptosis | 102/4205 | 136/8465 | 1.05e-09 | 1.21e-08 | 6.21e-09 | 102 |
| hsa0341011 | Esophagus | ESCC | Base excision repair | 38/4205 | 44/8465 | 3.59e-07 | 2.62e-06 | 1.34e-06 | 38 |
| hsa042102 | Liver | HCC | Apoptosis | 83/4020 | 136/8465 | 9.51e-04 | 3.58e-03 | 1.99e-03 | 83 |
| hsa042103 | Liver | HCC | Apoptosis | 83/4020 | 136/8465 | 9.51e-04 | 3.58e-03 | 1.99e-03 | 83 |
| hsa0421018 | Oral cavity | OSCC | Apoptosis | 101/3704 | 136/8465 | 3.34e-13 | 7.00e-12 | 3.56e-12 | 101 |
| hsa03410 | Oral cavity | OSCC | Base excision repair | 32/3704 | 44/8465 | 9.11e-05 | 3.25e-04 | 1.65e-04 | 32 |
| hsa0421019 | Oral cavity | OSCC | Apoptosis | 101/3704 | 136/8465 | 3.34e-13 | 7.00e-12 | 3.56e-12 | 101 |
| hsa034101 | Oral cavity | OSCC | Base excision repair | 32/3704 | 44/8465 | 9.11e-05 | 3.25e-04 | 1.65e-04 | 32 |
| Page: 1 |
Top |
Cell-cell communication analysis |
| Identification of potential cell-cell interactions between two cell types and their ligand-receptor pairs for different disease states |
| Ligand | Receptor | LRpair | Pathway | Tissue | Disease Stage |
| Page: 1 |
Top |
Single-cell gene regulatory network inference analysis |
| Find out the significant the regulons (TFs) and the target genes of each regulon across cell types for different disease states |
| TF | Cell Type | Tissue | Disease Stage | Target Gene | RSS | Regulon Activity |
| ∗The dot plots of a searched regulon are shown for all cell subpopulations in each disease state of each tissue based on the regulon specific score inferred using pySCENIC and by calculating the average expression. |
| Page: 1 |
Top |
Somatic mutation of malignant transformation related genes |
| Annotation of somatic variants for genes involved in malignant transformation |
| Hugo Symbol | Variant Class | Variant Classification | dbSNP RS | HGVSc | HGVSp | HGVSp Short | SWISSPROT | BIOTYPE | SIFT | PolyPhen | Tumor Sample Barcode | Tissue | Histology | Sex | Age | Stage | Therapy Types | Drugs | Outcome |
| PARP3 | SNV | Missense_Mutation | c.1256N>T | p.Gly419Val | p.G419V | Q9Y6F1 | protein_coding | deleterious(0) | probably_damaging(1) | TCGA-A2-A25A-01 | Breast | breast invasive carcinoma | Female | <65 | I/II | Unspecific | Cytoxan | SD | |
| PARP3 | SNV | Missense_Mutation | c.1357C>A | p.Leu453Met | p.L453M | Q9Y6F1 | protein_coding | deleterious(0.03) | probably_damaging(0.988) | TCGA-B6-A0IN-01 | Breast | breast invasive carcinoma | Female | <65 | I/II | Unknown | Unknown | PD | |
| PARP3 | SNV | Missense_Mutation | c.247N>C | p.Glu83Gln | p.E83Q | Q9Y6F1 | protein_coding | deleterious(0.03) | benign(0) | TCGA-BH-A18V-01 | Breast | breast invasive carcinoma | Female | <65 | I/II | Unknown | Unknown | SD | |
| PARP3 | SNV | Missense_Mutation | c.249N>C | p.Glu83Asp | p.E83D | Q9Y6F1 | protein_coding | tolerated(0.07) | benign(0) | TCGA-D8-A27G-01 | Breast | breast invasive carcinoma | Female | >=65 | I/II | Unknown | Unknown | SD | |
| PARP3 | SNV | Missense_Mutation | c.619N>A | p.Glu207Lys | p.E207K | Q9Y6F1 | protein_coding | deleterious(0.01) | benign(0.009) | TCGA-D8-A27G-01 | Breast | breast invasive carcinoma | Female | >=65 | I/II | Unknown | Unknown | SD | |
| PARP3 | SNV | Missense_Mutation | c.211G>C | p.Glu71Gln | p.E71Q | Q9Y6F1 | protein_coding | tolerated(0.07) | benign(0.42) | TCGA-GM-A2D9-01 | Breast | breast invasive carcinoma | Female | >=65 | I/II | Hormone Therapy | arimidex | SD | |
| PARP3 | insertion | In_Frame_Ins | novel | c.745_746insGCCCCACGGATGGTGGCCTCCCCTCTCCTCTCTCACATGACTGGTATTGTAGCC | p.Gly254_Gln255insLeuProSerProLeuSerHisAspTrpTyrCysSerArgProThrAspGlyGly | p.G254_Q255insLPSPLSHDWYCSRPTDGG | Q9Y6F1 | protein_coding | TCGA-A2-A0CT-01 | Breast | breast invasive carcinoma | Female | >=65 | I/II | Chemotherapy | cytoxan | SD | ||
| PARP3 | SNV | Missense_Mutation | rs201864296 | c.1522N>T | p.Pro508Ser | p.P508S | Q9Y6F1 | protein_coding | tolerated(0.28) | benign(0.007) | TCGA-Q1-A73Q-01 | Cervix | cervical & endocervical cancer | Female | <65 | I/II | Chemotherapy | cisplatin | SD |
| PARP3 | SNV | Missense_Mutation | c.955N>T | p.Pro319Ser | p.P319S | Q9Y6F1 | protein_coding | deleterious(0.01) | possibly_damaging(0.693) | TCGA-VS-A94Z-01 | Cervix | cervical & endocervical cancer | Female | <65 | I/II | Chemotherapy | cisplatin | CR | |
| PARP3 | SNV | Missense_Mutation | c.1505N>T | p.Pro502Leu | p.P502L | Q9Y6F1 | protein_coding | deleterious(0.01) | probably_damaging(0.999) | TCGA-A6-6138-01 | Colorectum | colon adenocarcinoma | Male | <65 | I/II | Unknown | Unknown | SD |
| Page: 1 2 3 4 5 6 |
Top |
Related drugs of malignant transformation related genes |
| Identification of chemicals and drugs interact with genes involved in malignant transfromation |
| (DGIdb 4.0) |
| Entrez ID | Symbol | Category | Interaction Types | Drug Claim Name | Drug Name | PMIDs |
| 10039 | PARP3 | DRUGGABLE GENOME, ENZYME, CLINICALLY ACTIONABLE, DNA REPAIR | inhibitor | CHEMBL506871 | VELIPARIB | |
| 10039 | PARP3 | DRUGGABLE GENOME, ENZYME, CLINICALLY ACTIONABLE, DNA REPAIR | inhibitor | 252166678 | ||
| 10039 | PARP3 | DRUGGABLE GENOME, ENZYME, CLINICALLY ACTIONABLE, DNA REPAIR | inhibitor | CHEMBL3833368 | RUCAPARIB CAMSYLATE | |
| 10039 | PARP3 | DRUGGABLE GENOME, ENZYME, CLINICALLY ACTIONABLE, DNA REPAIR | inhibitor | CHEMBL521686 | OLAPARIB | |
| 10039 | PARP3 | DRUGGABLE GENOME, ENZYME, CLINICALLY ACTIONABLE, DNA REPAIR | 3-phenyl isoquinolin-1(2H) derivative 1 | |||
| 10039 | PARP3 | DRUGGABLE GENOME, ENZYME, CLINICALLY ACTIONABLE, DNA REPAIR | rucaparib | RUCAPARIB | ||
| 10039 | PARP3 | DRUGGABLE GENOME, ENZYME, CLINICALLY ACTIONABLE, DNA REPAIR | KU-0058948 | CHEMBL380648 | 19354255 | |
| 10039 | PARP3 | DRUGGABLE GENOME, ENZYME, CLINICALLY ACTIONABLE, DNA REPAIR | inhibitor | CHEMBL1173055 | RUCAPARIB |
| Page: 1 |

Copyright 2023-Present -The University of Texas Health Science Center at Houston |