
|
|||||
|
 | |
| |
| |
| |
| |
| |
|
Gene: PARP12 |
Gene summary for PARP12 |
| Gene information | Species | Human | Gene symbol | PARP12 | Gene ID | 64761 |
| Gene name | poly(ADP-ribose) polymerase family member 12 | |
| Gene Alias | ARTD12 | |
| Cytomap | 7q34 | |
| Gene Type | protein-coding | GO ID | GO:0006464 | UniProtAcc | A4D1T0 |
Top |
Malignant transformation analysis |
| Identification of the aberrant gene expression in precancerous and cancerous lesions by comparing the gene expression of stem-like cells in diseased tissues with normal stem cells |
| Entrez ID | Symbol | Replicates | Species | Organ | Tissue | Adj P-value | Log2FC | Malignancy |
| 64761 | PARP12 | LZE20T | Human | Esophagus | ESCC | 6.06e-06 | 2.57e-01 | 0.0662 |
| 64761 | PARP12 | LZE24T | Human | Esophagus | ESCC | 3.17e-19 | 5.89e-01 | 0.0596 |
| 64761 | PARP12 | P1T-E | Human | Esophagus | ESCC | 3.50e-04 | 3.58e-01 | 0.0875 |
| 64761 | PARP12 | P2T-E | Human | Esophagus | ESCC | 2.25e-17 | 3.45e-01 | 0.1177 |
| 64761 | PARP12 | P4T-E | Human | Esophagus | ESCC | 4.43e-11 | 2.67e-01 | 0.1323 |
| 64761 | PARP12 | P5T-E | Human | Esophagus | ESCC | 6.77e-13 | 2.90e-01 | 0.1327 |
| 64761 | PARP12 | P8T-E | Human | Esophagus | ESCC | 5.76e-14 | 2.85e-01 | 0.0889 |
| 64761 | PARP12 | P9T-E | Human | Esophagus | ESCC | 2.65e-18 | 4.22e-01 | 0.1131 |
| 64761 | PARP12 | P10T-E | Human | Esophagus | ESCC | 2.32e-04 | 7.36e-02 | 0.116 |
| 64761 | PARP12 | P11T-E | Human | Esophagus | ESCC | 2.89e-20 | 7.02e-01 | 0.1426 |
| 64761 | PARP12 | P12T-E | Human | Esophagus | ESCC | 2.45e-20 | 3.72e-01 | 0.1122 |
| 64761 | PARP12 | P15T-E | Human | Esophagus | ESCC | 2.12e-22 | 4.97e-01 | 0.1149 |
| 64761 | PARP12 | P16T-E | Human | Esophagus | ESCC | 1.76e-12 | 2.03e-01 | 0.1153 |
| 64761 | PARP12 | P17T-E | Human | Esophagus | ESCC | 2.56e-15 | 4.98e-01 | 0.1278 |
| 64761 | PARP12 | P19T-E | Human | Esophagus | ESCC | 2.29e-07 | 7.44e-01 | 0.1662 |
| 64761 | PARP12 | P20T-E | Human | Esophagus | ESCC | 1.06e-08 | 2.67e-01 | 0.1124 |
| 64761 | PARP12 | P21T-E | Human | Esophagus | ESCC | 3.90e-42 | 7.10e-01 | 0.1617 |
| 64761 | PARP12 | P22T-E | Human | Esophagus | ESCC | 1.73e-08 | 1.33e-01 | 0.1236 |
| 64761 | PARP12 | P23T-E | Human | Esophagus | ESCC | 1.16e-16 | 3.83e-01 | 0.108 |
| 64761 | PARP12 | P24T-E | Human | Esophagus | ESCC | 4.63e-38 | 7.35e-01 | 0.1287 |
| Page: 1 2 3 4 5 6 |
| Tissue | Expression Dynamics | Abbreviation |
| Esophagus | 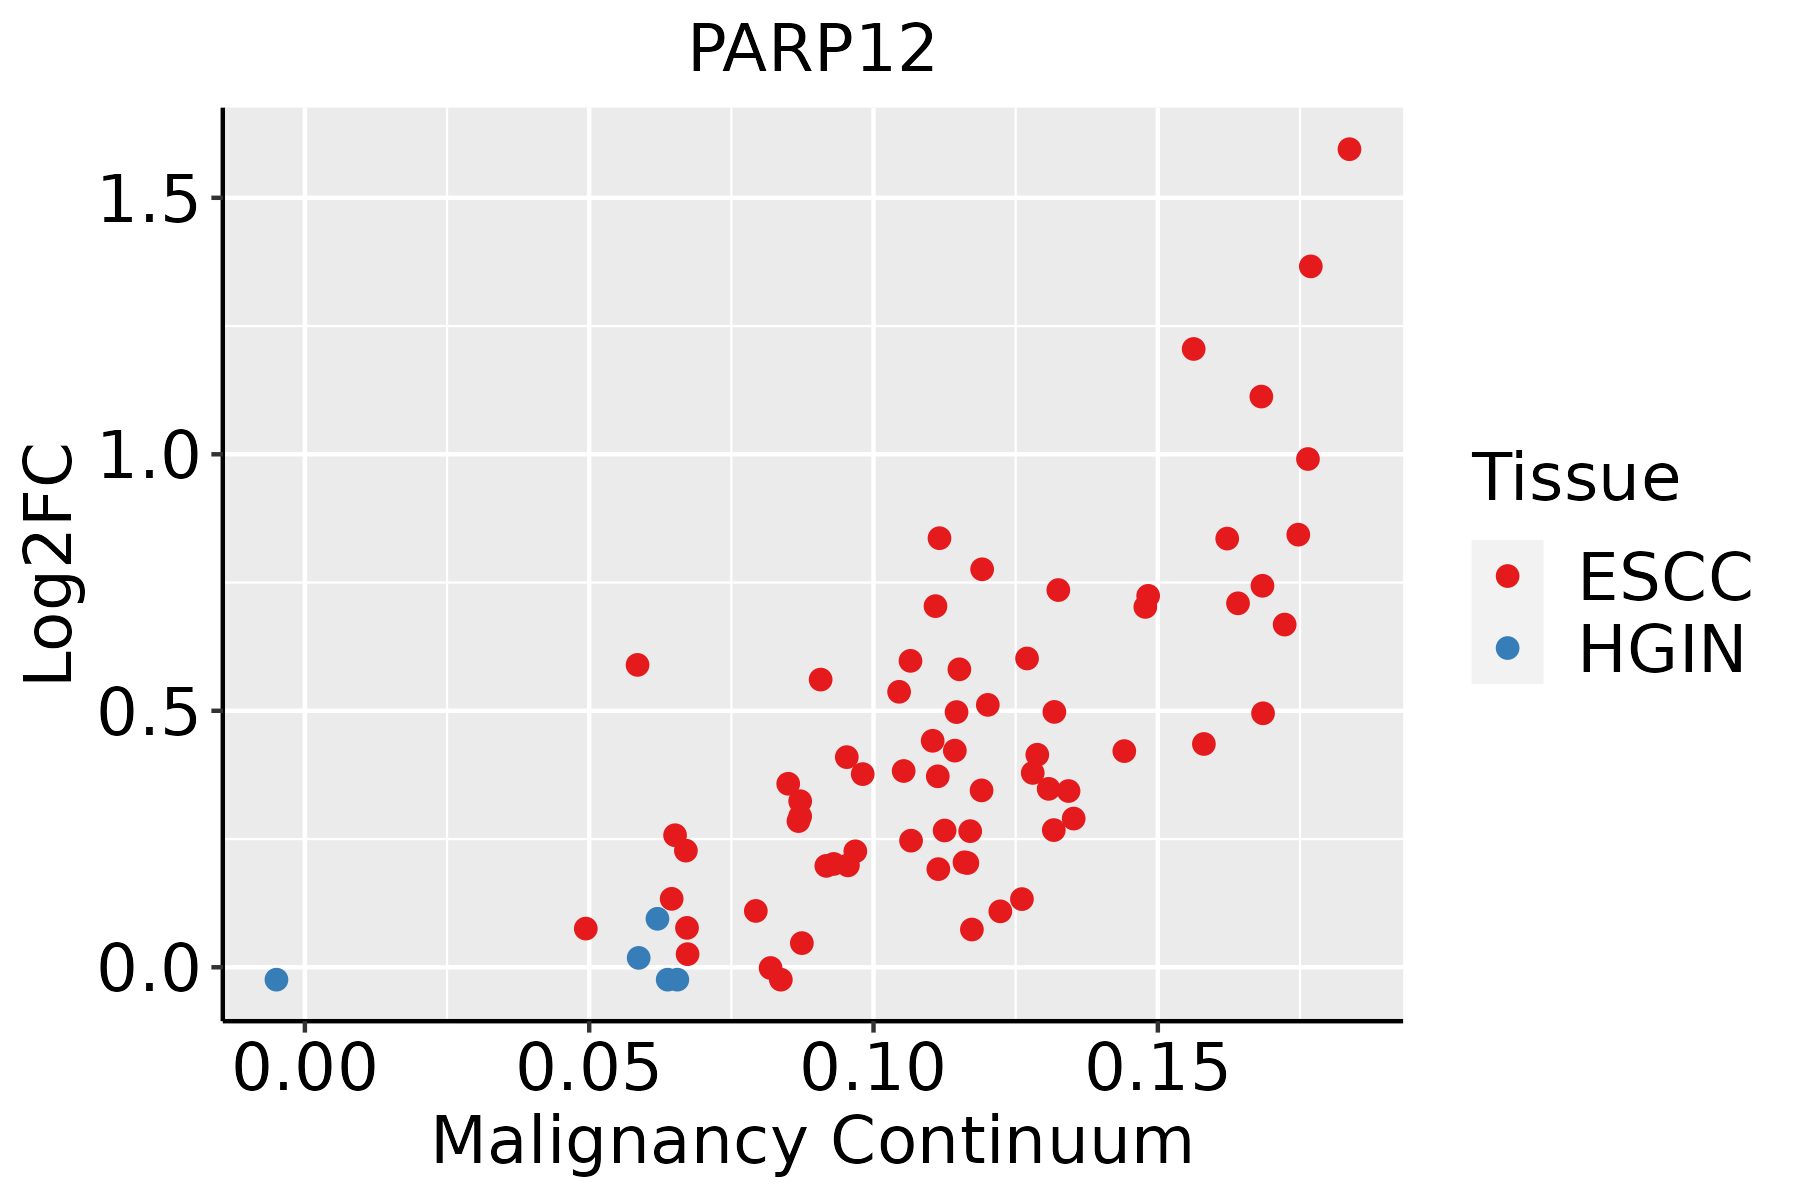 | ESCC: Esophageal squamous cell carcinoma |
| HGIN: High-grade intraepithelial neoplasias | ||
| LGIN: Low-grade intraepithelial neoplasias | ||
| Liver | 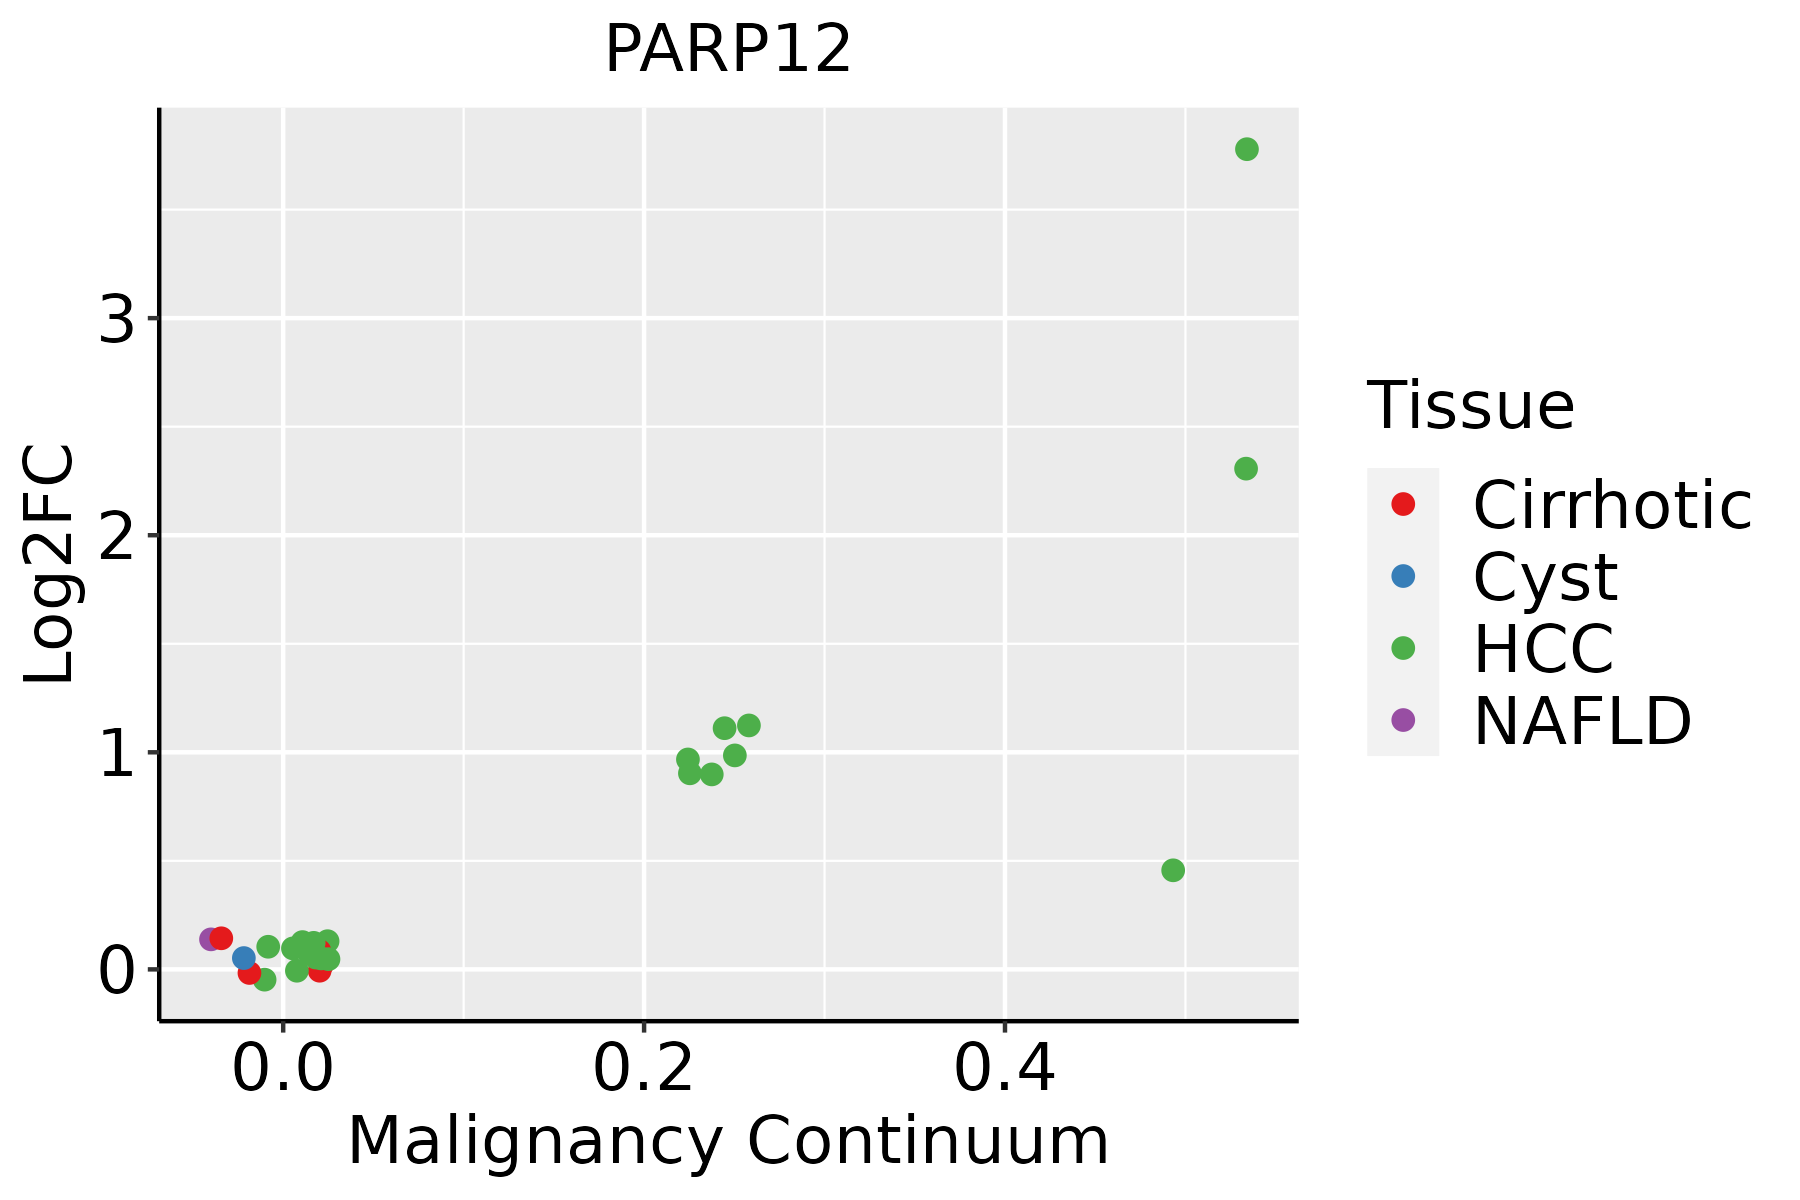 | HCC: Hepatocellular carcinoma |
| NAFLD: Non-alcoholic fatty liver disease | ||
| Oral Cavity | 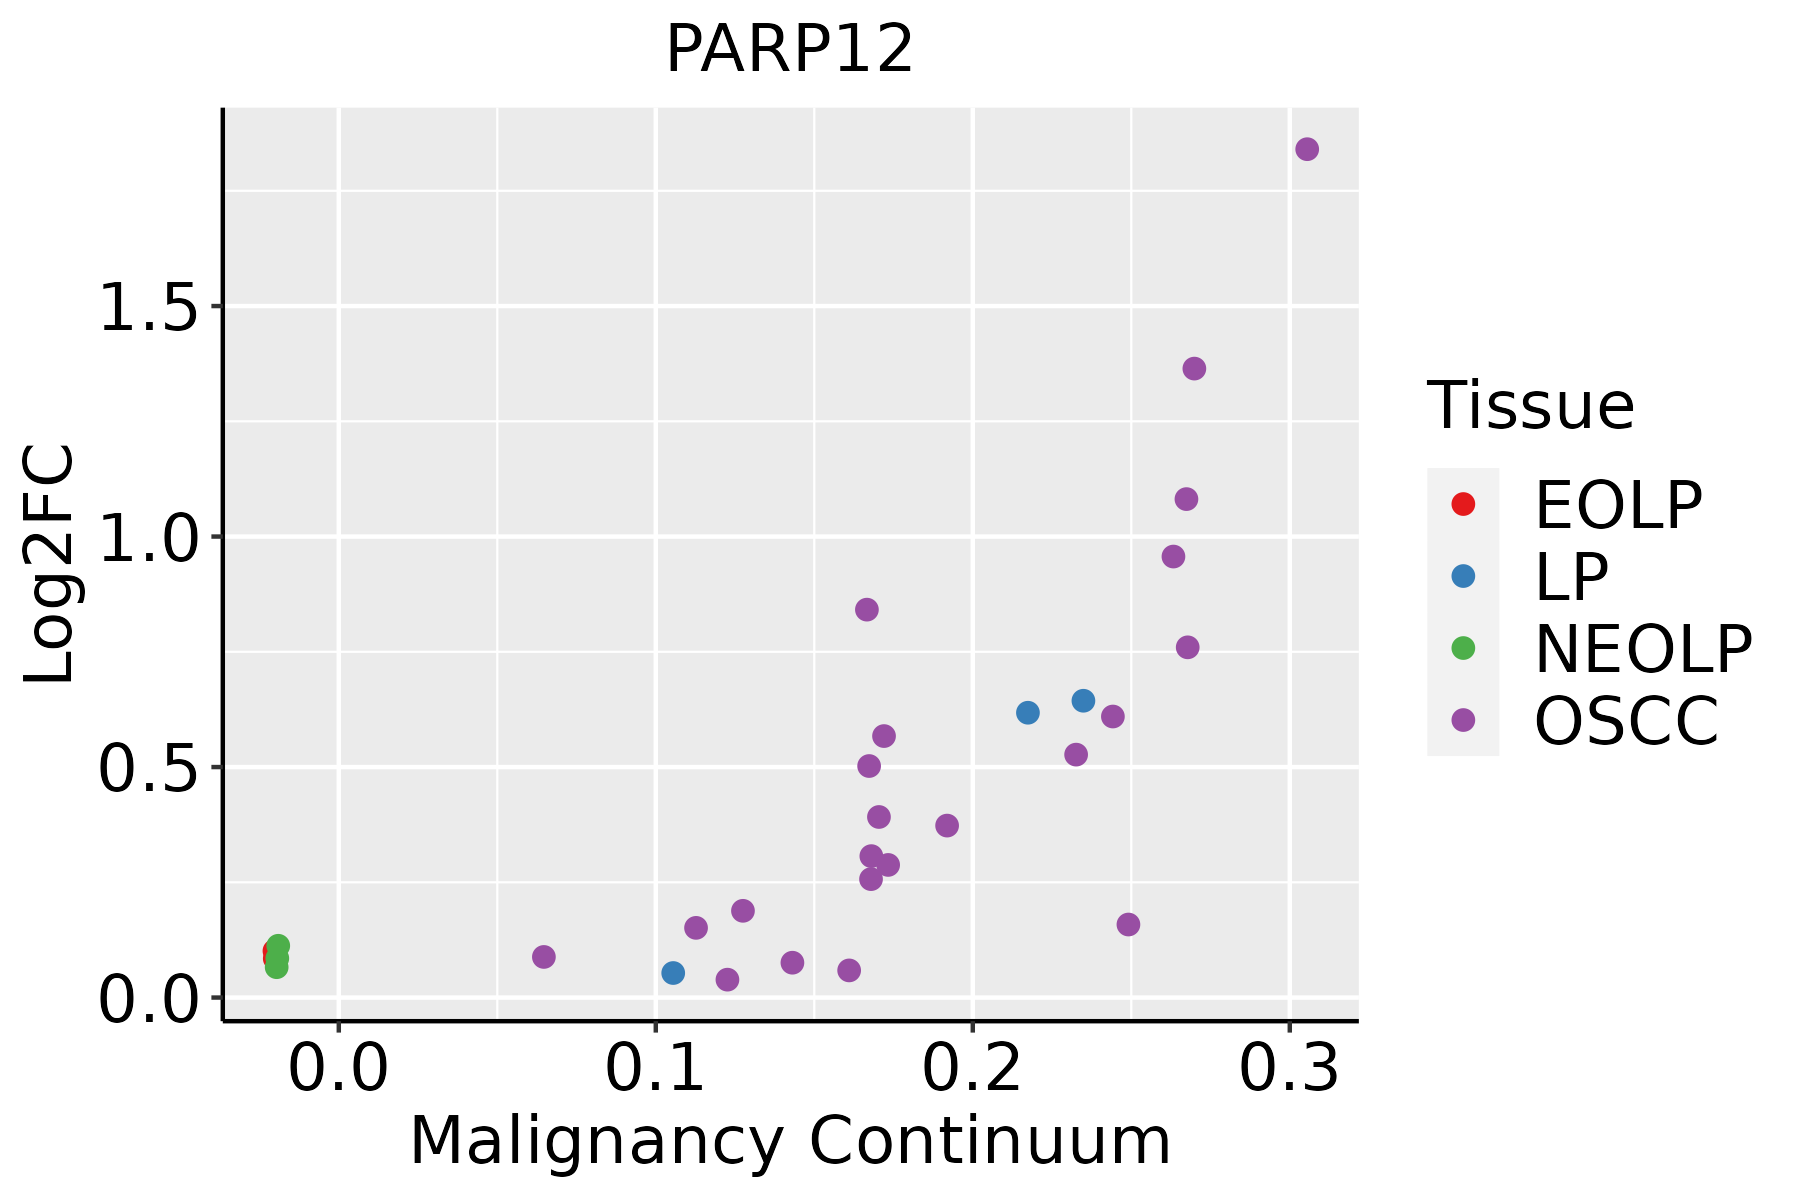 | EOLP: Erosive Oral lichen planus |
| LP: leukoplakia | ||
| NEOLP: Non-erosive oral lichen planus | ||
| OSCC: Oral squamous cell carcinoma | ||
| Skin |  | AK: Actinic keratosis |
| cSCC: Cutaneous squamous cell carcinoma | ||
| SCCIS:squamous cell carcinoma in situ | ||
| Thyroid | 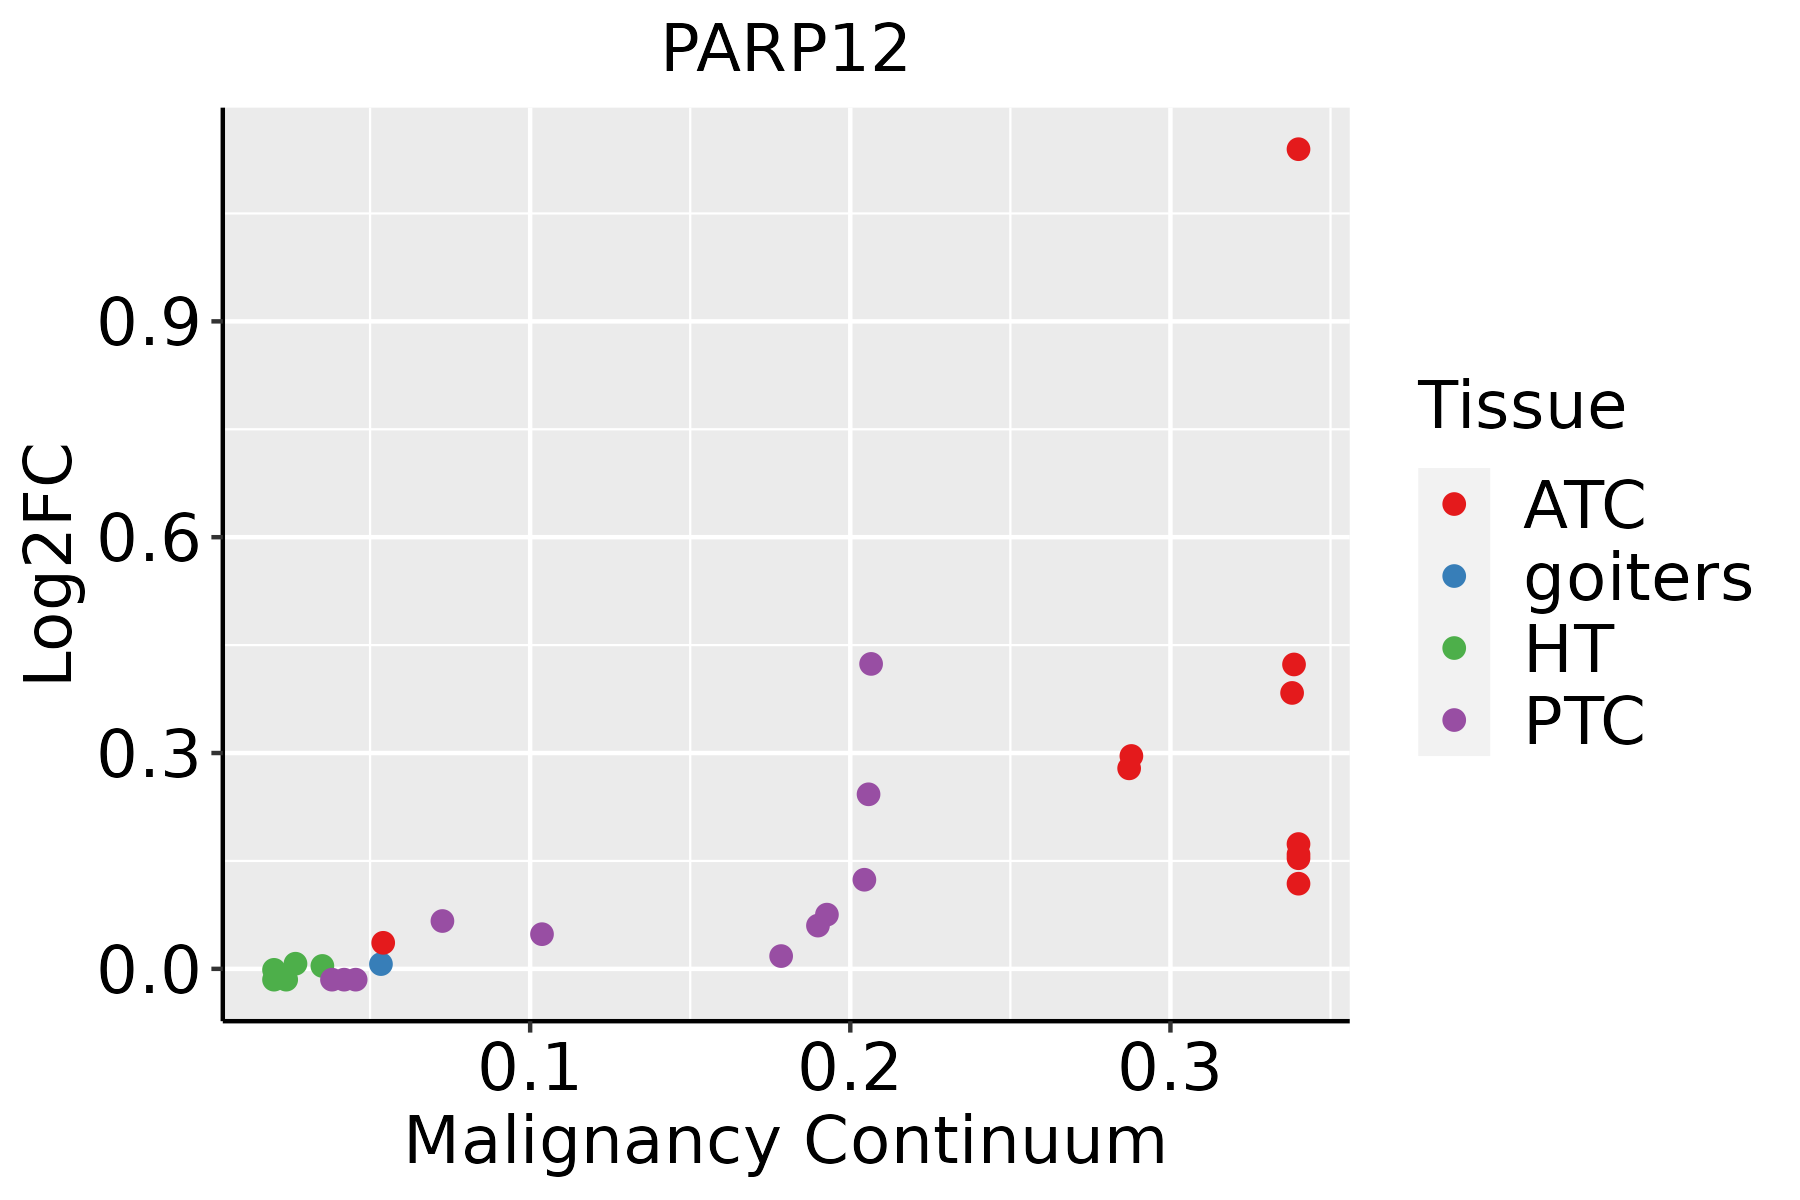 | ATC: Anaplastic thyroid cancer |
| HT: Hashimoto's thyroiditis | ||
| PTC: Papillary thyroid cancer |
| ∗log2FC in expression of this searched gene in stem-like cells from each diseased tissue sample relative to stem-like cells in normal samples in each tissue plotted against the malignancy continuum. Samples are colored based on if they are from different disease stage. |
Top |
Malignant transformation related pathway analysis |
| Find out the enriched GO biological processes and KEGG pathways involved in transition from healthy to precancer to cancer |
| Tissue | Disease Stage | Enriched GO biological Processes |
| Colorectum | AD |  |
| Colorectum | SER |  |
| Colorectum | MSS |  |
| Colorectum | MSI-H |  |
| Colorectum | FAP |  |
| ∗Top 15 enriched GO BP terms are showed in the bar plot of each disease state in each tissue. Each row represents a significant GO biological process which is colored according to the -log10(p.adjust). |
| Page: 1 2 3 4 5 6 7 8 9 |
| GO ID | Tissue | Disease Stage | Description | Gene Ratio | Bg Ratio | pvalue | p.adjust | Count |
| GO:00702131 | Esophagus | ESCC | protein auto-ADP-ribosylation | 11/8552 | 12/18723 | 1.26e-03 | 6.06e-03 | 11 |
| GO:0006471 | Esophagus | ESCC | protein ADP-ribosylation | 24/8552 | 35/18723 | 5.25e-03 | 1.97e-02 | 24 |
| GO:0070213 | Liver | HCC | protein auto-ADP-ribosylation | 10/7958 | 12/18723 | 4.79e-03 | 2.02e-02 | 10 |
| GO:00064712 | Thyroid | PTC | protein ADP-ribosylation | 18/5968 | 35/18723 | 1.26e-02 | 4.90e-02 | 18 |
| GO:00064711 | Thyroid | ATC | protein ADP-ribosylation | 19/6293 | 35/18723 | 9.36e-03 | 3.44e-02 | 19 |
| Page: 1 |
| Pathway ID | Tissue | Disease Stage | Description | Gene Ratio | Bg Ratio | pvalue | p.adjust | qvalue | Count |
| Page: 1 |
Top |
Cell-cell communication analysis |
| Identification of potential cell-cell interactions between two cell types and their ligand-receptor pairs for different disease states |
| Ligand | Receptor | LRpair | Pathway | Tissue | Disease Stage |
| Page: 1 |
Top |
Single-cell gene regulatory network inference analysis |
| Find out the significant the regulons (TFs) and the target genes of each regulon across cell types for different disease states |
| TF | Cell Type | Tissue | Disease Stage | Target Gene | RSS | Regulon Activity |
| ∗The dot plots of a searched regulon are shown for all cell subpopulations in each disease state of each tissue based on the regulon specific score inferred using pySCENIC and by calculating the average expression. |
| Page: 1 |
Top |
Somatic mutation of malignant transformation related genes |
| Annotation of somatic variants for genes involved in malignant transformation |
| Hugo Symbol | Variant Class | Variant Classification | dbSNP RS | HGVSc | HGVSp | HGVSp Short | SWISSPROT | BIOTYPE | SIFT | PolyPhen | Tumor Sample Barcode | Tissue | Histology | Sex | Age | Stage | Therapy Types | Drugs | Outcome |
| PARP12 | SNV | Missense_Mutation | c.1762G>C | p.Gly588Arg | p.G588R | Q9H0J9 | protein_coding | deleterious(0) | probably_damaging(0.999) | TCGA-A2-A0CU-01 | Breast | breast invasive carcinoma | Female | >=65 | I/II | Hormone Therapy | tamoxiphen | SD | |
| PARP12 | SNV | Missense_Mutation | rs774506223 | c.1748T>G | p.Val583Gly | p.V583G | Q9H0J9 | protein_coding | deleterious(0) | possibly_damaging(0.869) | TCGA-AC-A6NO-01 | Breast | breast invasive carcinoma | Female | <65 | I/II | Unknown | Unknown | SD |
| PARP12 | SNV | Missense_Mutation | rs373376223 | c.2051C>T | p.Ser684Leu | p.S684L | Q9H0J9 | protein_coding | tolerated_low_confidence(0.33) | benign(0.001) | TCGA-E9-A226-01 | Breast | breast invasive carcinoma | Female | <65 | III/IV | Hormone Therapy | tamoxiphen | PD |
| PARP12 | SNV | Missense_Mutation | c.776N>T | p.Ser259Leu | p.S259L | Q9H0J9 | protein_coding | tolerated(0.18) | benign(0.003) | TCGA-EW-A1OV-01 | Breast | breast invasive carcinoma | Female | <65 | I/II | Chemotherapy | epirubicin | SD | |
| PARP12 | insertion | Frame_Shift_Ins | novel | c.1850_1851insCTTTGTGATCTTTGAGAAACACCAGGTCTACC | p.Met617IlefsTer47 | p.M617Ifs*47 | Q9H0J9 | protein_coding | TCGA-A8-A0A4-01 | Breast | breast invasive carcinoma | Female | >=65 | I/II | Hormone Therapy | tamoxiphen | CR | ||
| PARP12 | insertion | Nonsense_Mutation | novel | c.1615_1616insCGTTTTTCTGAGAGTCAGGGATTGCCTTTGTTCATT | p.Glu539delinsAlaPhePheTerGluSerGlyIleAlaPheValHisTer | p.E539delinsAFF*ESGIAFVH* | Q9H0J9 | protein_coding | TCGA-AO-A0JB-01 | Breast | breast invasive carcinoma | Female | <65 | III/IV | Chemotherapy | cyclophosphamide | SD | ||
| PARP12 | deletion | Frame_Shift_Del | novel | c.426delN | p.Gln142HisfsTer74 | p.Q142Hfs*74 | Q9H0J9 | protein_coding | TCGA-D8-A27V-01 | Breast | breast invasive carcinoma | Female | <65 | I/II | Hormone Therapy | tamoxiphen | SD | ||
| PARP12 | SNV | Missense_Mutation | novel | c.1733N>T | p.Asn578Ile | p.N578I | Q9H0J9 | protein_coding | deleterious(0) | probably_damaging(1) | TCGA-EA-A3HU-01 | Cervix | cervical & endocervical cancer | Female | <65 | I/II | Unknown | Unknown | SD |
| PARP12 | SNV | Missense_Mutation | novel | c.853A>G | p.Ser285Gly | p.S285G | Q9H0J9 | protein_coding | tolerated(0.26) | benign(0.003) | TCGA-AA-3950-01 | Colorectum | colon adenocarcinoma | Female | >=65 | I/II | Unknown | Unknown | SD |
| PARP12 | SNV | Missense_Mutation | c.656N>C | p.Leu219Pro | p.L219P | Q9H0J9 | protein_coding | deleterious(0.05) | possibly_damaging(0.856) | TCGA-AA-3966-01 | Colorectum | colon adenocarcinoma | Female | >=65 | I/II | Unknown | Unknown | SD |
| Page: 1 2 3 4 5 6 |
Top |
Related drugs of malignant transformation related genes |
| Identification of chemicals and drugs interact with genes involved in malignant transfromation |
| (DGIdb 4.0) |
| Entrez ID | Symbol | Category | Interaction Types | Drug Claim Name | Drug Name | PMIDs |
| Page: 1 |

Copyright 2023-Present -The University of Texas Health Science Center at Houston |