
|
|||||
|
 | |
| |
| |
| |
| |
| |
|
Gene: PARP10 |
Gene summary for PARP10 |
| Gene information | Species | Human | Gene symbol | PARP10 | Gene ID | 84875 |
| Gene name | poly(ADP-ribose) polymerase family member 10 | |
| Gene Alias | ARTD10 | |
| Cytomap | 8q24.3 | |
| Gene Type | protein-coding | GO ID | GO:0000209 | UniProtAcc | B4E0C4 |
Top |
Malignant transformation analysis |
| Identification of the aberrant gene expression in precancerous and cancerous lesions by comparing the gene expression of stem-like cells in diseased tissues with normal stem cells |
| Entrez ID | Symbol | Replicates | Species | Organ | Tissue | Adj P-value | Log2FC | Malignancy |
| 84875 | PARP10 | LZE4T | Human | Esophagus | ESCC | 2.37e-02 | 8.91e-02 | 0.0811 |
| 84875 | PARP10 | LZE7T | Human | Esophagus | ESCC | 3.90e-02 | 1.37e-01 | 0.0667 |
| 84875 | PARP10 | LZE8T | Human | Esophagus | ESCC | 6.71e-04 | 1.35e-01 | 0.067 |
| 84875 | PARP10 | LZE20T | Human | Esophagus | ESCC | 3.61e-13 | 3.11e-01 | 0.0662 |
| 84875 | PARP10 | LZE22T | Human | Esophagus | ESCC | 1.40e-06 | 3.42e-01 | 0.068 |
| 84875 | PARP10 | LZE24T | Human | Esophagus | ESCC | 1.43e-40 | 8.60e-01 | 0.0596 |
| 84875 | PARP10 | LZE6T | Human | Esophagus | ESCC | 9.61e-05 | 1.83e-01 | 0.0845 |
| 84875 | PARP10 | P1T-E | Human | Esophagus | ESCC | 5.20e-08 | 3.27e-01 | 0.0875 |
| 84875 | PARP10 | P2T-E | Human | Esophagus | ESCC | 2.88e-30 | 5.23e-01 | 0.1177 |
| 84875 | PARP10 | P4T-E | Human | Esophagus | ESCC | 1.78e-10 | 2.01e-01 | 0.1323 |
| 84875 | PARP10 | P5T-E | Human | Esophagus | ESCC | 1.04e-09 | 1.41e-01 | 0.1327 |
| 84875 | PARP10 | P8T-E | Human | Esophagus | ESCC | 7.32e-28 | 3.82e-01 | 0.0889 |
| 84875 | PARP10 | P9T-E | Human | Esophagus | ESCC | 4.80e-25 | 4.69e-01 | 0.1131 |
| 84875 | PARP10 | P10T-E | Human | Esophagus | ESCC | 1.34e-07 | 7.42e-02 | 0.116 |
| 84875 | PARP10 | P11T-E | Human | Esophagus | ESCC | 1.44e-21 | 6.74e-01 | 0.1426 |
| 84875 | PARP10 | P12T-E | Human | Esophagus | ESCC | 1.54e-29 | 5.48e-01 | 0.1122 |
| 84875 | PARP10 | P15T-E | Human | Esophagus | ESCC | 2.72e-24 | 4.32e-01 | 0.1149 |
| 84875 | PARP10 | P16T-E | Human | Esophagus | ESCC | 7.52e-20 | 3.01e-01 | 0.1153 |
| 84875 | PARP10 | P17T-E | Human | Esophagus | ESCC | 2.26e-13 | 4.35e-01 | 0.1278 |
| 84875 | PARP10 | P19T-E | Human | Esophagus | ESCC | 3.75e-07 | 4.13e-01 | 0.1662 |
| Page: 1 2 3 4 5 |
| Tissue | Expression Dynamics | Abbreviation |
| Esophagus |  | ESCC: Esophageal squamous cell carcinoma |
| HGIN: High-grade intraepithelial neoplasias | ||
| LGIN: Low-grade intraepithelial neoplasias | ||
| Liver | 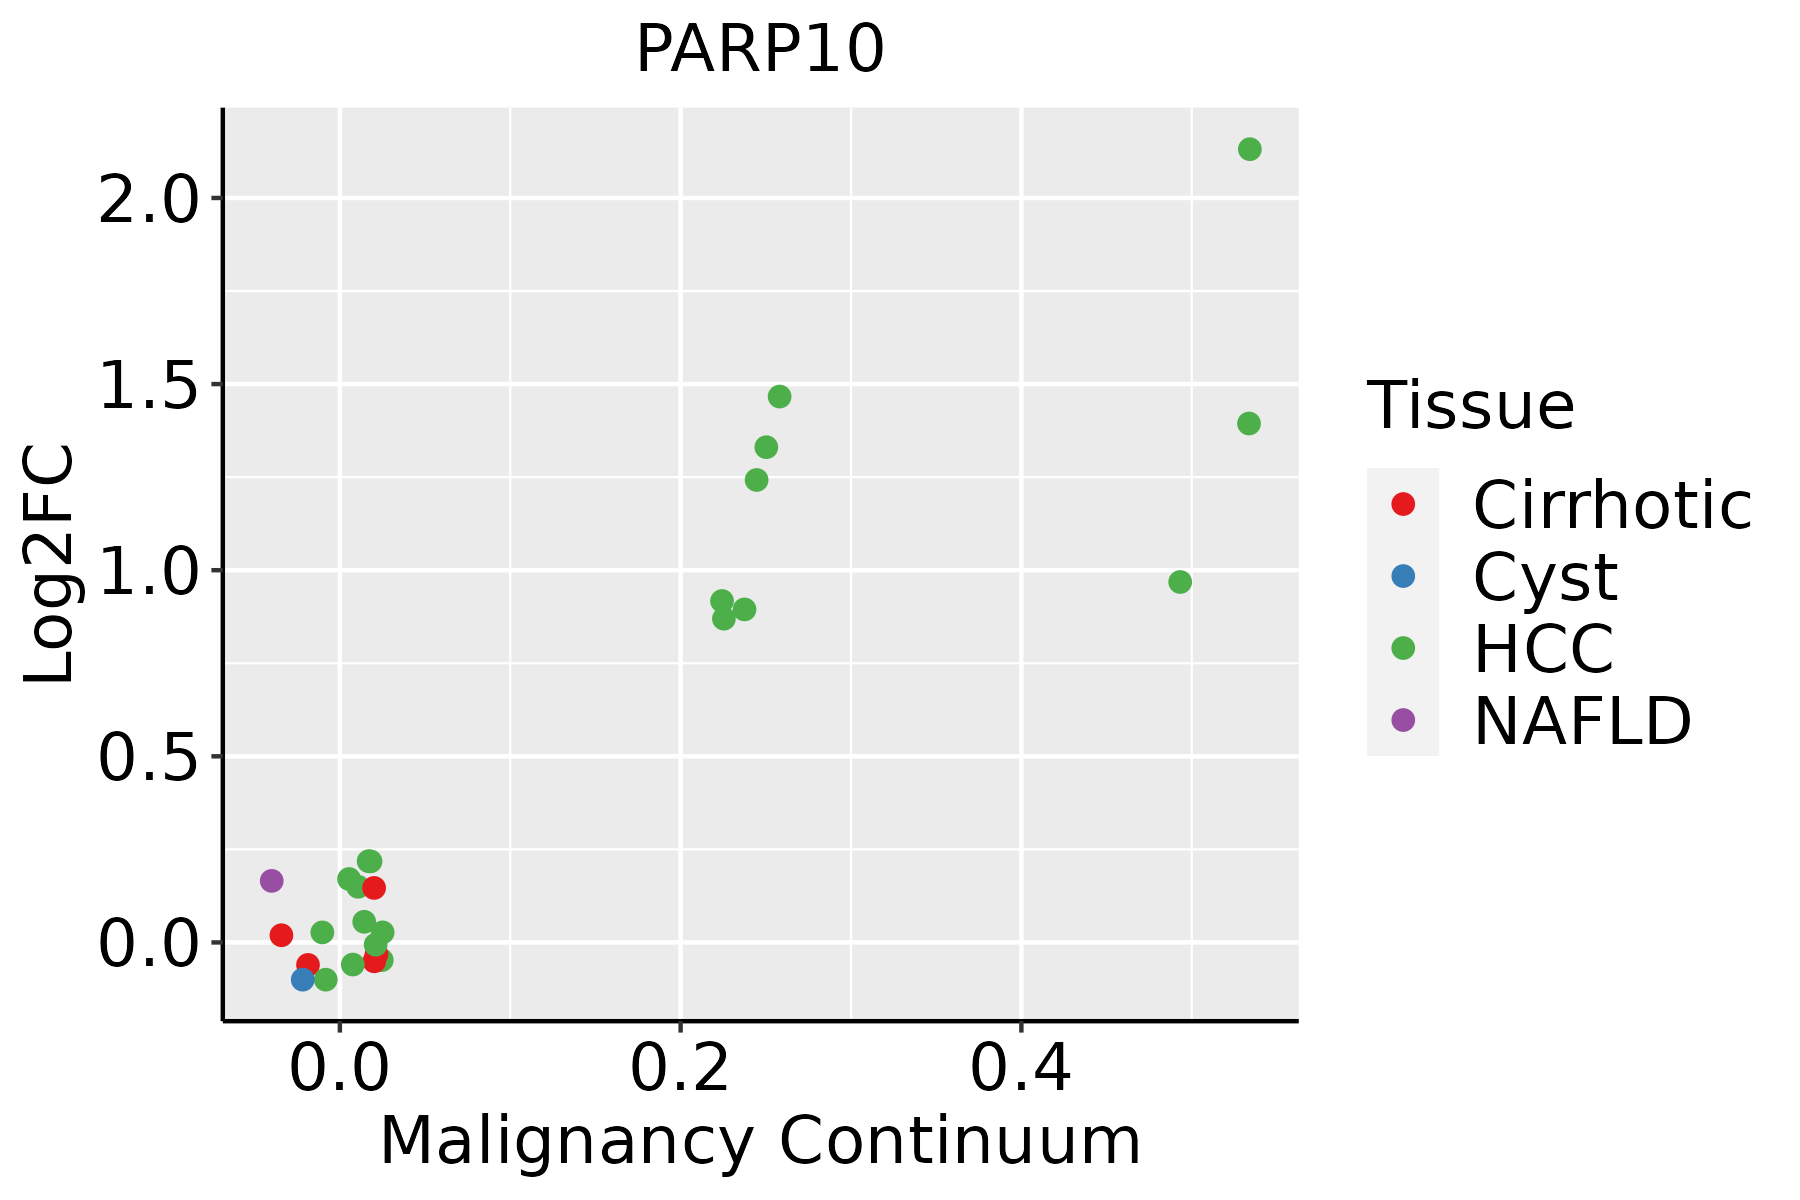 | HCC: Hepatocellular carcinoma |
| NAFLD: Non-alcoholic fatty liver disease | ||
| Oral Cavity |  | EOLP: Erosive Oral lichen planus |
| LP: leukoplakia | ||
| NEOLP: Non-erosive oral lichen planus | ||
| OSCC: Oral squamous cell carcinoma |
| ∗log2FC in expression of this searched gene in stem-like cells from each diseased tissue sample relative to stem-like cells in normal samples in each tissue plotted against the malignancy continuum. Samples are colored based on if they are from different disease stage. |
Top |
Malignant transformation related pathway analysis |
| Find out the enriched GO biological processes and KEGG pathways involved in transition from healthy to precancer to cancer |
| Tissue | Disease Stage | Enriched GO biological Processes |
| Colorectum | AD |  |
| Colorectum | SER |  |
| Colorectum | MSS |  |
| Colorectum | MSI-H |  |
| Colorectum | FAP |  |
| ∗Top 15 enriched GO BP terms are showed in the bar plot of each disease state in each tissue. Each row represents a significant GO biological process which is colored according to the -log10(p.adjust). |
| Page: 1 2 3 4 5 6 7 8 9 |
| GO ID | Tissue | Disease Stage | Description | Gene Ratio | Bg Ratio | pvalue | p.adjust | Count |
| GO:0016032111 | Esophagus | ESCC | viral process | 301/8552 | 415/18723 | 3.34e-29 | 1.32e-26 | 301 |
| GO:0019058111 | Esophagus | ESCC | viral life cycle | 226/8552 | 317/18723 | 1.17e-20 | 1.76e-18 | 226 |
| GO:1903320111 | Esophagus | ESCC | regulation of protein modification by small protein conjugation or removal | 181/8552 | 242/18723 | 1.80e-20 | 2.60e-18 | 181 |
| GO:000020917 | Esophagus | ESCC | protein polyubiquitination | 170/8552 | 236/18723 | 1.40e-16 | 1.09e-14 | 170 |
| GO:0031396111 | Esophagus | ESCC | regulation of protein ubiquitination | 154/8552 | 210/18723 | 2.70e-16 | 2.04e-14 | 154 |
| GO:001908017 | Esophagus | ESCC | viral gene expression | 80/8552 | 94/18723 | 2.04e-15 | 1.28e-13 | 80 |
| GO:0019079111 | Esophagus | ESCC | viral genome replication | 102/8552 | 131/18723 | 4.31e-14 | 2.19e-12 | 102 |
| GO:0050792111 | Esophagus | ESCC | regulation of viral process | 119/8552 | 164/18723 | 2.19e-12 | 9.03e-11 | 119 |
| GO:007189716 | Esophagus | ESCC | DNA biosynthetic process | 127/8552 | 180/18723 | 1.04e-11 | 3.85e-10 | 127 |
| GO:1903900111 | Esophagus | ESCC | regulation of viral life cycle | 106/8552 | 148/18723 | 1.26e-10 | 3.72e-09 | 106 |
| GO:0045069110 | Esophagus | ESCC | regulation of viral genome replication | 67/8552 | 85/18723 | 3.81e-10 | 1.04e-08 | 67 |
| GO:0006753110 | Esophagus | ESCC | nucleoside phosphate metabolic process | 288/8552 | 497/18723 | 1.80e-08 | 3.50e-07 | 288 |
| GO:0031397111 | Esophagus | ESCC | negative regulation of protein ubiquitination | 63/8552 | 83/18723 | 1.87e-08 | 3.65e-07 | 63 |
| GO:0009117111 | Esophagus | ESCC | nucleotide metabolic process | 282/8552 | 489/18723 | 4.70e-08 | 8.50e-07 | 282 |
| GO:000632517 | Esophagus | ESCC | chromatin organization | 240/8552 | 409/18723 | 6.52e-08 | 1.14e-06 | 240 |
| GO:1903321111 | Esophagus | ESCC | negative regulation of protein modification by small protein conjugation or removal | 69/8552 | 95/18723 | 8.54e-08 | 1.44e-06 | 69 |
| GO:004852516 | Esophagus | ESCC | negative regulation of viral process | 66/8552 | 92/18723 | 3.49e-07 | 4.88e-06 | 66 |
| GO:004507114 | Esophagus | ESCC | negative regulation of viral genome replication | 44/8552 | 56/18723 | 4.84e-07 | 6.50e-06 | 44 |
| GO:007053413 | Esophagus | ESCC | protein K63-linked ubiquitination | 44/8552 | 56/18723 | 4.84e-07 | 6.50e-06 | 44 |
| GO:00510908 | Esophagus | ESCC | regulation of DNA-binding transcription factor activity | 252/8552 | 440/18723 | 5.22e-07 | 6.97e-06 | 252 |
| Page: 1 2 3 4 5 6 7 |
| Pathway ID | Tissue | Disease Stage | Description | Gene Ratio | Bg Ratio | pvalue | p.adjust | qvalue | Count |
| Page: 1 |
Top |
Cell-cell communication analysis |
| Identification of potential cell-cell interactions between two cell types and their ligand-receptor pairs for different disease states |
| Ligand | Receptor | LRpair | Pathway | Tissue | Disease Stage |
| Page: 1 |
Top |
Single-cell gene regulatory network inference analysis |
| Find out the significant the regulons (TFs) and the target genes of each regulon across cell types for different disease states |
| TF | Cell Type | Tissue | Disease Stage | Target Gene | RSS | Regulon Activity |
| ∗The dot plots of a searched regulon are shown for all cell subpopulations in each disease state of each tissue based on the regulon specific score inferred using pySCENIC and by calculating the average expression. |
| Page: 1 |
Top |
Somatic mutation of malignant transformation related genes |
| Annotation of somatic variants for genes involved in malignant transformation |
| Hugo Symbol | Variant Class | Variant Classification | dbSNP RS | HGVSc | HGVSp | HGVSp Short | SWISSPROT | BIOTYPE | SIFT | PolyPhen | Tumor Sample Barcode | Tissue | Histology | Sex | Age | Stage | Therapy Types | Drugs | Outcome |
| PARP10 | SNV | Missense_Mutation | novel | c.1092G>A | p.Met364Ile | p.M364I | protein_coding | tolerated(0.5) | benign(0.003) | TCGA-AC-A6IW-01 | Breast | breast invasive carcinoma | Female | >=65 | I/II | Unknown | Unknown | SD | |
| PARP10 | SNV | Missense_Mutation | novel | c.2207G>T | p.Arg736Leu | p.R736L | protein_coding | tolerated(0.08) | benign(0.072) | TCGA-AQ-A54N-01 | Breast | breast invasive carcinoma | Female | <65 | I/II | Unknown | Unknown | SD | |
| PARP10 | SNV | Missense_Mutation | novel | c.1847N>C | p.Gly616Ala | p.G616A | protein_coding | tolerated(0.12) | benign(0.042) | TCGA-BH-A0BP-01 | Breast | breast invasive carcinoma | Female | >=65 | I/II | Unknown | Unknown | SD | |
| PARP10 | SNV | Missense_Mutation | novel | c.2947N>A | p.Val983Met | p.V983M | protein_coding | tolerated(0.24) | benign(0.285) | TCGA-2W-A8YY-01 | Cervix | cervical & endocervical cancer | Female | <65 | I/II | Chemotherapy | cisplatin | CR | |
| PARP10 | SNV | Missense_Mutation | rs782279171 | c.2075N>A | p.Arg692Gln | p.R692Q | protein_coding | tolerated(1) | benign(0) | TCGA-2W-A8YY-01 | Cervix | cervical & endocervical cancer | Female | <65 | I/II | Chemotherapy | cisplatin | CR | |
| PARP10 | SNV | Missense_Mutation | rs782036506 | c.626N>A | p.Arg209His | p.R209H | protein_coding | deleterious(0) | probably_damaging(0.929) | TCGA-2W-A8YY-01 | Cervix | cervical & endocervical cancer | Female | <65 | I/II | Chemotherapy | cisplatin | CR | |
| PARP10 | SNV | Missense_Mutation | novel | c.2667N>T | p.Glu889Asp | p.E889D | protein_coding | tolerated(0.42) | benign(0) | TCGA-DS-A1OD-01 | Cervix | cervical & endocervical cancer | Female | <65 | I/II | Chemotherapy | cisplatin | SD | |
| PARP10 | SNV | Missense_Mutation | rs782213808 | c.2665N>C | p.Glu889Gln | p.E889Q | protein_coding | tolerated(0.46) | benign(0.011) | TCGA-DS-A1OD-01 | Cervix | cervical & endocervical cancer | Female | <65 | I/II | Chemotherapy | cisplatin | SD | |
| PARP10 | SNV | Missense_Mutation | c.3068N>T | p.Ser1023Phe | p.S1023F | protein_coding | deleterious(0.04) | benign(0.316) | TCGA-IR-A3LK-01 | Cervix | cervical & endocervical cancer | Female | >=65 | I/II | Chemotherapy | cisplatin | PD | ||
| PARP10 | SNV | Missense_Mutation | novel | c.487N>A | p.Glu163Lys | p.E163K | protein_coding | tolerated(0.5) | benign(0.007) | TCGA-VS-A952-01 | Cervix | cervical & endocervical cancer | Female | >=65 | I/II | Unknown | Unknown | SD |
| Page: 1 2 3 4 5 6 7 8 9 |
Top |
Related drugs of malignant transformation related genes |
| Identification of chemicals and drugs interact with genes involved in malignant transfromation |
| (DGIdb 4.0) |
| Entrez ID | Symbol | Category | Interaction Types | Drug Claim Name | Drug Name | PMIDs |
| Page: 1 |

Copyright 2023-Present -The University of Texas Health Science Center at Houston |