Schematic overview of the cellular and molecular mechanisms involved in the cancer progression, including the proposed cellular and molecular mechanisms in cancer cells trajectory. AT1: alveolar type 1 cells; AT2: alveolar type 2 cells; AAH: atypical adenomatous hyperplasia; AIS: adenocarcinoma in situ; MIA: minimally invasive adenocarcinoma; IA: invasive adenocarcinoma; EMT: epithelial-mesenchymal transition

Home

Download

Statistics

Help

Contact

Center for Computational Systems Medicine
leaf

Gene summary

leaf

Malignant transformation analysis

leaf

Malignant transformation related pathway analysis

leaf

Cell-cell communication analysis

leaf

Single-cell gene regulatory network inference analysis

leaf

Somatic mutation of malignant transformation related genes

leaf

Related drugs of malignant transformation related genes

Gene: PARP1

Gene summary for PARP1

check button Gene summary.

Gene informationSpeciesHuman
Gene symbol

PARP1

Gene ID

142

Gene namepoly(ADP-ribose) polymerase 1
Gene AliasADPRT
Cytomap1q42.12
Gene Typeprotein-coding
GO ID

GO:0000002

UniProtAcc

A0A024R3T8


Top

Malignant transformation analysis

check button Identification of the aberrant gene expression in precancerous and cancerous lesions by comparing the gene expression of stem-like cells in diseased tissues with normal stem cells
check button Malignant transformation involving gene list.
Entrez IDSymbolReplicatesSpeciesOrganTissueAdj P-valueLog2FCMalignancy
142PARP1GSM4909281HumanBreastIDC7.32e-184.57e-010.21
142PARP1GSM4909282HumanBreastIDC8.79e-042.75e-01-0.0288
142PARP1GSM4909285HumanBreastIDC1.48e-376.11e-010.21
142PARP1GSM4909286HumanBreastIDC6.97e-133.28e-010.1081
142PARP1GSM4909287HumanBreastIDC1.27e-043.52e-010.2057
142PARP1GSM4909290HumanBreastIDC3.16e-043.44e-010.2096
142PARP1GSM4909293HumanBreastIDC2.71e-406.55e-010.1581
142PARP1GSM4909298HumanBreastIDC3.17e-082.63e-010.1551
142PARP1GSM4909301HumanBreastIDC1.67e-022.40e-010.1577
142PARP1GSM4909306HumanBreastIDC5.53e-143.82e-010.1564
142PARP1GSM4909307HumanBreastIDC3.77e-154.99e-010.1569
142PARP1GSM4909308HumanBreastIDC4.28e-256.54e-010.158
142PARP1GSM4909311HumanBreastIDC4.76e-07-8.56e-020.1534
142PARP1GSM4909317HumanBreastIDC2.37e-022.31e-010.1355
142PARP1GSM4909319HumanBreastIDC1.39e-261.94e-010.1563
142PARP1brca2HumanBreastPrecancer2.79e-082.01e-01-0.024
142PARP1brca3HumanBreastPrecancer6.18e-042.33e-01-0.0263
142PARP1M2HumanBreastIDC3.08e-117.43e-010.21
142PARP1NCCBC14HumanBreastDCIS4.43e-227.15e-010.2021
142PARP1NCCBC3HumanBreastDCIS4.66e-032.62e-010.1198
Page: 1 2 3 4 5 6 7 8 9 

check button Transcriptomic changes along malignancy continuum.
TissueExpression DynamicsAbbreviation
BreastThe image shows the transcriptomic changes along malignancy continuum.log2FC in expression of this searched gene in stem-like cells from each diseased tissue sample relative to stem-like cells in normal samples in each tissue plotted against the malignancy continuum. Samples are colored based on if they are from different disease stage.
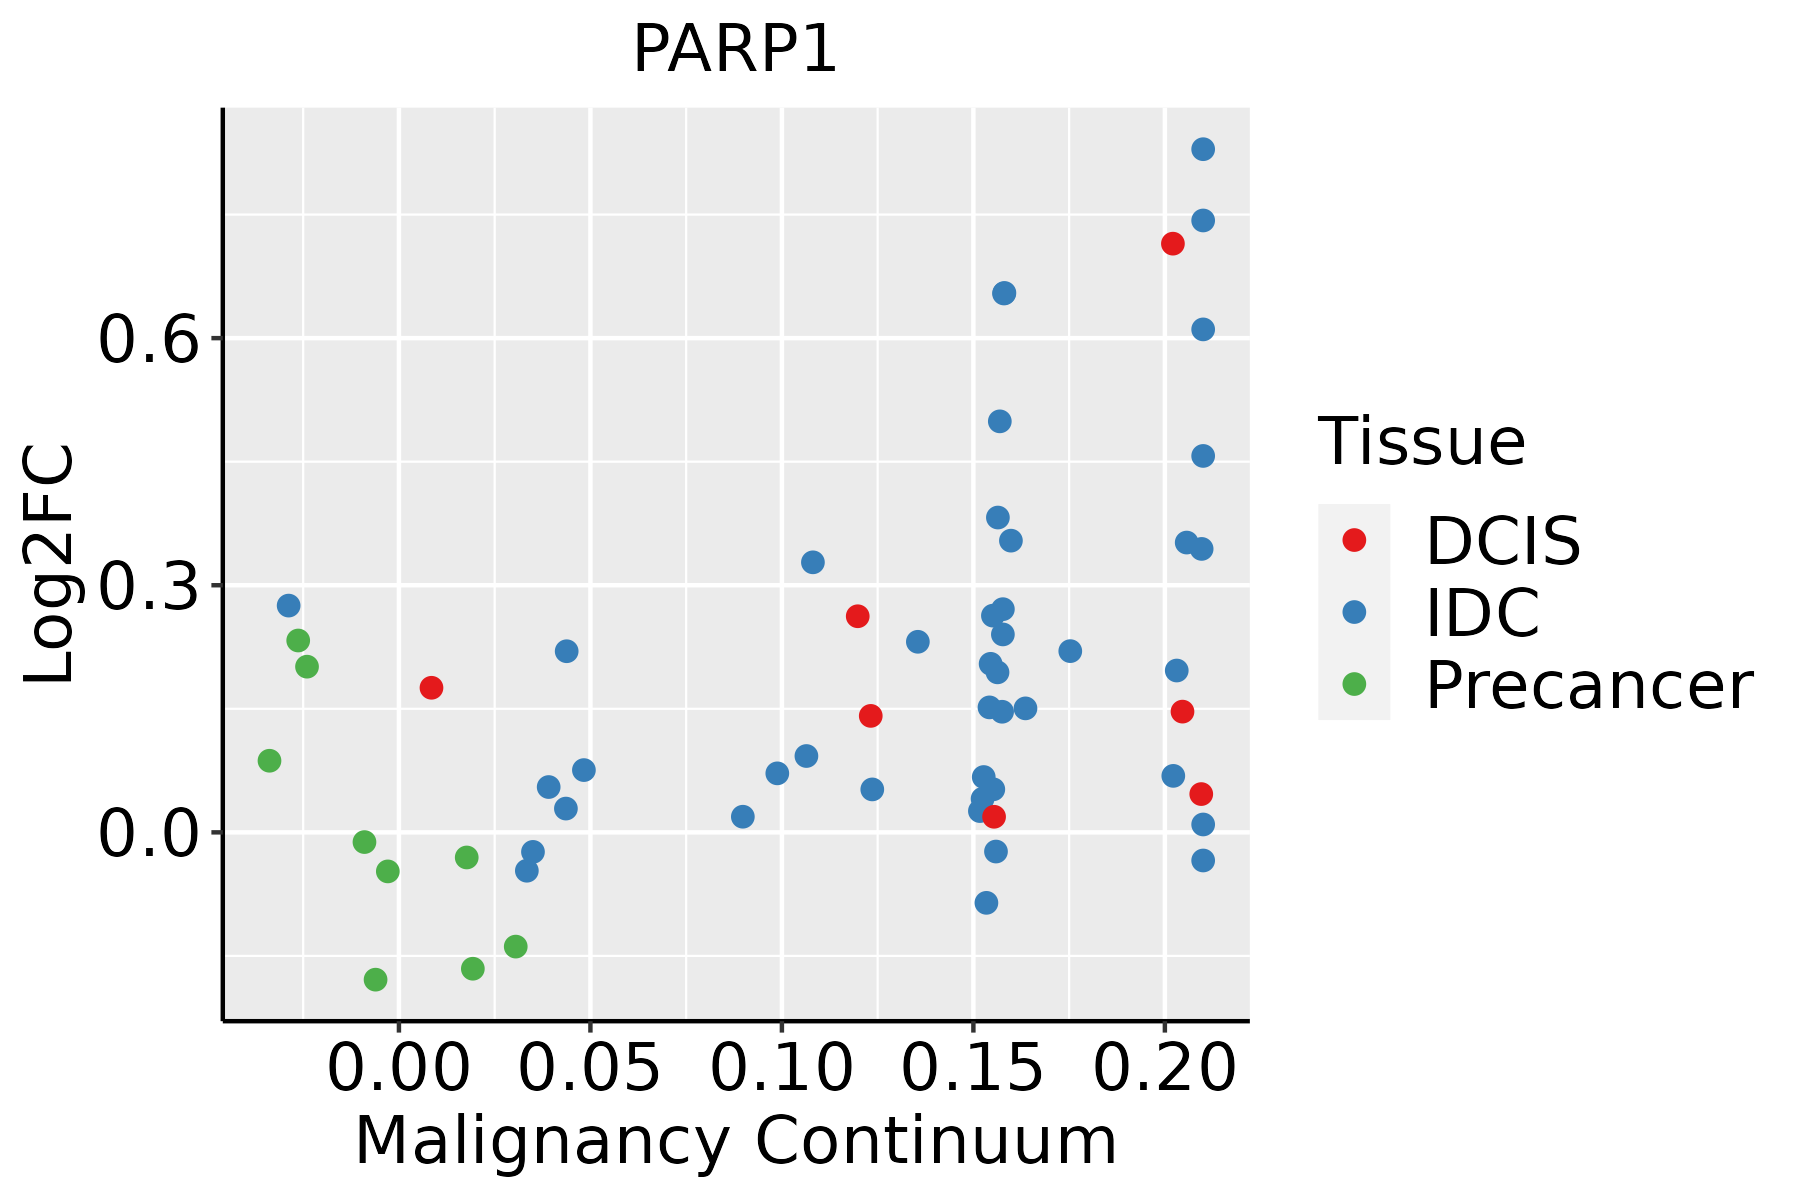
IDC: Invasive ductal carcinoma
DCIS: Ductal carcinoma in situ
Precancer(BRCA1-mut): Precancerous lesion from BRCA1 mutation carriers
Colorectum (GSE201348)The image shows the transcriptomic changes along malignancy continuum.log2FC in expression of this searched gene in stem-like cells from each diseased tissue sample relative to stem-like cells in normal samples in each tissue plotted against the malignancy continuum. Samples are colored based on if they are from different disease stage.FAP: Familial adenomatous polyposis
CRC: Colorectal cancer
Colorectum (HTA11)The image shows the transcriptomic changes along malignancy continuum.log2FC in expression of this searched gene in stem-like cells from each diseased tissue sample relative to stem-like cells in normal samples in each tissue plotted against the malignancy continuum. Samples are colored based on if they are from different disease stage.AD: Adenomas
SER: Sessile serrated lesions
MSI-H: Microsatellite-high colorectal cancer
MSS: Microsatellite stable colorectal cancer
EsophagusThe image shows the transcriptomic changes along malignancy continuum.log2FC in expression of this searched gene in stem-like cells from each diseased tissue sample relative to stem-like cells in normal samples in each tissue plotted against the malignancy continuum. Samples are colored based on if they are from different disease stage.
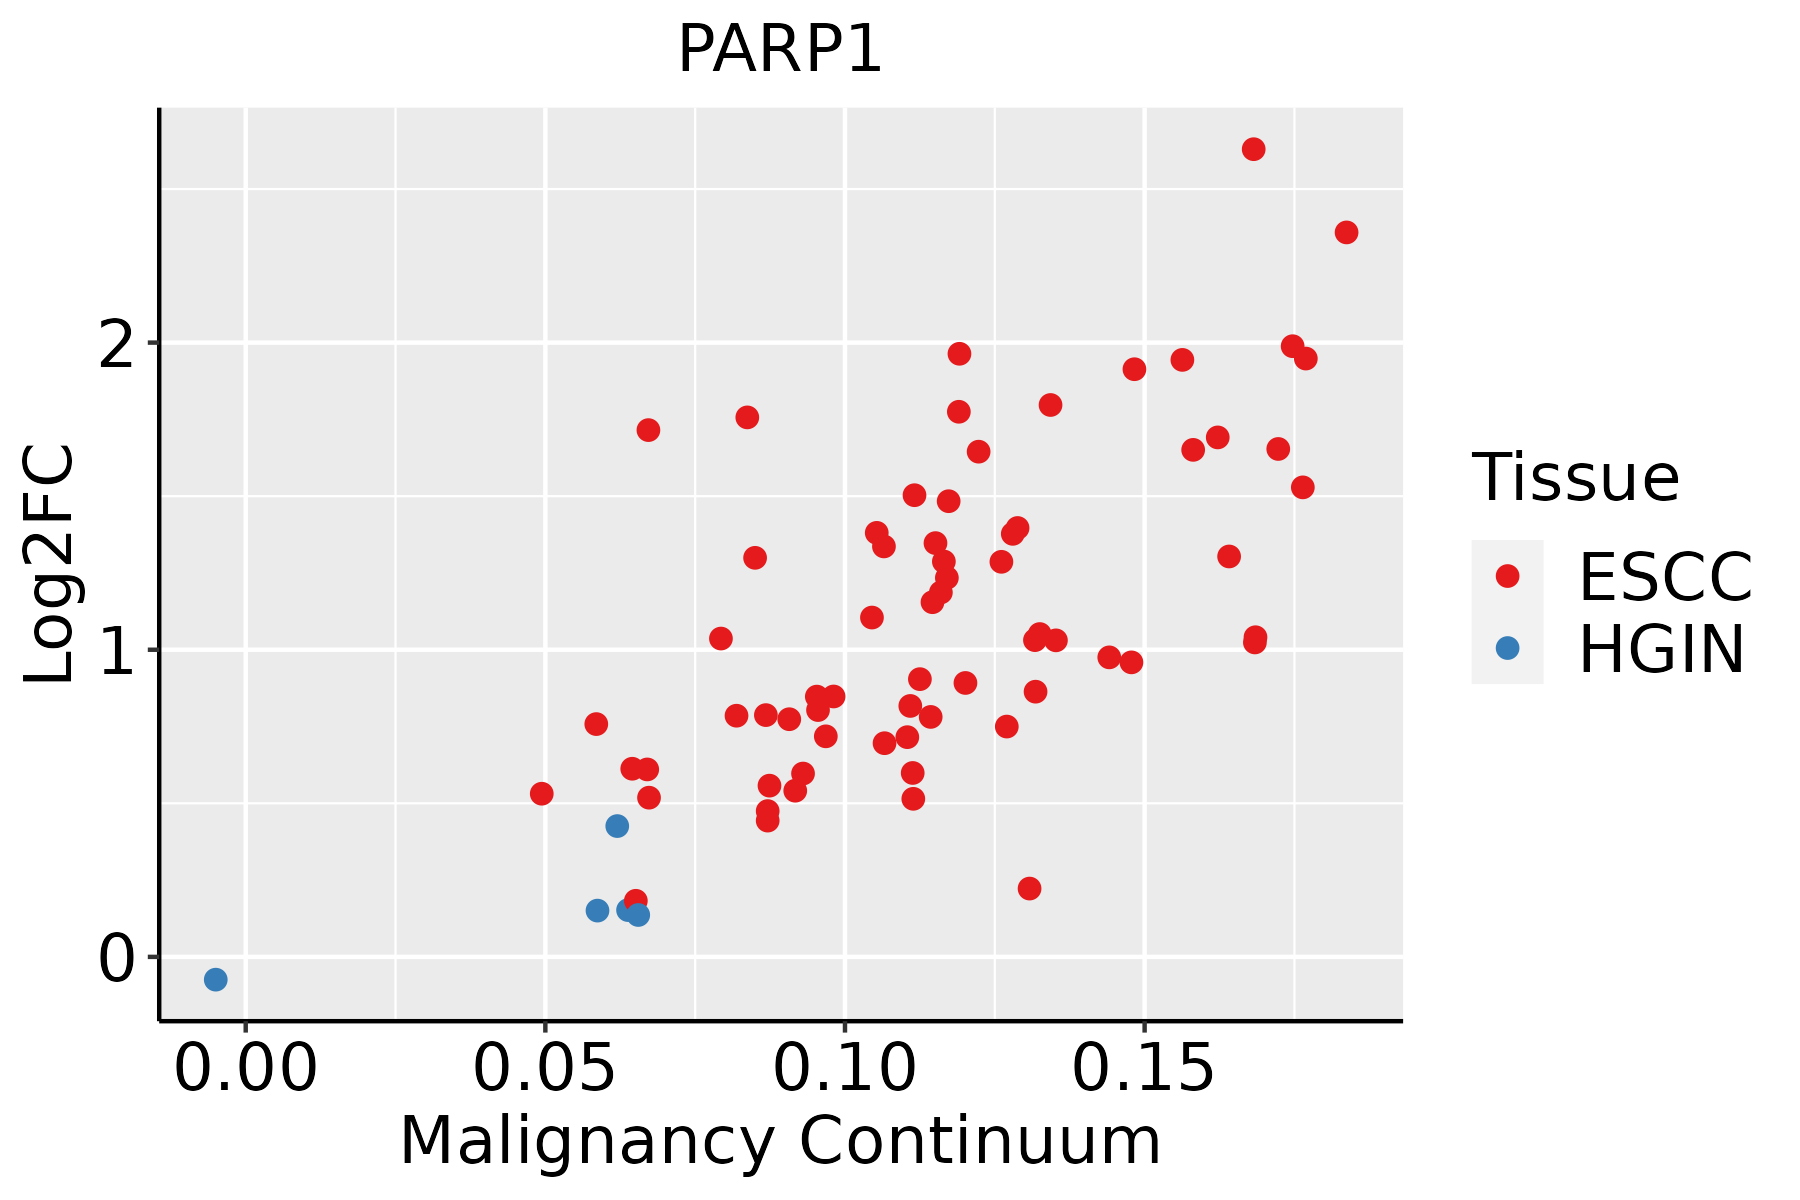
ESCC: Esophageal squamous cell carcinoma
HGIN: High-grade intraepithelial neoplasias
LGIN: Low-grade intraepithelial neoplasias
LiverThe image shows the transcriptomic changes along malignancy continuum.log2FC in expression of this searched gene in stem-like cells from each diseased tissue sample relative to stem-like cells in normal samples in each tissue plotted against the malignancy continuum. Samples are colored based on if they are from different disease stage.HCC: Hepatocellular carcinoma
NAFLD: Non-alcoholic fatty liver disease
Oral CavityThe image shows the transcriptomic changes along malignancy continuum.log2FC in expression of this searched gene in stem-like cells from each diseased tissue sample relative to stem-like cells in normal samples in each tissue plotted against the malignancy continuum. Samples are colored based on if they are from different disease stage.
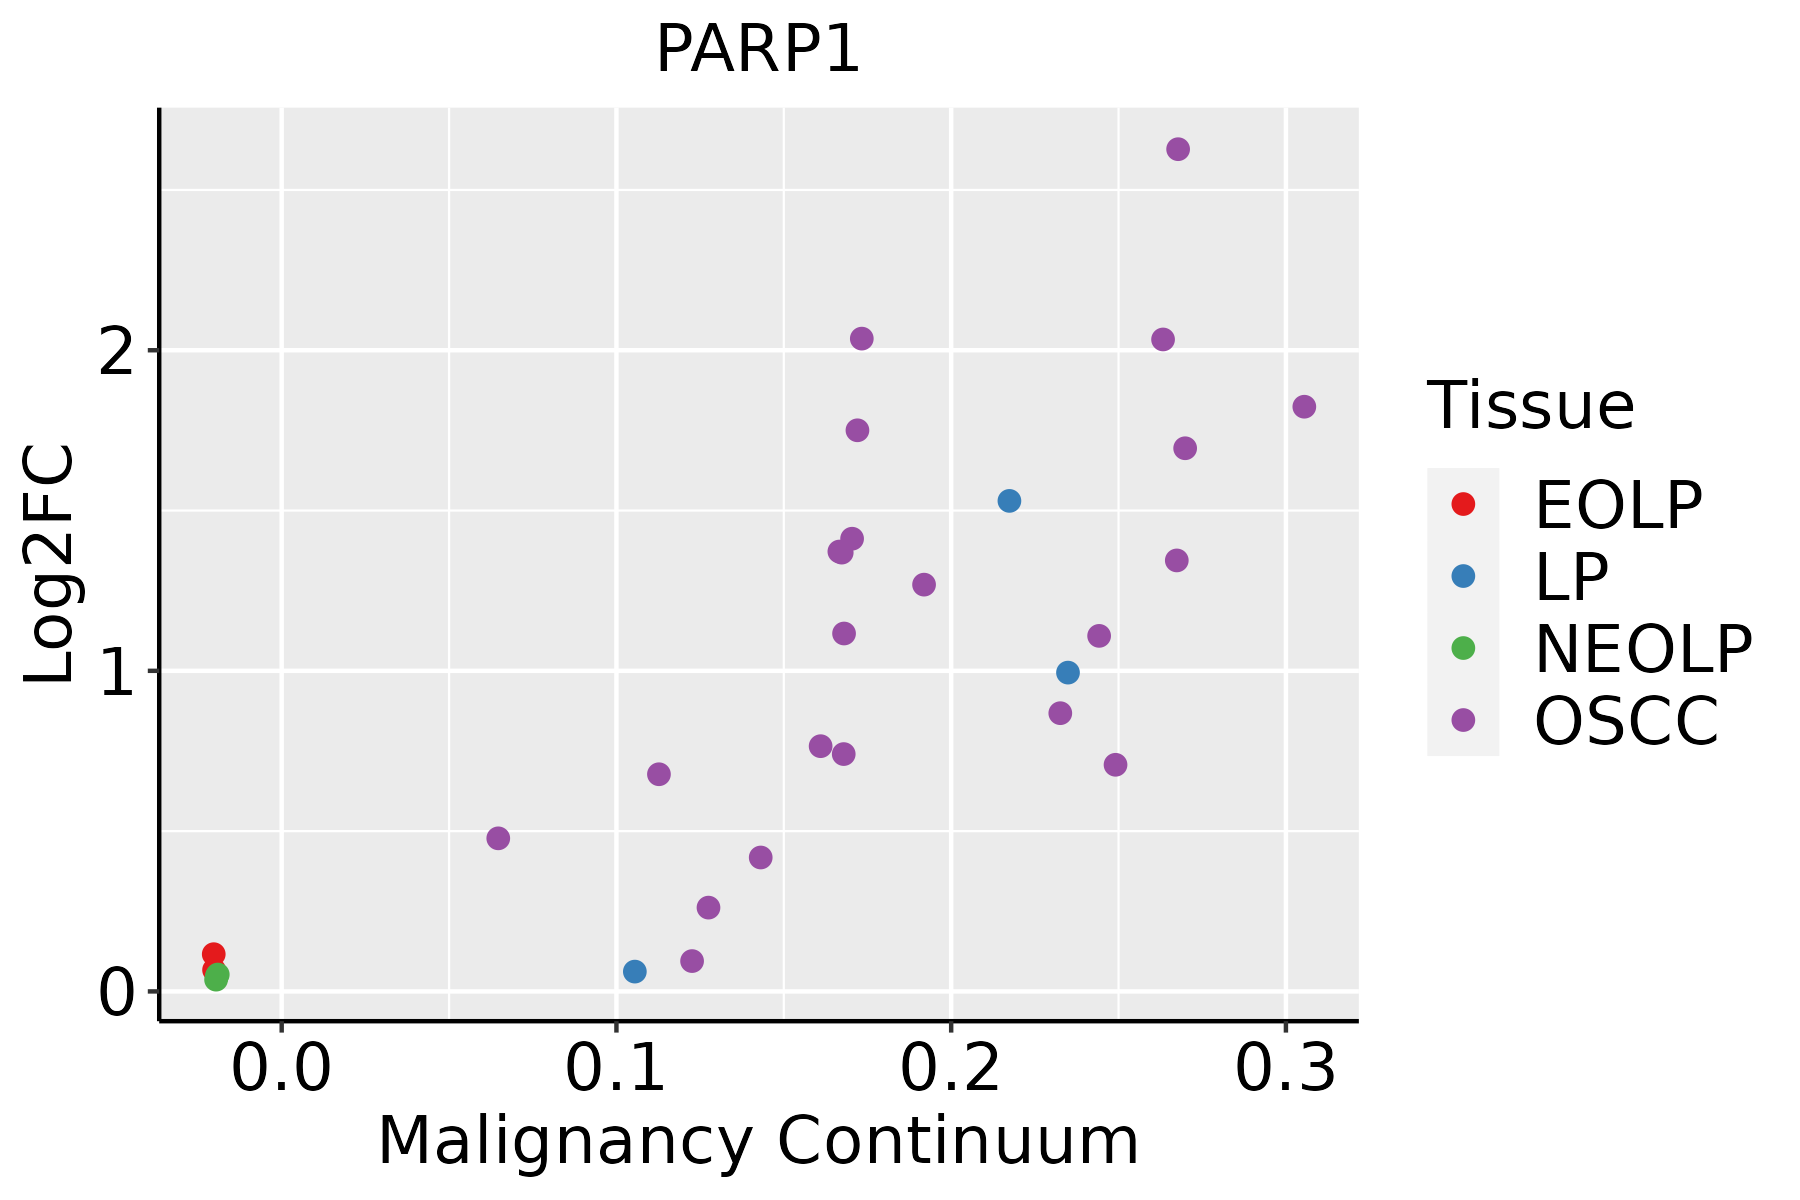
EOLP: Erosive Oral lichen planus
LP: leukoplakia
NEOLP: Non-erosive oral lichen planus
OSCC: Oral squamous cell carcinoma
ProstateThe image shows the transcriptomic changes along malignancy continuum.log2FC in expression of this searched gene in stem-like cells from each diseased tissue sample relative to stem-like cells in normal samples in each tissue plotted against the malignancy continuum. Samples are colored based on if they are from different disease stage.BPH: Benign Prostatic Hyperplasia
SkinThe image shows the transcriptomic changes along malignancy continuum.log2FC in expression of this searched gene in stem-like cells from each diseased tissue sample relative to stem-like cells in normal samples in each tissue plotted against the malignancy continuum. Samples are colored based on if they are from different disease stage.AK: Actinic keratosis
cSCC: Cutaneous squamous cell carcinoma
SCCIS:squamous cell carcinoma in situ
ThyroidThe image shows the transcriptomic changes along malignancy continuum.log2FC in expression of this searched gene in stem-like cells from each diseased tissue sample relative to stem-like cells in normal samples in each tissue plotted against the malignancy continuum. Samples are colored based on if they are from different disease stage.
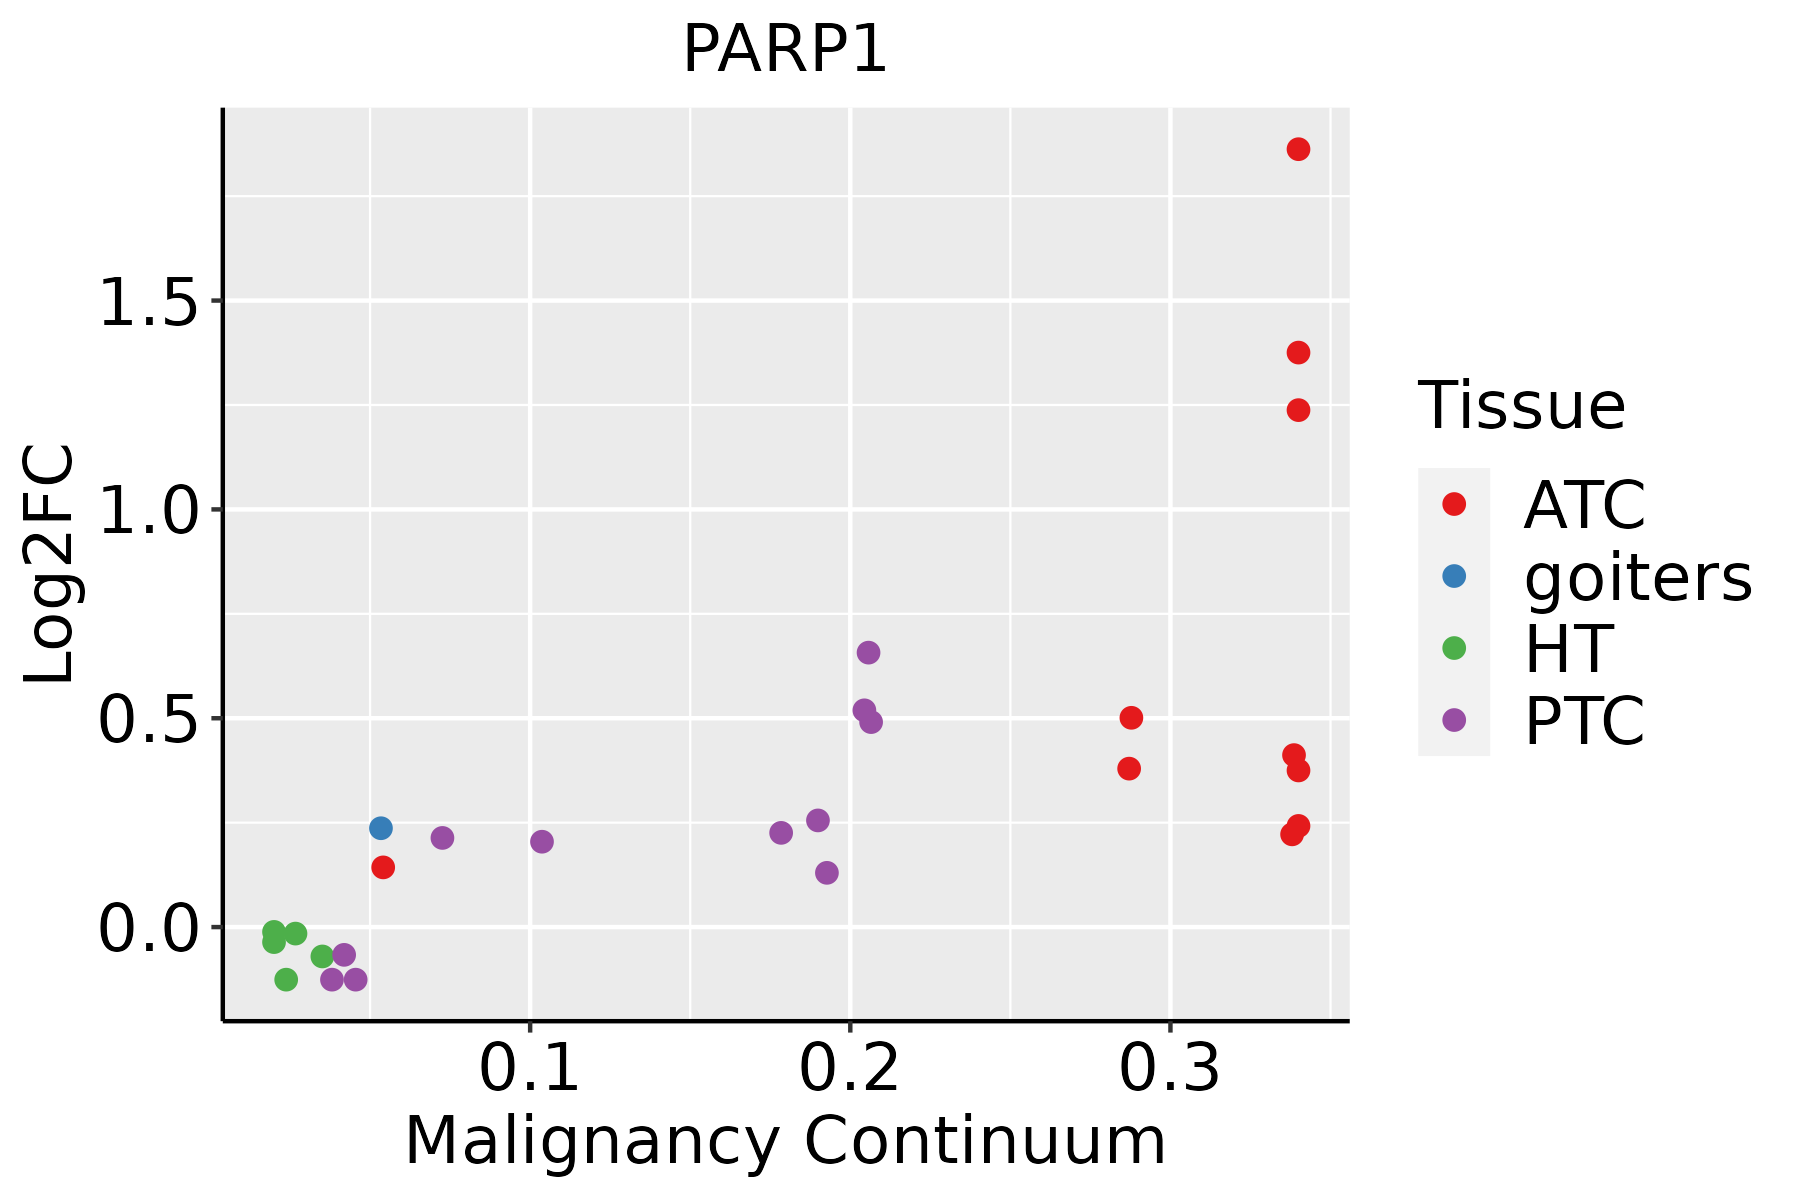
ATC: Anaplastic thyroid cancer
HT: Hashimoto's thyroiditis
PTC: Papillary thyroid cancer
∗log2FC in expression of this searched gene in stem-like cells from each diseased tissue sample relative to stem-like cells in normal samples in each tissue plotted against the malignancy continuum. Samples are colored based on if they are from different disease stage.

Top

Malignant transformation related pathway analysis

check buttonFind out the enriched GO biological processes and KEGG pathways involved in transition from healthy to precancer to cancer
check button Figure of enriched GO biological processes.
TissueDisease StageEnriched GO biological Processes
ColorectumADGO analysis - Figure of enriched GO biological processes: Top 15 enriched GO BP terms are showed in the bar plot of each disease state in each tissue. Each row represents a significant GO biological process which is colored according to the -log10(p.adjust).
ColorectumSERGO analysis - Figure of enriched GO biological processes: Top 15 enriched GO BP terms are showed in the bar plot of each disease state in each tissue. Each row represents a significant GO biological process which is colored according to the -log10(p.adjust).
ColorectumMSSGO analysis - Figure of enriched GO biological processes: Top 15 enriched GO BP terms are showed in the bar plot of each disease state in each tissue. Each row represents a significant GO biological process which is colored according to the -log10(p.adjust).
ColorectumMSI-HGO analysis - Figure of enriched GO biological processes: Top 15 enriched GO BP terms are showed in the bar plot of each disease state in each tissue. Each row represents a significant GO biological process which is colored according to the -log10(p.adjust).
ColorectumFAPGO analysis - Figure of enriched GO biological processes: Top 15 enriched GO BP terms are showed in the bar plot of each disease state in each tissue. Each row represents a significant GO biological process which is colored according to the -log10(p.adjust).
∗Top 15 enriched GO BP terms are showed in the bar plot of each disease state in each tissue. Each row represents a significant GO biological process which is colored according to the -log10(p.adjust).
Page: 1 2 3 4 5 6 7 8 9 

check button Enriched GO biological processes.
GO IDTissueDisease StageDescriptionGene RatioBg Ratiopvaluep.adjustCount
GO:00460349BreastPrecancerATP metabolic process82/1080277/187231.94e-365.19e-3382
GO:00971939BreastPrecancerintrinsic apoptotic signaling pathway59/1080288/187238.07e-183.60e-1559
GO:20012339BreastPrecancerregulation of apoptotic signaling pathway65/1080356/187237.70e-173.17e-1465
GO:20012429BreastPrecancerregulation of intrinsic apoptotic signaling pathway41/1080164/187236.48e-162.31e-1341
GO:00069799BreastPrecancerresponse to oxidative stress70/1080446/187231.59e-144.26e-1270
GO:00067547BreastPrecancerATP biosynthetic process21/108057/187232.31e-124.26e-1021
GO:00092067BreastPrecancerpurine ribonucleoside triphosphate biosynthetic process22/108068/187231.41e-111.88e-0922
GO:00091457BreastPrecancerpurine nucleoside triphosphate biosynthetic process22/108069/187231.95e-112.43e-0922
GO:00485459BreastPrecancerresponse to steroid hormone53/1080339/187233.07e-113.66e-0953
GO:00092017BreastPrecancerribonucleoside triphosphate biosynthetic process22/108074/187239.18e-111.00e-0822
GO:00091448BreastPrecancerpurine nucleoside triphosphate metabolic process24/108088/187239.66e-111.03e-0824
GO:00092057BreastPrecancerpurine ribonucleoside triphosphate metabolic process23/108082/187231.27e-101.34e-0823
GO:00621979BreastPrecancercellular response to chemical stress51/1080337/187232.40e-102.34e-0851
GO:00091427BreastPrecancernucleoside triphosphate biosynthetic process23/108085/187232.82e-102.69e-0823
GO:00091997BreastPrecancerribonucleoside triphosphate metabolic process23/108089/187237.65e-106.66e-0823
GO:00091418BreastPrecancernucleoside triphosphate metabolic process26/1080112/187237.72e-106.66e-0826
GO:00709979BreastPrecancerneuron death50/1080361/187237.75e-095.70e-0750
GO:00319608BreastPrecancerresponse to corticosteroid30/1080167/187232.50e-081.65e-0630
GO:00514029BreastPrecancerneuron apoptotic process38/1080246/187232.68e-081.75e-0638
GO:00345999BreastPrecancercellular response to oxidative stress42/1080288/187232.78e-081.79e-0642
Page: 1 2 3 4 5 6 7 8 9 10 11 12 13 14 15 16 17 18 19 20 21 22 23 24 25 26 27 28 29 30 31 32 33 34 35 36 37 38 39 40 41 42 43 44 45 46 47 48 49 50 51 52 53 54 55 56 57 58 59 60 61 62 63 64 65 66 67 68 69 70 71 72 73 74 75 76 77 78 79 80 81 82 83 84 85 86 87 88 89 90 91 92 93 94 95 96 97 98 99 100 101 102 103 104 105 106 107 

check button Enriched KEGG pathways.
Pathway IDTissueDisease StageDescriptionGene RatioBg Ratiopvaluep.adjustqvalueCount
hsa0541518BreastPrecancerDiabetic cardiomyopathy63/684203/84655.63e-221.48e-201.14e-2063
hsa042108BreastPrecancerApoptosis25/684136/84657.61e-056.87e-045.26e-0425
hsa0541519BreastPrecancerDiabetic cardiomyopathy63/684203/84655.63e-221.48e-201.14e-2063
hsa0421013BreastPrecancerApoptosis25/684136/84657.61e-056.87e-045.26e-0425
hsa0541523BreastIDCDiabetic cardiomyopathy67/867203/84653.17e-198.59e-186.43e-1867
hsa0421022BreastIDCApoptosis31/867136/84651.34e-051.61e-041.20e-0431
hsa0541533BreastIDCDiabetic cardiomyopathy67/867203/84653.17e-198.59e-186.43e-1867
hsa0421032BreastIDCApoptosis31/867136/84651.34e-051.61e-041.20e-0431
hsa0541543BreastDCISDiabetic cardiomyopathy65/846203/84651.81e-184.87e-173.59e-1765
hsa0421041BreastDCISApoptosis29/846136/84655.92e-055.97e-044.40e-0429
hsa0541553BreastDCISDiabetic cardiomyopathy65/846203/84651.81e-184.87e-173.59e-1765
hsa0421051BreastDCISApoptosis29/846136/84655.92e-055.97e-044.40e-0429
hsa05415ColorectumADDiabetic cardiomyopathy114/2092203/84653.65e-223.06e-201.95e-20114
hsa054151ColorectumADDiabetic cardiomyopathy114/2092203/84653.65e-223.06e-201.95e-20114
hsa054152ColorectumSERDiabetic cardiomyopathy103/1580203/84651.45e-251.61e-231.17e-23103
hsa054153ColorectumSERDiabetic cardiomyopathy103/1580203/84651.45e-251.61e-231.17e-23103
hsa054154ColorectumMSSDiabetic cardiomyopathy106/1875203/84652.47e-211.62e-199.92e-20106
hsa04210ColorectumMSSApoptosis44/1875136/84653.66e-031.66e-021.01e-0244
hsa054155ColorectumMSSDiabetic cardiomyopathy106/1875203/84652.47e-211.62e-199.92e-20106
hsa042101ColorectumMSSApoptosis44/1875136/84653.66e-031.66e-021.01e-0244
Page: 1 2 3 4 

Top

Cell-cell communication analysis

check buttonIdentification of potential cell-cell interactions between two cell types and their ligand-receptor pairs for different disease states
LigandReceptorLRpairPathwayTissueDisease Stage
Page: 1 

Top

Single-cell gene regulatory network inference analysis

check buttonFind out the significant the regulons (TFs) and the target genes of each regulon across cell types for different disease states
TFCell TypeTissueDisease StageTarget GeneRSSRegulon Activity
PARP1BASLungHealthyTM4SF1,KRT19,C3, etc.1.00e-01The dot plots of a searched regulon are shown for all cell subpopulations in each disease state of each tissue based on the regulon specific score inferred using pySCENIC and by calculating the average expression.
∗The dot plots of a searched regulon are shown for all cell subpopulations in each disease state of each tissue based on the regulon specific score inferred using pySCENIC and by calculating the average expression.
Page: 1 

Top

Somatic mutation of malignant transformation related genes

check buttonAnnotation of somatic variants for genes involved in malignant transformation
Hugo SymbolVariant ClassVariant ClassificationdbSNP RSHGVScHGVSpHGVSp ShortSWISSPROTBIOTYPESIFTPolyPhenTumor Sample BarcodeTissueHistologySexAgeStageTherapy TypesDrugsOutcome
PARP1SNVMissense_Mutationrs79529505c.1223N>Gp.Val408Glyp.V408GP09874protein_codingdeleterious(0)benign(0.367)TCGA-A2-A0CQ-01Breastbreast invasive carcinomaFemale<65I/IIChemotherapyadriamycinSD
PARP1SNVMissense_Mutationrs79529505c.1223N>Gp.Val408Glyp.V408GP09874protein_codingdeleterious(0)benign(0.367)TCGA-A2-A0YJ-01Breastbreast invasive carcinomaFemale<65III/IVChemotherapycytoxanPD
PARP1SNVMissense_Mutationrs377195931c.919N>Ap.Asp307Asnp.D307NP09874protein_codingtolerated(0.23)benign(0.189)TCGA-A2-A0YK-01Breastbreast invasive carcinomaFemale<65I/IIChemotherapycytoxanSD
PARP1SNVMissense_Mutationrs377195931c.919G>Ap.Asp307Asnp.D307NP09874protein_codingtolerated(0.23)benign(0.189)TCGA-A2-A25A-01Breastbreast invasive carcinomaFemale<65I/IIUnspecificCytoxanSD
PARP1SNVMissense_Mutationrs79529505c.1223N>Gp.Val408Glyp.V408GP09874protein_codingdeleterious(0)benign(0.367)TCGA-A8-A06Q-01Breastbreast invasive carcinomaFemale<65III/IVUnknownUnknownSD
PARP1SNVMissense_Mutationc.2032N>Cp.Asp678Hisp.D678HP09874protein_codingdeleterious(0)probably_damaging(0.999)TCGA-A8-A092-01Breastbreast invasive carcinomaFemale<65III/IVChemotherapypaclitaxelCR
PARP1SNVMissense_Mutationc.2524G>Ap.Glu842Lysp.E842KP09874protein_codingtolerated(0.18)benign(0.026)TCGA-AC-A23H-01Breastbreast invasive carcinomaFemale>=65I/IIUnknownUnknownPD
PARP1SNVMissense_Mutationnovelc.2971G>Cp.Val991Leup.V991LP09874protein_codingdeleterious(0.01)possibly_damaging(0.796)TCGA-AN-A046-01Breastbreast invasive carcinomaFemale>=65I/IIUnknownUnknownSD
PARP1SNVMissense_Mutationnovelc.1102A>Cp.Thr368Prop.T368PP09874protein_codingtolerated(0.29)benign(0.079)TCGA-AN-A046-01Breastbreast invasive carcinomaFemale>=65I/IIUnknownUnknownSD
PARP1SNVMissense_Mutationc.268N>Ap.Glu90Lysp.E90KP09874protein_codingtolerated(0.09)possibly_damaging(0.566)TCGA-B6-A0IJ-01Breastbreast invasive carcinomaFemale<65I/IIUnknownUnknownSD
Page: 1 2 3 4 5 6 7 8 9 10 11 12 

Top

Related drugs of malignant transformation related genes

check buttonIdentification of chemicals and drugs interact with genes involved in malignant transfromation
(DGIdb 4.0)
Entrez IDSymbolCategoryInteraction TypesDrug Claim NameDrug NamePMIDs
142PARP1ENZYME, TRANSCRIPTION FACTOR, DRUGGABLE GENOME, DNA REPAIR, TRANSCRIPTION FACTOR COMPLEX, CLINICALLY ACTIONABLE, DRUG RESISTANCEQuinazolinedione derivative 2
142PARP1ENZYME, TRANSCRIPTION FACTOR, DRUGGABLE GENOME, DNA REPAIR, TRANSCRIPTION FACTOR COMPLEX, CLINICALLY ACTIONABLE, DRUG RESISTANCEinhibitor223366069RUCAPARIB
142PARP1ENZYME, TRANSCRIPTION FACTOR, DRUGGABLE GENOME, DNA REPAIR, TRANSCRIPTION FACTOR COMPLEX, CLINICALLY ACTIONABLE, DRUG RESISTANCEinhibitorCHEMBL1094636NIRAPARIB
142PARP1ENZYME, TRANSCRIPTION FACTOR, DRUGGABLE GENOME, DNA REPAIR, TRANSCRIPTION FACTOR COMPLEX, CLINICALLY ACTIONABLE, DRUG RESISTANCE4-Carboxamido-isoindolinone derivative 2
142PARP1ENZYME, TRANSCRIPTION FACTOR, DRUGGABLE GENOME, DNA REPAIR, TRANSCRIPTION FACTOR COMPLEX, CLINICALLY ACTIONABLE, DRUG RESISTANCECC-486
142PARP1ENZYME, TRANSCRIPTION FACTOR, DRUGGABLE GENOME, DNA REPAIR, TRANSCRIPTION FACTOR COMPLEX, CLINICALLY ACTIONABLE, DRUG RESISTANCE3-oxo-2,3-dihydro-1H-indazole-4-carboxamide derivative 5
142PARP1ENZYME, TRANSCRIPTION FACTOR, DRUGGABLE GENOME, DNA REPAIR, TRANSCRIPTION FACTOR COMPLEX, CLINICALLY ACTIONABLE, DRUG RESISTANCEOLAPARIBOLAPARIB28454547,25144364,26650448
142PARP1ENZYME, TRANSCRIPTION FACTOR, DRUGGABLE GENOME, DNA REPAIR, TRANSCRIPTION FACTOR COMPLEX, CLINICALLY ACTIONABLE, DRUG RESISTANCE4-Carboxamido-isoindolinone derivative 3
142PARP1ENZYME, TRANSCRIPTION FACTOR, DRUGGABLE GENOME, DNA REPAIR, TRANSCRIPTION FACTOR COMPLEX, CLINICALLY ACTIONABLE, DRUG RESISTANCEPhthalazine ketone derivative 3
142PARP1ENZYME, TRANSCRIPTION FACTOR, DRUGGABLE GENOME, DNA REPAIR, TRANSCRIPTION FACTOR COMPLEX, CLINICALLY ACTIONABLE, DRUG RESISTANCERUCAPARIBRUCAPARIB
Page: 1 2 3 4 5 6 7 8 9