
|
|||||
|
 | |
| |
| |
| |
| |
| |
|
Gene: PARM1 |
Gene summary for PARM1 |
| Gene information | Species | Human | Gene symbol | PARM1 | Gene ID | 25849 |
| Gene name | prostate androgen-regulated mucin-like protein 1 | |
| Gene Alias | Cipar1 | |
| Cytomap | 4q13.3 | |
| Gene Type | protein-coding | GO ID | GO:0006139 | UniProtAcc | Q6UWI2 |
Top |
Malignant transformation analysis |
| Identification of the aberrant gene expression in precancerous and cancerous lesions by comparing the gene expression of stem-like cells in diseased tissues with normal stem cells |
| Entrez ID | Symbol | Replicates | Species | Organ | Tissue | Adj P-value | Log2FC | Malignancy |
| 25849 | PARM1 | HTA11_3410_2000001011 | Human | Colorectum | AD | 1.38e-08 | -4.20e-01 | 0.0155 |
| 25849 | PARM1 | HTA11_347_2000001011 | Human | Colorectum | AD | 5.20e-28 | 1.14e+00 | -0.1954 |
| 25849 | PARM1 | HTA11_411_2000001011 | Human | Colorectum | SER | 2.06e-08 | 1.16e+00 | -0.2602 |
| 25849 | PARM1 | HTA11_2112_2000001011 | Human | Colorectum | SER | 4.98e-02 | 7.48e-01 | -0.2196 |
| 25849 | PARM1 | HTA11_696_2000001011 | Human | Colorectum | AD | 7.02e-03 | 4.38e-01 | -0.1464 |
| 25849 | PARM1 | HTA11_5212_2000001011 | Human | Colorectum | AD | 2.48e-05 | 8.13e-01 | -0.2061 |
| 25849 | PARM1 | HTA11_99999970781_79442 | Human | Colorectum | MSS | 4.37e-11 | 6.75e-01 | 0.294 |
| 25849 | PARM1 | HTA11_99999965104_69814 | Human | Colorectum | MSS | 8.60e-03 | -1.91e-01 | 0.281 |
| 25849 | PARM1 | HTA11_99999971662_82457 | Human | Colorectum | MSS | 1.69e-04 | 4.47e-01 | 0.3859 |
| 25849 | PARM1 | HTA11_99999974143_84620 | Human | Colorectum | MSS | 1.31e-07 | -4.13e-01 | 0.3005 |
| 25849 | PARM1 | A015-C-203 | Human | Colorectum | FAP | 9.38e-10 | -2.02e-01 | -0.1294 |
| 25849 | PARM1 | A002-C-201 | Human | Colorectum | FAP | 8.12e-06 | -2.29e-01 | 0.0324 |
| 25849 | PARM1 | A001-C-108 | Human | Colorectum | FAP | 4.38e-08 | 2.74e-01 | -0.0272 |
| 25849 | PARM1 | A002-C-205 | Human | Colorectum | FAP | 7.54e-10 | -2.65e-01 | -0.1236 |
| 25849 | PARM1 | A015-C-006 | Human | Colorectum | FAP | 1.27e-05 | -9.83e-02 | -0.0994 |
| 25849 | PARM1 | A002-C-114 | Human | Colorectum | FAP | 2.72e-07 | -2.61e-01 | -0.1561 |
| 25849 | PARM1 | A015-C-104 | Human | Colorectum | FAP | 2.81e-10 | -2.33e-01 | -0.1899 |
| 25849 | PARM1 | A001-C-014 | Human | Colorectum | FAP | 6.40e-06 | 2.60e-01 | 0.0135 |
| 25849 | PARM1 | A002-C-016 | Human | Colorectum | FAP | 2.80e-09 | -1.71e-01 | 0.0521 |
| 25849 | PARM1 | A015-C-002 | Human | Colorectum | FAP | 6.81e-04 | -7.10e-02 | -0.0763 |
| Page: 1 2 3 4 5 |
| Tissue | Expression Dynamics | Abbreviation |
| Colorectum (GSE201348) |  | FAP: Familial adenomatous polyposis |
| CRC: Colorectal cancer | ||
| Colorectum (HTA11) |  | AD: Adenomas |
| SER: Sessile serrated lesions | ||
| MSI-H: Microsatellite-high colorectal cancer | ||
| MSS: Microsatellite stable colorectal cancer | ||
| Esophagus | 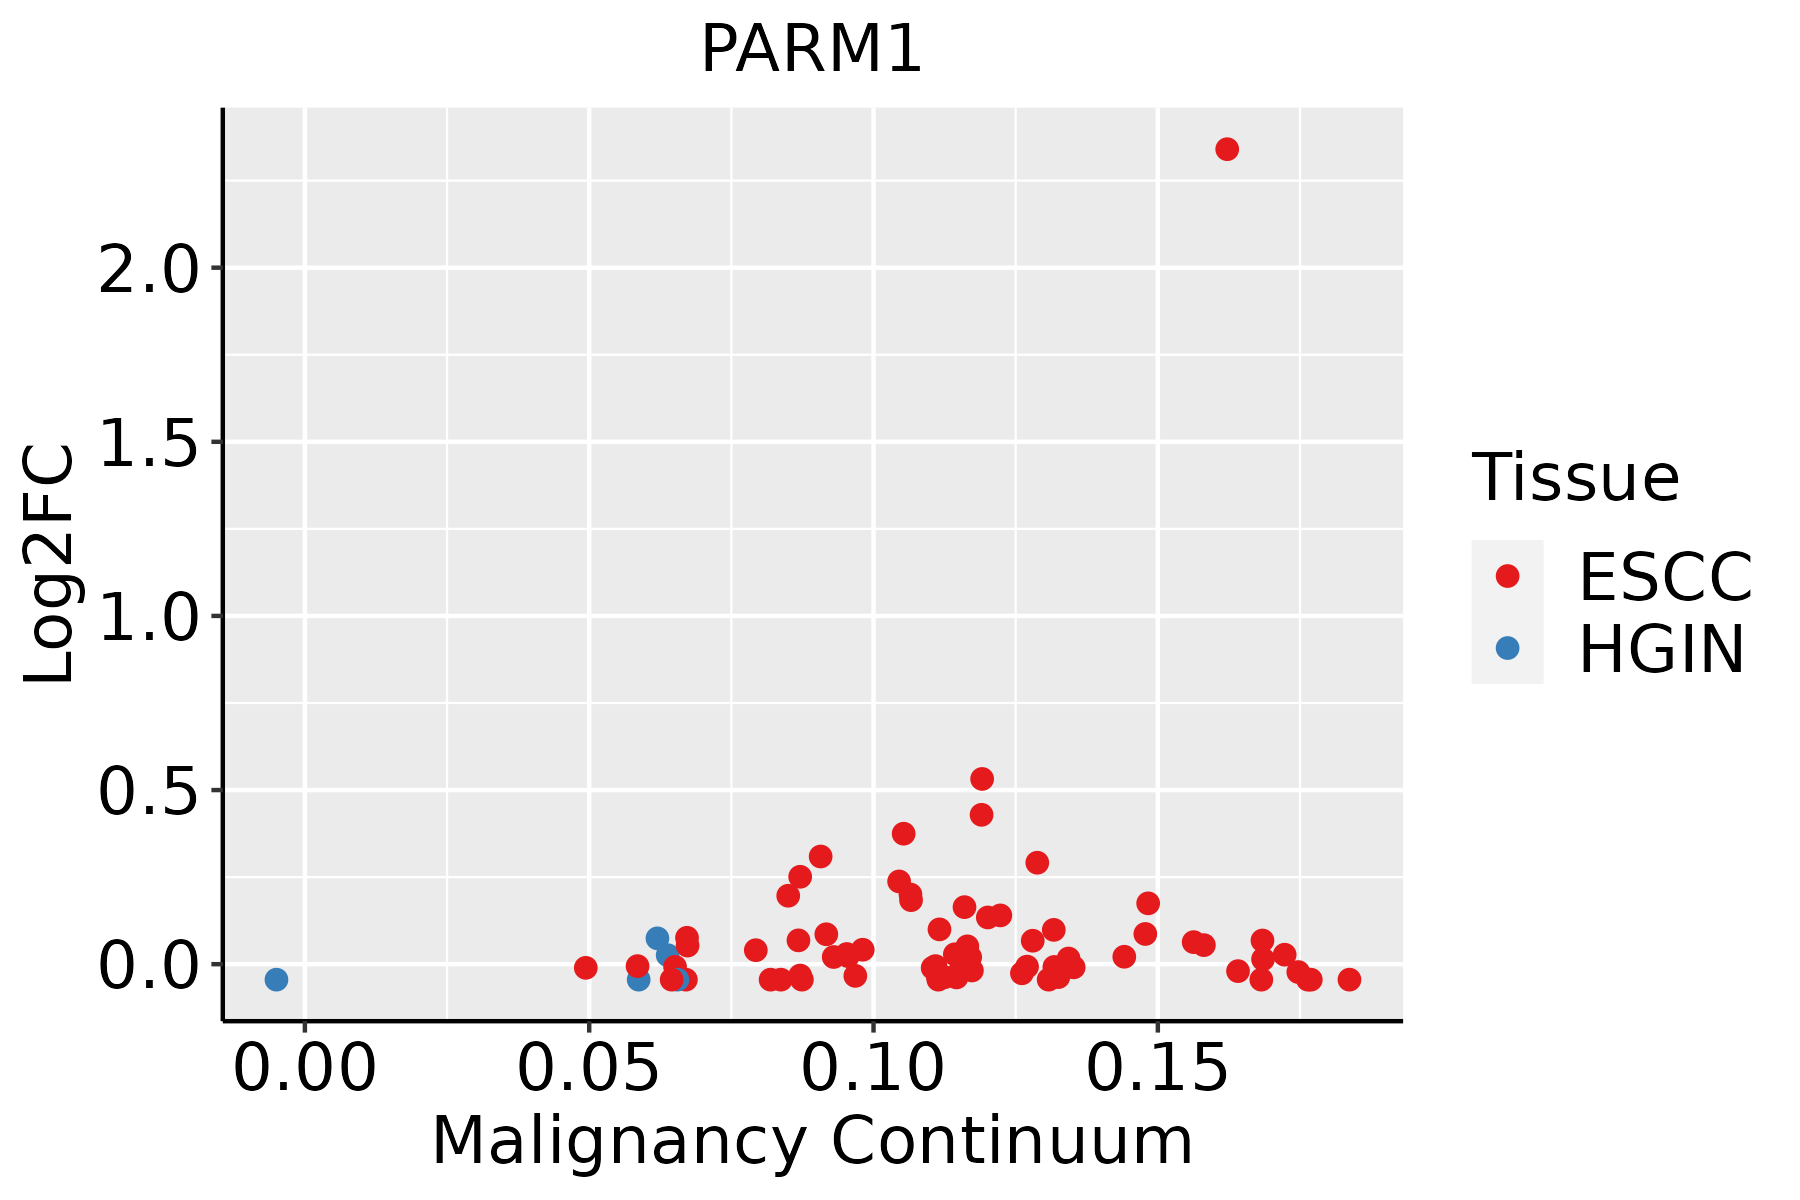 | ESCC: Esophageal squamous cell carcinoma |
| HGIN: High-grade intraepithelial neoplasias | ||
| LGIN: Low-grade intraepithelial neoplasias | ||
| Lung | 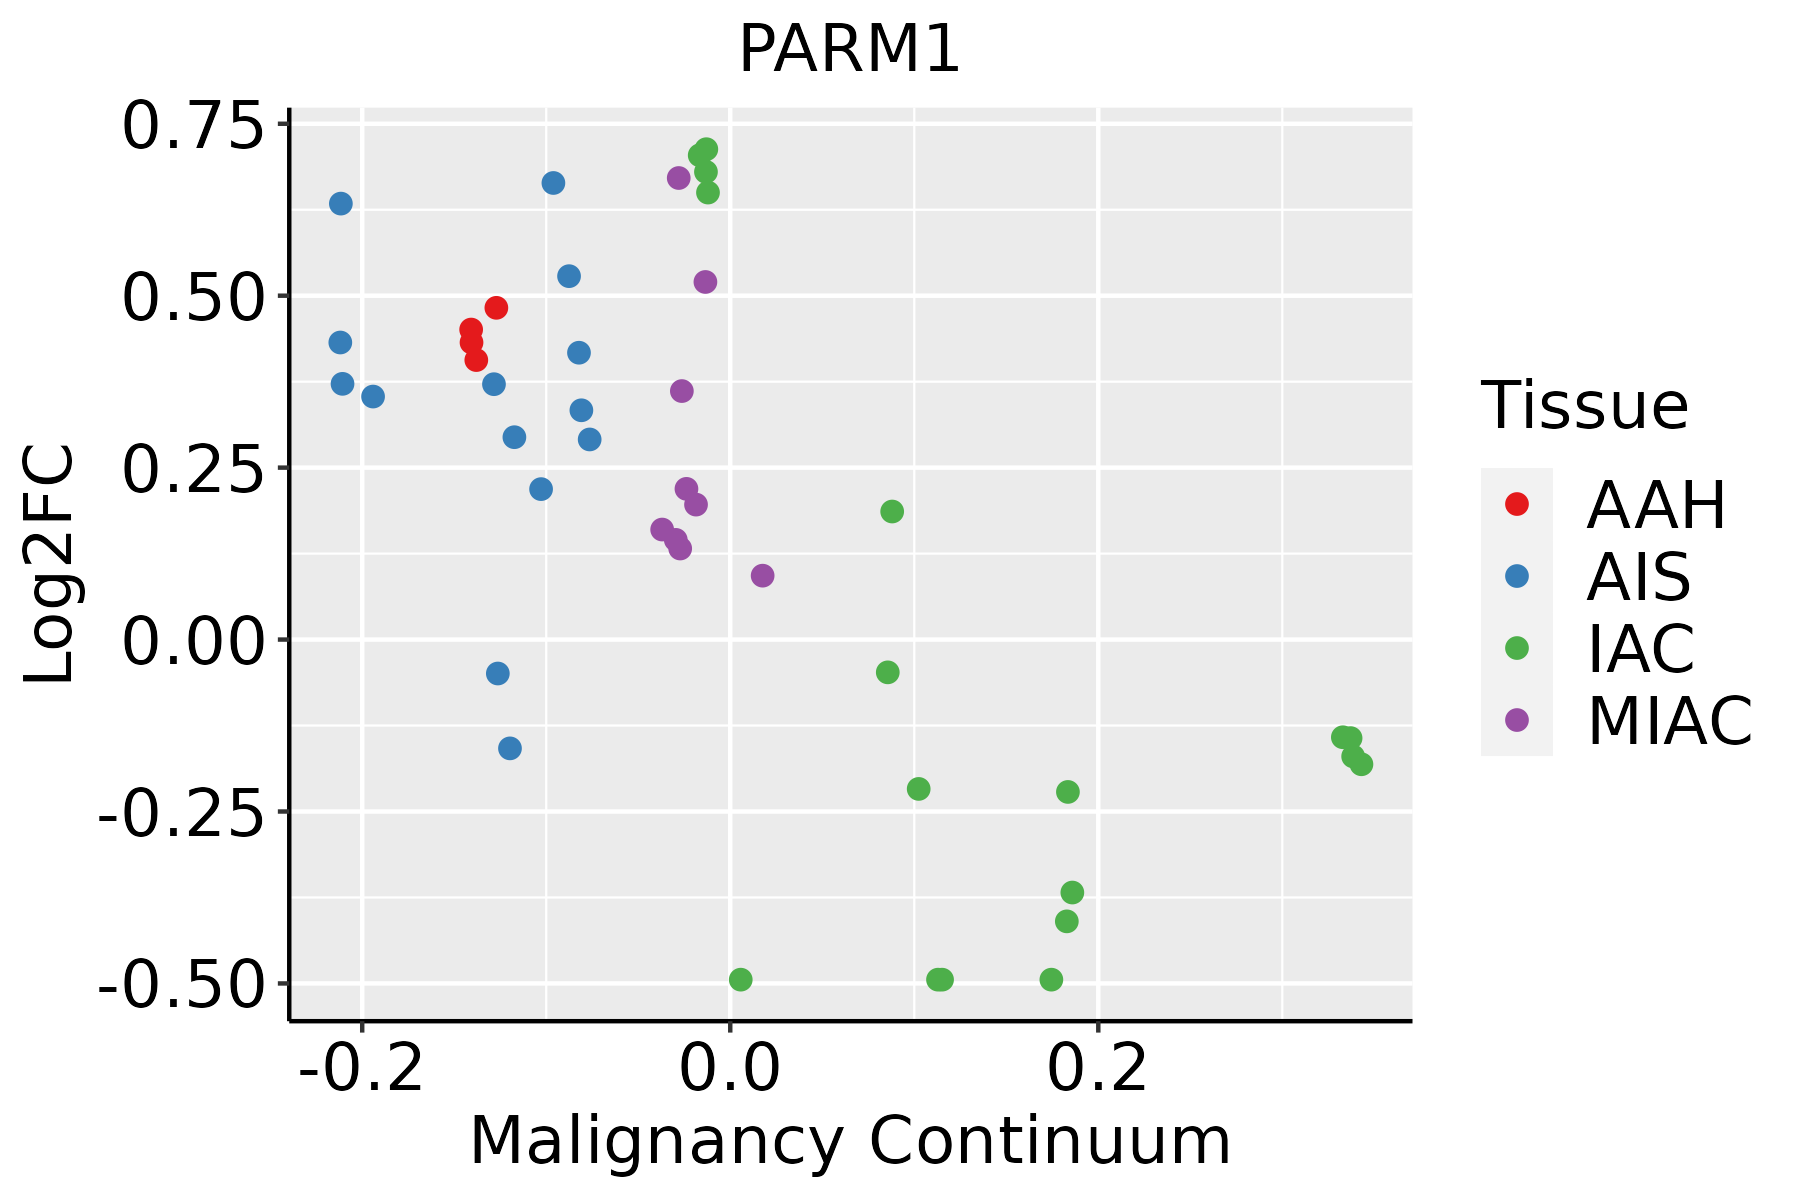 | AAH: Atypical adenomatous hyperplasia |
| AIS: Adenocarcinoma in situ | ||
| IAC: Invasive lung adenocarcinoma | ||
| MIA: Minimally invasive adenocarcinoma | ||
| Prostate |  | BPH: Benign Prostatic Hyperplasia |
| Thyroid | 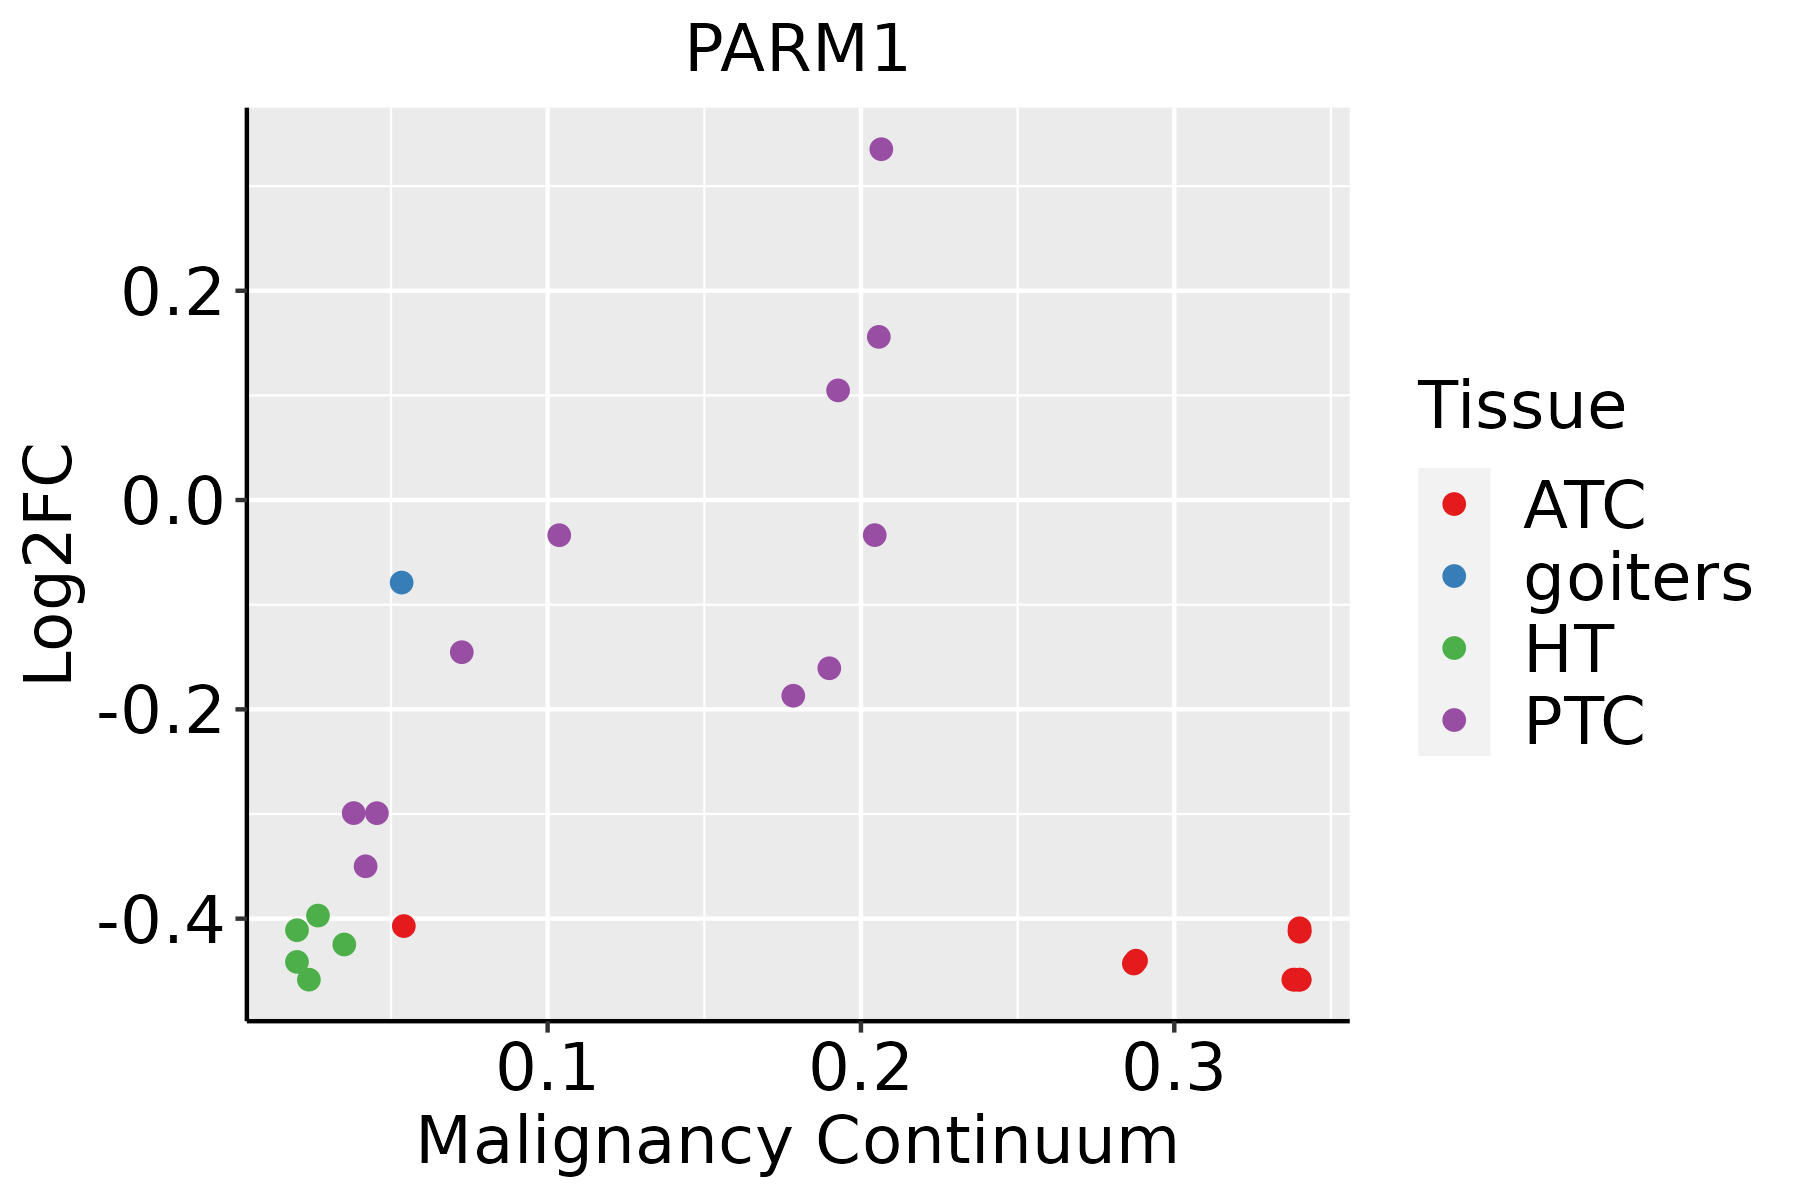 | ATC: Anaplastic thyroid cancer |
| HT: Hashimoto's thyroiditis | ||
| PTC: Papillary thyroid cancer |
| ∗log2FC in expression of this searched gene in stem-like cells from each diseased tissue sample relative to stem-like cells in normal samples in each tissue plotted against the malignancy continuum. Samples are colored based on if they are from different disease stage. |
Top |
Malignant transformation related pathway analysis |
| Find out the enriched GO biological processes and KEGG pathways involved in transition from healthy to precancer to cancer |
| Tissue | Disease Stage | Enriched GO biological Processes |
| Colorectum | AD |  |
| Colorectum | SER |  |
| Colorectum | MSS |  |
| Colorectum | MSI-H |  |
| Colorectum | FAP |  |
| ∗Top 15 enriched GO BP terms are showed in the bar plot of each disease state in each tissue. Each row represents a significant GO biological process which is colored according to the -log10(p.adjust). |
| Page: 1 2 3 4 5 6 7 8 9 |
| GO ID | Tissue | Disease Stage | Description | Gene Ratio | Bg Ratio | pvalue | p.adjust | Count |
| GO:0051052 | Colorectum | AD | regulation of DNA metabolic process | 116/3918 | 359/18723 | 2.47e-07 | 1.00e-05 | 116 |
| GO:0051054 | Colorectum | AD | positive regulation of DNA metabolic process | 73/3918 | 201/18723 | 3.27e-07 | 1.29e-05 | 73 |
| GO:2000278 | Colorectum | AD | regulation of DNA biosynthetic process | 41/3918 | 106/18723 | 2.17e-05 | 4.33e-04 | 41 |
| GO:2000573 | Colorectum | AD | positive regulation of DNA biosynthetic process | 28/3918 | 66/18723 | 6.35e-05 | 1.05e-03 | 28 |
| GO:0051972 | Colorectum | AD | regulation of telomerase activity | 22/3918 | 47/18723 | 6.45e-05 | 1.07e-03 | 22 |
| GO:0051973 | Colorectum | AD | positive regulation of telomerase activity | 17/3918 | 34/18723 | 1.59e-04 | 2.20e-03 | 17 |
| GO:0071897 | Colorectum | AD | DNA biosynthetic process | 55/3918 | 180/18723 | 1.46e-03 | 1.24e-02 | 55 |
| GO:20002781 | Colorectum | SER | regulation of DNA biosynthetic process | 33/2897 | 106/18723 | 3.83e-05 | 9.82e-04 | 33 |
| GO:00510541 | Colorectum | SER | positive regulation of DNA metabolic process | 53/2897 | 201/18723 | 4.51e-05 | 1.13e-03 | 53 |
| GO:00510521 | Colorectum | SER | regulation of DNA metabolic process | 83/2897 | 359/18723 | 8.03e-05 | 1.77e-03 | 83 |
| GO:20005731 | Colorectum | SER | positive regulation of DNA biosynthetic process | 22/2897 | 66/18723 | 2.44e-04 | 4.17e-03 | 22 |
| GO:00718971 | Colorectum | SER | DNA biosynthetic process | 43/2897 | 180/18723 | 1.99e-03 | 1.98e-02 | 43 |
| GO:00519721 | Colorectum | SER | regulation of telomerase activity | 15/2897 | 47/18723 | 3.68e-03 | 3.07e-02 | 15 |
| GO:00510522 | Colorectum | MSS | regulation of DNA metabolic process | 108/3467 | 359/18723 | 5.86e-08 | 3.10e-06 | 108 |
| GO:00510542 | Colorectum | MSS | positive regulation of DNA metabolic process | 69/3467 | 201/18723 | 6.33e-08 | 3.26e-06 | 69 |
| GO:00519722 | Colorectum | MSS | regulation of telomerase activity | 21/3467 | 47/18723 | 3.36e-05 | 6.56e-04 | 21 |
| GO:20002782 | Colorectum | MSS | regulation of DNA biosynthetic process | 37/3467 | 106/18723 | 4.48e-05 | 8.28e-04 | 37 |
| GO:20005732 | Colorectum | MSS | positive regulation of DNA biosynthetic process | 26/3467 | 66/18723 | 5.97e-05 | 1.04e-03 | 26 |
| GO:00519731 | Colorectum | MSS | positive regulation of telomerase activity | 16/3467 | 34/18723 | 1.36e-04 | 2.04e-03 | 16 |
| GO:00718972 | Colorectum | MSS | DNA biosynthetic process | 50/3467 | 180/18723 | 1.45e-03 | 1.35e-02 | 50 |
| Page: 1 2 3 4 |
| Pathway ID | Tissue | Disease Stage | Description | Gene Ratio | Bg Ratio | pvalue | p.adjust | qvalue | Count |
| Page: 1 |
Top |
Cell-cell communication analysis |
| Identification of potential cell-cell interactions between two cell types and their ligand-receptor pairs for different disease states |
| Ligand | Receptor | LRpair | Pathway | Tissue | Disease Stage |
| Page: 1 |
Top |
Single-cell gene regulatory network inference analysis |
| Find out the significant the regulons (TFs) and the target genes of each regulon across cell types for different disease states |
| TF | Cell Type | Tissue | Disease Stage | Target Gene | RSS | Regulon Activity |
| ∗The dot plots of a searched regulon are shown for all cell subpopulations in each disease state of each tissue based on the regulon specific score inferred using pySCENIC and by calculating the average expression. |
| Page: 1 |
Top |
Somatic mutation of malignant transformation related genes |
| Annotation of somatic variants for genes involved in malignant transformation |
| Hugo Symbol | Variant Class | Variant Classification | dbSNP RS | HGVSc | HGVSp | HGVSp Short | SWISSPROT | BIOTYPE | SIFT | PolyPhen | Tumor Sample Barcode | Tissue | Histology | Sex | Age | Stage | Therapy Types | Drugs | Outcome |
| PARM1 | SNV | Missense_Mutation | rs531049471 | c.731N>T | p.Arg244Met | p.R244M | Q6UWI2 | protein_coding | tolerated(0.16) | benign(0.263) | TCGA-A2-A3XY-01 | Breast | breast invasive carcinoma | Female | <65 | I/II | Chemotherapy | adriamycin | PD |
| PARM1 | SNV | Missense_Mutation | c.47N>T | p.Trp16Leu | p.W16L | Q6UWI2 | protein_coding | tolerated(1) | benign(0) | TCGA-AN-A0AK-01 | Breast | breast invasive carcinoma | Female | >=65 | I/II | Unknown | Unknown | SD | |
| PARM1 | SNV | Missense_Mutation | novel | c.929N>T | p.Ser310Phe | p.S310F | Q6UWI2 | protein_coding | deleterious(0) | probably_damaging(0.999) | TCGA-C5-A7UH-01 | Cervix | cervical & endocervical cancer | Female | <65 | III/IV | Chemotherapy | cisplatin | SD |
| PARM1 | SNV | Missense_Mutation | c.314N>T | p.Ser105Leu | p.S105L | Q6UWI2 | protein_coding | tolerated(0.05) | benign(0.04) | TCGA-ZJ-AAX8-01 | Cervix | cervical & endocervical cancer | Female | <65 | III/IV | Unknown | Unknown | SD | |
| PARM1 | SNV | Missense_Mutation | c.155A>G | p.Asp52Gly | p.D52G | Q6UWI2 | protein_coding | tolerated(0.14) | benign(0.01) | TCGA-AA-3663-01 | Colorectum | colon adenocarcinoma | Male | <65 | I/II | Unknown | Unknown | SD | |
| PARM1 | SNV | Missense_Mutation | rs182618057 | c.95N>T | p.Pro32Leu | p.P32L | Q6UWI2 | protein_coding | tolerated(0.06) | benign(0.042) | TCGA-AD-6895-01 | Colorectum | colon adenocarcinoma | Male | >=65 | III/IV | Unknown | Unknown | SD |
| PARM1 | SNV | Missense_Mutation | novel | c.115N>G | p.Thr39Ala | p.T39A | Q6UWI2 | protein_coding | tolerated(0.18) | benign(0.001) | TCGA-CA-6717-01 | Colorectum | colon adenocarcinoma | Male | <65 | I/II | Chemotherapy | oxaliplatin | CR |
| PARM1 | SNV | Missense_Mutation | c.68N>T | p.Thr23Ile | p.T23I | Q6UWI2 | protein_coding | tolerated(0.11) | benign(0.049) | TCGA-CK-5916-01 | Colorectum | colon adenocarcinoma | Female | >=65 | I/II | Unknown | Unknown | PD | |
| PARM1 | SNV | Missense_Mutation | rs199704472 | c.424N>A | p.Ala142Thr | p.A142T | Q6UWI2 | protein_coding | tolerated(0.24) | benign(0) | TCGA-D5-6531-01 | Colorectum | colon adenocarcinoma | Male | >=65 | I/II | Unknown | Unknown | SD |
| PARM1 | SNV | Missense_Mutation | novel | c.26T>G | p.Leu9Arg | p.L9R | Q6UWI2 | protein_coding | tolerated(0.07) | probably_damaging(0.917) | TCGA-F5-6814-01 | Colorectum | rectum adenocarcinoma | Male | <65 | I/II | Unknown | Unknown | SD |
| Page: 1 2 3 4 |
Top |
Related drugs of malignant transformation related genes |
| Identification of chemicals and drugs interact with genes involved in malignant transfromation |
| (DGIdb 4.0) |
| Entrez ID | Symbol | Category | Interaction Types | Drug Claim Name | Drug Name | PMIDs |
| Page: 1 |

Copyright 2023-Present -The University of Texas Health Science Center at Houston |