
|
|||||
|
 | |
| |
| |
| |
| |
| |
|
Gene: PARL |
Gene summary for PARL |
| Gene information | Species | Human | Gene symbol | PARL | Gene ID | 55486 |
| Gene name | presenilin associated rhomboid like | |
| Gene Alias | PRO2207 | |
| Cytomap | 3q27.1 | |
| Gene Type | protein-coding | GO ID | GO:0006465 | UniProtAcc | Q9H300 |
Top |
Malignant transformation analysis |
| Identification of the aberrant gene expression in precancerous and cancerous lesions by comparing the gene expression of stem-like cells in diseased tissues with normal stem cells |
| Entrez ID | Symbol | Replicates | Species | Organ | Tissue | Adj P-value | Log2FC | Malignancy |
| 55486 | PARL | HTA11_3410_2000001011 | Human | Colorectum | AD | 9.94e-30 | 5.08e-01 | 0.0155 |
| 55486 | PARL | HTA11_2487_2000001011 | Human | Colorectum | SER | 3.26e-23 | 5.54e-01 | -0.1808 |
| 55486 | PARL | HTA11_2951_2000001011 | Human | Colorectum | AD | 1.51e-11 | 6.52e-01 | 0.0216 |
| 55486 | PARL | HTA11_1938_2000001011 | Human | Colorectum | AD | 1.30e-28 | 7.94e-01 | -0.0811 |
| 55486 | PARL | HTA11_78_2000001011 | Human | Colorectum | AD | 9.56e-26 | 5.74e-01 | -0.1088 |
| 55486 | PARL | HTA11_347_2000001011 | Human | Colorectum | AD | 4.69e-50 | 8.94e-01 | -0.1954 |
| 55486 | PARL | HTA11_411_2000001011 | Human | Colorectum | SER | 2.50e-11 | 8.27e-01 | -0.2602 |
| 55486 | PARL | HTA11_2112_2000001011 | Human | Colorectum | SER | 5.26e-10 | 6.59e-01 | -0.2196 |
| 55486 | PARL | HTA11_3361_2000001011 | Human | Colorectum | AD | 7.13e-20 | 5.81e-01 | -0.1207 |
| 55486 | PARL | HTA11_83_2000001011 | Human | Colorectum | SER | 4.15e-23 | 7.15e-01 | -0.1526 |
| 55486 | PARL | HTA11_696_2000001011 | Human | Colorectum | AD | 1.94e-44 | 7.53e-01 | -0.1464 |
| 55486 | PARL | HTA11_866_2000001011 | Human | Colorectum | AD | 3.28e-34 | 5.86e-01 | -0.1001 |
| 55486 | PARL | HTA11_1391_2000001011 | Human | Colorectum | AD | 1.21e-41 | 8.04e-01 | -0.059 |
| 55486 | PARL | HTA11_2992_2000001011 | Human | Colorectum | SER | 2.44e-09 | 4.65e-01 | -0.1706 |
| 55486 | PARL | HTA11_5212_2000001011 | Human | Colorectum | AD | 1.00e-07 | 4.96e-01 | -0.2061 |
| 55486 | PARL | HTA11_5216_2000001011 | Human | Colorectum | SER | 2.17e-09 | 5.15e-01 | -0.1462 |
| 55486 | PARL | HTA11_546_2000001011 | Human | Colorectum | AD | 3.33e-26 | 7.15e-01 | -0.0842 |
| 55486 | PARL | HTA11_9341_2000001011 | Human | Colorectum | SER | 7.44e-09 | 5.05e-01 | -0.00410000000000005 |
| 55486 | PARL | HTA11_7862_2000001011 | Human | Colorectum | AD | 7.42e-19 | 5.71e-01 | -0.0179 |
| 55486 | PARL | HTA11_866_3004761011 | Human | Colorectum | AD | 9.05e-24 | 4.82e-01 | 0.096 |
| Page: 1 2 3 4 5 6 7 8 |
| Tissue | Expression Dynamics | Abbreviation |
| Colorectum (GSE201348) |  | FAP: Familial adenomatous polyposis |
| CRC: Colorectal cancer | ||
| Colorectum (HTA11) |  | AD: Adenomas |
| SER: Sessile serrated lesions | ||
| MSI-H: Microsatellite-high colorectal cancer | ||
| MSS: Microsatellite stable colorectal cancer | ||
| Esophagus |  | ESCC: Esophageal squamous cell carcinoma |
| HGIN: High-grade intraepithelial neoplasias | ||
| LGIN: Low-grade intraepithelial neoplasias | ||
| Oral Cavity | 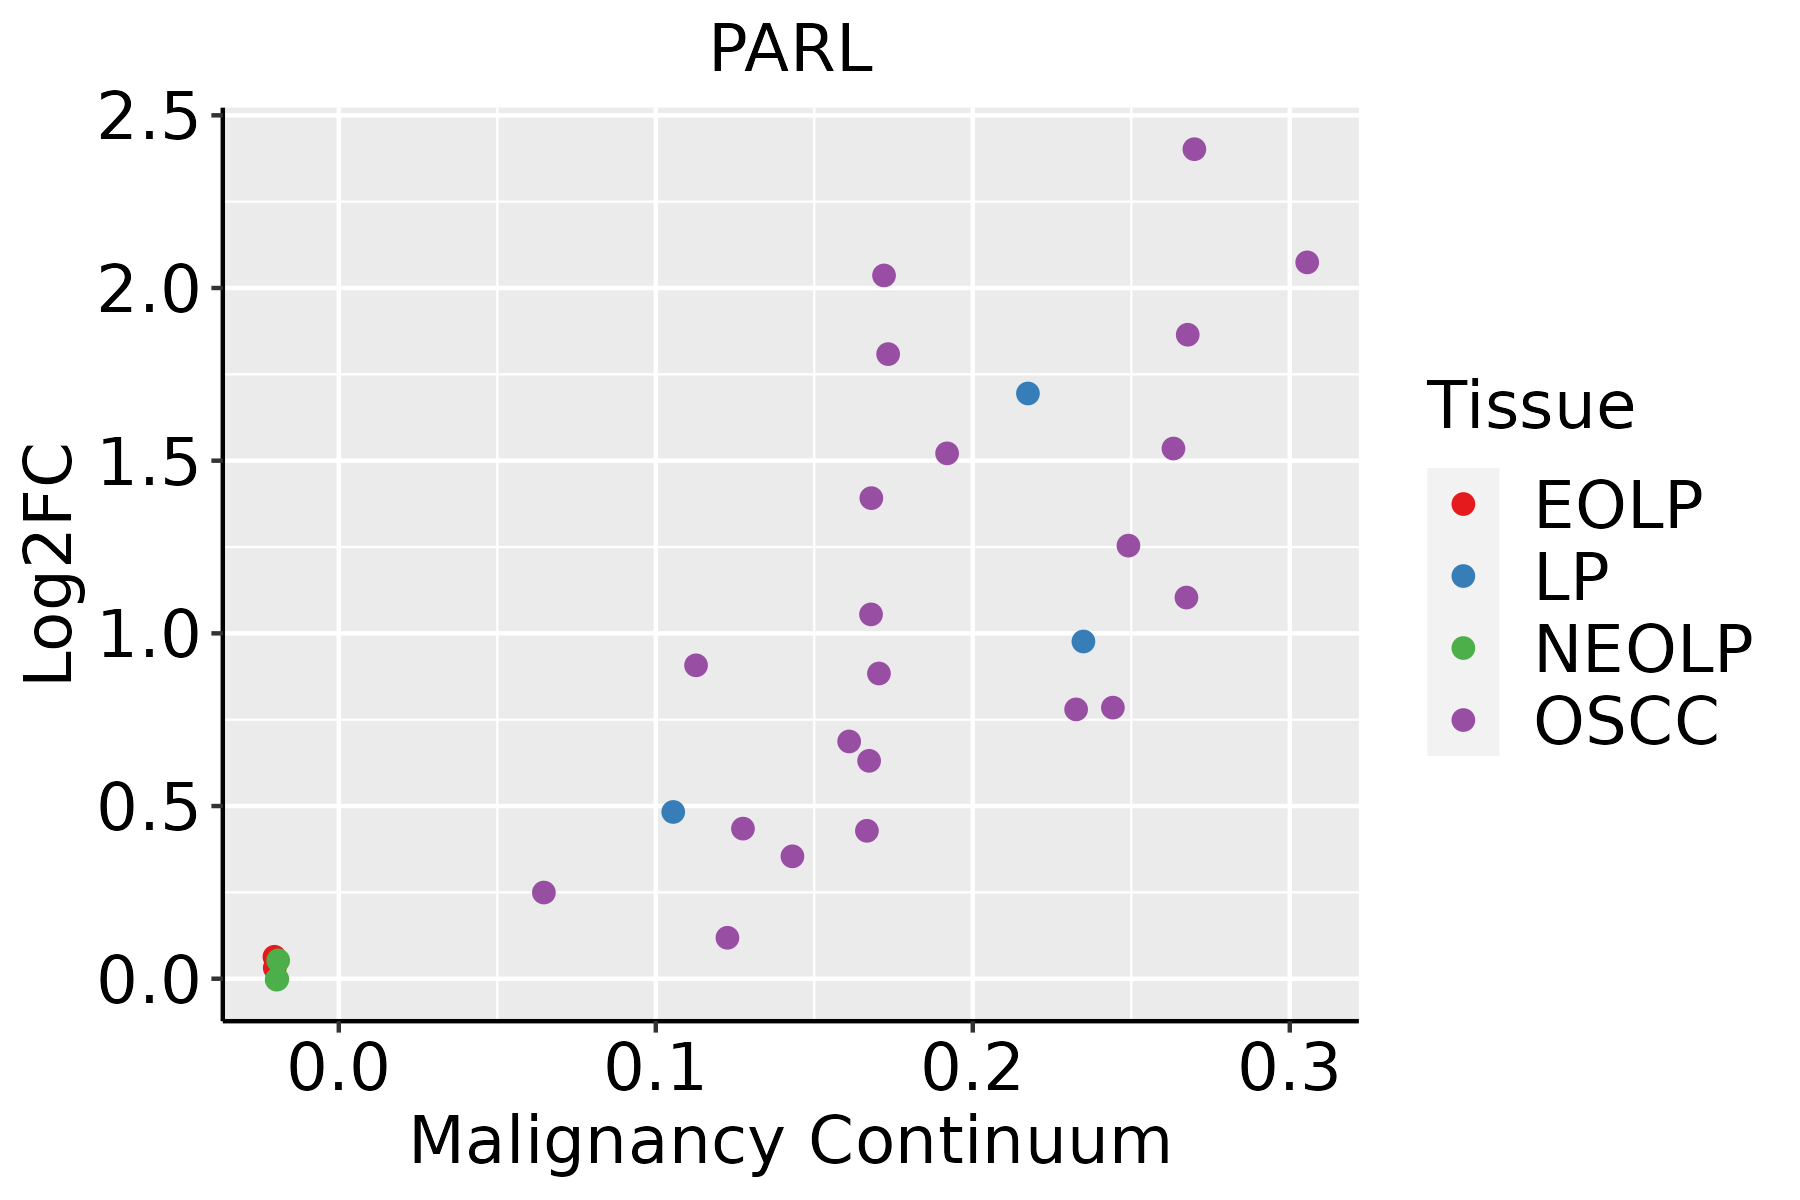 | EOLP: Erosive Oral lichen planus |
| LP: leukoplakia | ||
| NEOLP: Non-erosive oral lichen planus | ||
| OSCC: Oral squamous cell carcinoma | ||
| Skin | 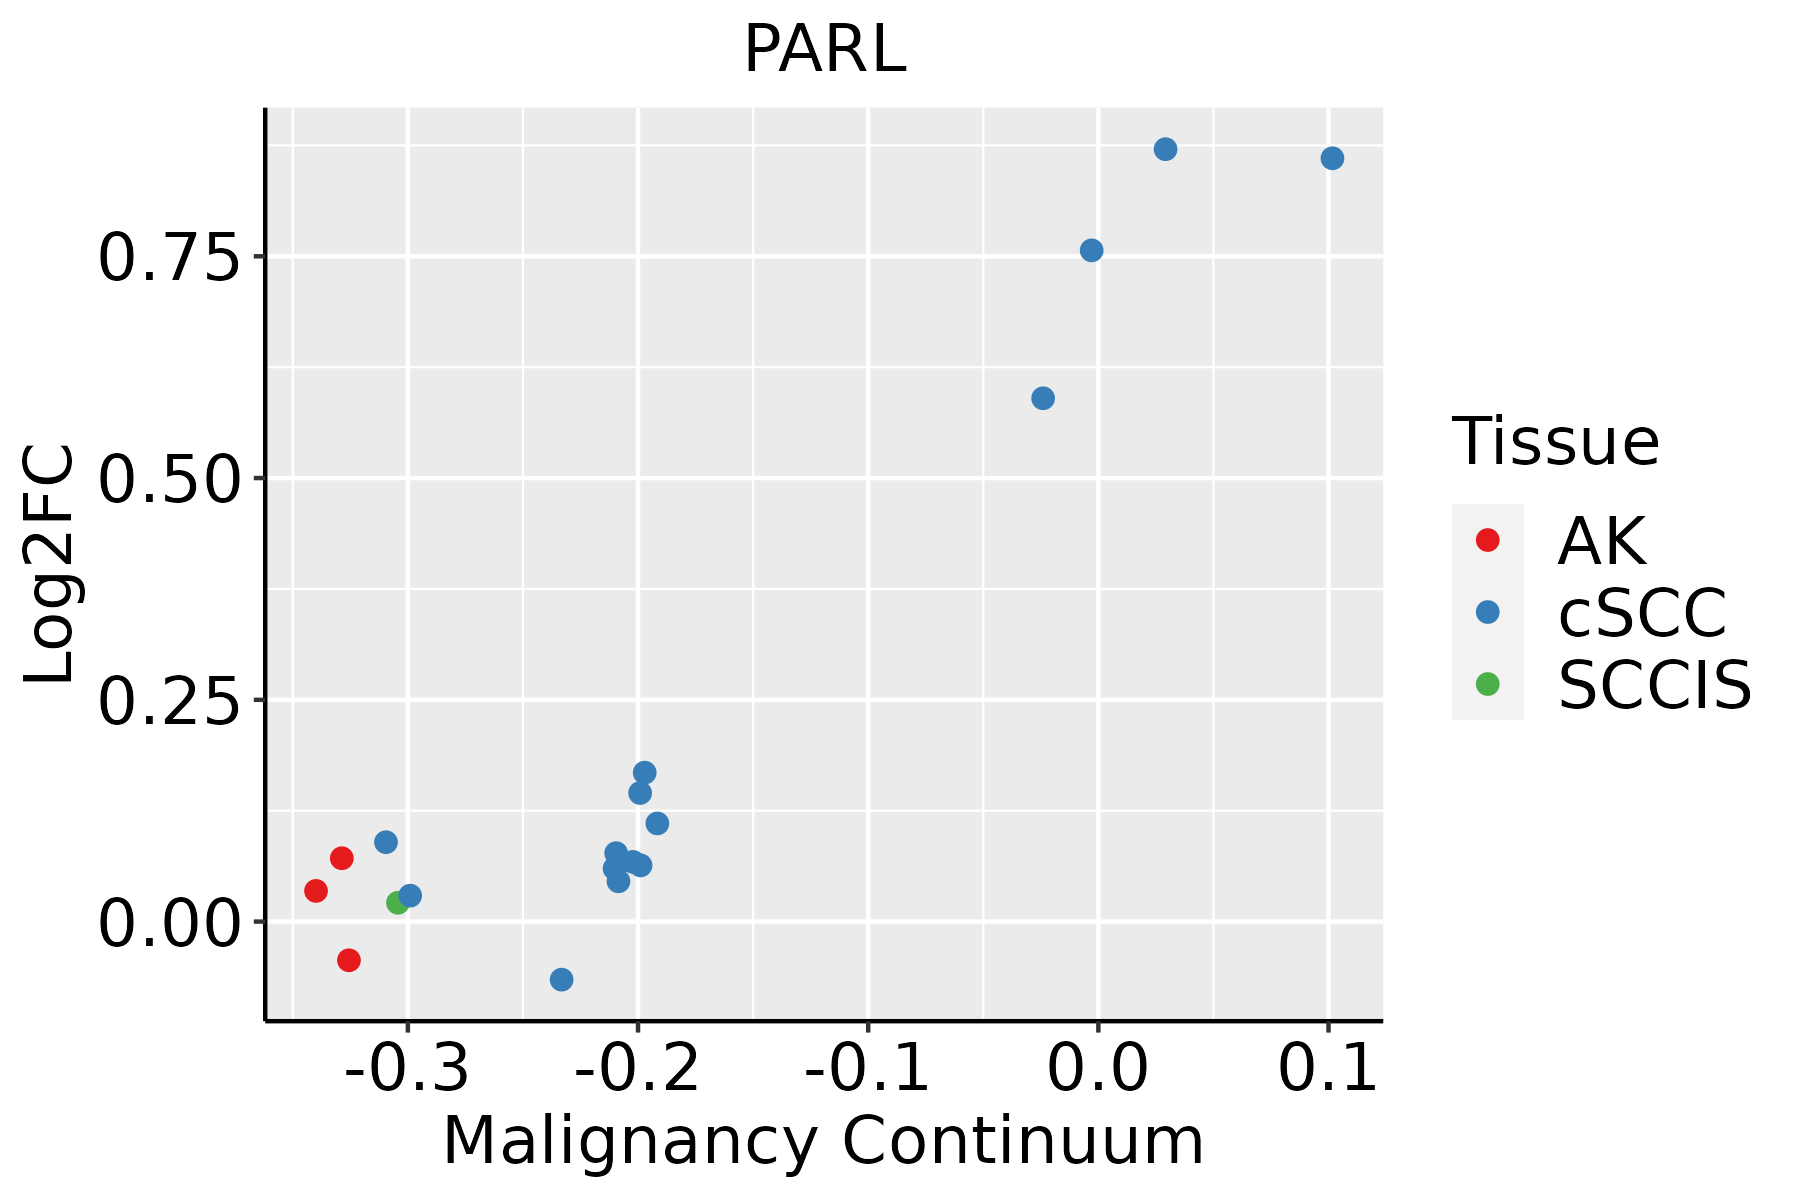 | AK: Actinic keratosis |
| cSCC: Cutaneous squamous cell carcinoma | ||
| SCCIS:squamous cell carcinoma in situ | ||
| Thyroid |  | ATC: Anaplastic thyroid cancer |
| HT: Hashimoto's thyroiditis | ||
| PTC: Papillary thyroid cancer |
| ∗log2FC in expression of this searched gene in stem-like cells from each diseased tissue sample relative to stem-like cells in normal samples in each tissue plotted against the malignancy continuum. Samples are colored based on if they are from different disease stage. |
Top |
Malignant transformation related pathway analysis |
| Find out the enriched GO biological processes and KEGG pathways involved in transition from healthy to precancer to cancer |
| Tissue | Disease Stage | Enriched GO biological Processes |
| Colorectum | AD |  |
| Colorectum | SER |  |
| Colorectum | MSS |  |
| Colorectum | MSI-H |  |
| Colorectum | FAP |  |
| ∗Top 15 enriched GO BP terms are showed in the bar plot of each disease state in each tissue. Each row represents a significant GO biological process which is colored according to the -log10(p.adjust). |
| Page: 1 2 3 4 5 6 7 8 9 |
| GO ID | Tissue | Disease Stage | Description | Gene Ratio | Bg Ratio | pvalue | p.adjust | Count |
| GO:0006839 | Colorectum | AD | mitochondrial transport | 102/3918 | 254/18723 | 1.87e-12 | 3.08e-10 | 102 |
| GO:0072594 | Colorectum | AD | establishment of protein localization to organelle | 148/3918 | 422/18723 | 7.95e-12 | 1.04e-09 | 148 |
| GO:0006605 | Colorectum | AD | protein targeting | 105/3918 | 314/18723 | 1.39e-07 | 6.44e-06 | 105 |
| GO:0010821 | Colorectum | AD | regulation of mitochondrion organization | 57/3918 | 144/18723 | 2.43e-07 | 9.92e-06 | 57 |
| GO:0070585 | Colorectum | AD | protein localization to mitochondrion | 51/3918 | 125/18723 | 3.40e-07 | 1.33e-05 | 51 |
| GO:0032386 | Colorectum | AD | regulation of intracellular transport | 109/3918 | 337/18723 | 5.33e-07 | 1.95e-05 | 109 |
| GO:0033157 | Colorectum | AD | regulation of intracellular protein transport | 80/3918 | 229/18723 | 5.81e-07 | 2.09e-05 | 80 |
| GO:0072655 | Colorectum | AD | establishment of protein localization to mitochondrion | 47/3918 | 120/18723 | 3.76e-06 | 1.04e-04 | 47 |
| GO:0006465 | Colorectum | AD | signal peptide processing | 10/3918 | 14/18723 | 6.90e-05 | 1.11e-03 | 10 |
| GO:0006626 | Colorectum | AD | protein targeting to mitochondrion | 37/3918 | 100/18723 | 1.58e-04 | 2.20e-03 | 37 |
| GO:1903533 | Colorectum | AD | regulation of protein targeting | 31/3918 | 81/18723 | 2.61e-04 | 3.25e-03 | 31 |
| GO:0072593 | Colorectum | AD | reactive oxygen species metabolic process | 73/3918 | 239/18723 | 2.79e-04 | 3.42e-03 | 73 |
| GO:1903747 | Colorectum | AD | regulation of establishment of protein localization to mitochondrion | 21/3918 | 50/18723 | 5.97e-04 | 6.31e-03 | 21 |
| GO:0051604 | Colorectum | AD | protein maturation | 85/3918 | 294/18723 | 6.73e-04 | 6.91e-03 | 85 |
| GO:1903214 | Colorectum | AD | regulation of protein targeting to mitochondrion | 18/3918 | 44/18723 | 2.06e-03 | 1.64e-02 | 18 |
| GO:2000377 | Colorectum | AD | regulation of reactive oxygen species metabolic process | 48/3918 | 157/18723 | 2.77e-03 | 2.09e-02 | 48 |
| GO:0033619 | Colorectum | AD | membrane protein proteolysis | 21/3918 | 57/18723 | 4.16e-03 | 2.88e-02 | 21 |
| GO:0016485 | Colorectum | AD | protein processing | 63/3918 | 225/18723 | 6.77e-03 | 4.19e-02 | 63 |
| GO:00068391 | Colorectum | SER | mitochondrial transport | 87/2897 | 254/18723 | 7.91e-14 | 3.03e-11 | 87 |
| GO:00725941 | Colorectum | SER | establishment of protein localization to organelle | 111/2897 | 422/18723 | 4.98e-09 | 4.49e-07 | 111 |
| Page: 1 2 3 4 5 6 7 8 9 10 |
| Pathway ID | Tissue | Disease Stage | Description | Gene Ratio | Bg Ratio | pvalue | p.adjust | qvalue | Count |
| Page: 1 |
Top |
Cell-cell communication analysis |
| Identification of potential cell-cell interactions between two cell types and their ligand-receptor pairs for different disease states |
| Ligand | Receptor | LRpair | Pathway | Tissue | Disease Stage |
| Page: 1 |
Top |
Single-cell gene regulatory network inference analysis |
| Find out the significant the regulons (TFs) and the target genes of each regulon across cell types for different disease states |
| TF | Cell Type | Tissue | Disease Stage | Target Gene | RSS | Regulon Activity |
| ∗The dot plots of a searched regulon are shown for all cell subpopulations in each disease state of each tissue based on the regulon specific score inferred using pySCENIC and by calculating the average expression. |
| Page: 1 |
Top |
Somatic mutation of malignant transformation related genes |
| Annotation of somatic variants for genes involved in malignant transformation |
| Hugo Symbol | Variant Class | Variant Classification | dbSNP RS | HGVSc | HGVSp | HGVSp Short | SWISSPROT | BIOTYPE | SIFT | PolyPhen | Tumor Sample Barcode | Tissue | Histology | Sex | Age | Stage | Therapy Types | Drugs | Outcome |
| PARL | SNV | Missense_Mutation | novel | c.911T>C | p.Phe304Ser | p.F304S | Q9H300 | protein_coding | deleterious(0) | possibly_damaging(0.609) | TCGA-2W-A8YY-01 | Cervix | cervical & endocervical cancer | Female | <65 | I/II | Chemotherapy | cisplatin | CR |
| PARL | SNV | Missense_Mutation | rs749633030 | c.188G>A | p.Arg63Gln | p.R63Q | Q9H300 | protein_coding | deleterious(0.04) | benign(0.164) | TCGA-DG-A2KM-01 | Cervix | cervical & endocervical cancer | Female | <65 | I/II | Chemotherapy | cisplatin | SD |
| PARL | SNV | Missense_Mutation | rs762841882 | c.499N>T | p.Arg167Trp | p.R167W | Q9H300 | protein_coding | deleterious(0) | possibly_damaging(0.8) | TCGA-CM-6162-01 | Colorectum | colon adenocarcinoma | Female | <65 | III/IV | Chemotherapy | oxaliplatin | SD |
| PARL | SNV | Missense_Mutation | novel | c.448N>T | p.Asp150Tyr | p.D150Y | Q9H300 | protein_coding | deleterious(0) | benign(0.285) | TCGA-AG-A002-01 | Colorectum | rectum adenocarcinoma | Male | <65 | I/II | Unknown | Unknown | SD |
| PARL | SNV | Missense_Mutation | novel | c.922N>A | p.Ala308Thr | p.A308T | Q9H300 | protein_coding | deleterious(0.03) | possibly_damaging(0.619) | TCGA-A5-A0G2-01 | Endometrium | uterine corpus endometrioid carcinoma | Female | <65 | III/IV | Unknown | Unknown | SD |
| PARL | SNV | Missense_Mutation | rs775771406 | c.529N>A | p.Val177Ile | p.V177I | Q9H300 | protein_coding | tolerated(0.26) | benign(0.066) | TCGA-A5-A0G2-01 | Endometrium | uterine corpus endometrioid carcinoma | Female | <65 | III/IV | Unknown | Unknown | SD |
| PARL | SNV | Missense_Mutation | novel | c.935N>C | p.Leu312Pro | p.L312P | Q9H300 | protein_coding | deleterious(0) | probably_damaging(0.971) | TCGA-AJ-A2QO-01 | Endometrium | uterine corpus endometrioid carcinoma | Female | >=65 | I/II | Unknown | Unknown | SD |
| PARL | SNV | Missense_Mutation | novel | c.634N>C | p.Ser212Pro | p.S212P | Q9H300 | protein_coding | deleterious(0) | probably_damaging(0.998) | TCGA-AP-A1DV-01 | Endometrium | uterine corpus endometrioid carcinoma | Female | <65 | I/II | Unknown | Unknown | SD |
| PARL | SNV | Missense_Mutation | novel | c.1037T>C | p.Val346Ala | p.V346A | Q9H300 | protein_coding | tolerated(0.32) | benign(0) | TCGA-AX-A1C9-01 | Endometrium | uterine corpus endometrioid carcinoma | Female | >=65 | I/II | Unknown | Unknown | SD |
| PARL | SNV | Missense_Mutation | novel | c.242N>A | p.Pro81His | p.P81H | Q9H300 | protein_coding | deleterious(0) | possibly_damaging(0.864) | TCGA-AX-A2HA-01 | Endometrium | uterine corpus endometrioid carcinoma | Female | <65 | I/II | Unknown | Unknown | SD |
| Page: 1 2 3 4 |
Top |
Related drugs of malignant transformation related genes |
| Identification of chemicals and drugs interact with genes involved in malignant transfromation |
| (DGIdb 4.0) |
| Entrez ID | Symbol | Category | Interaction Types | Drug Claim Name | Drug Name | PMIDs |
| Page: 1 |

Copyright 2023-Present -The University of Texas Health Science Center at Houston |