
|
|||||
|
 | |
| |
| |
| |
| |
| |
|
Gene: PARK7 |
Gene summary for PARK7 |
| Gene information | Species | Human | Gene symbol | PARK7 | Gene ID | 11315 |
| Gene name | Parkinsonism associated deglycase | |
| Gene Alias | DJ-1 | |
| Cytomap | 1p36.23 | |
| Gene Type | protein-coding | GO ID | GO:0000003 | UniProtAcc | Q99497 |
Top |
Malignant transformation analysis |
| Identification of the aberrant gene expression in precancerous and cancerous lesions by comparing the gene expression of stem-like cells in diseased tissues with normal stem cells |
| Entrez ID | Symbol | Replicates | Species | Organ | Tissue | Adj P-value | Log2FC | Malignancy |
| 11315 | PARK7 | GSM4909280 | Human | Breast | Precancer | 8.34e-03 | -7.08e-01 | 0.0305 |
| 11315 | PARK7 | GSM4909282 | Human | Breast | IDC | 2.36e-03 | -1.76e-01 | -0.0288 |
| 11315 | PARK7 | GSM4909286 | Human | Breast | IDC | 4.14e-10 | -2.26e-01 | 0.1081 |
| 11315 | PARK7 | GSM4909288 | Human | Breast | IDC | 6.84e-08 | 1.83e-01 | 0.0988 |
| 11315 | PARK7 | GSM4909294 | Human | Breast | IDC | 1.80e-25 | 2.39e-01 | 0.2022 |
| 11315 | PARK7 | GSM4909296 | Human | Breast | IDC | 1.37e-22 | 1.21e-01 | 0.1524 |
| 11315 | PARK7 | GSM4909297 | Human | Breast | IDC | 2.54e-33 | -1.73e-01 | 0.1517 |
| 11315 | PARK7 | GSM4909301 | Human | Breast | IDC | 3.28e-02 | -5.28e-02 | 0.1577 |
| 11315 | PARK7 | GSM4909302 | Human | Breast | IDC | 9.26e-05 | 6.97e-02 | 0.1545 |
| 11315 | PARK7 | GSM4909306 | Human | Breast | IDC | 2.25e-09 | 3.74e-01 | 0.1564 |
| 11315 | PARK7 | GSM4909308 | Human | Breast | IDC | 2.07e-08 | 2.84e-01 | 0.158 |
| 11315 | PARK7 | GSM4909309 | Human | Breast | IDC | 1.85e-05 | -2.13e-02 | 0.0483 |
| 11315 | PARK7 | GSM4909311 | Human | Breast | IDC | 4.07e-67 | -6.99e-01 | 0.1534 |
| 11315 | PARK7 | GSM4909312 | Human | Breast | IDC | 1.30e-28 | -4.53e-01 | 0.1552 |
| 11315 | PARK7 | GSM4909313 | Human | Breast | IDC | 2.19e-02 | -1.80e-01 | 0.0391 |
| 11315 | PARK7 | GSM4909315 | Human | Breast | IDC | 4.09e-04 | 8.67e-02 | 0.21 |
| 11315 | PARK7 | GSM4909316 | Human | Breast | IDC | 4.23e-12 | 1.80e-01 | 0.21 |
| 11315 | PARK7 | GSM4909318 | Human | Breast | IDC | 1.42e-09 | 3.34e-01 | 0.2031 |
| 11315 | PARK7 | GSM4909319 | Human | Breast | IDC | 1.81e-78 | -5.18e-01 | 0.1563 |
| 11315 | PARK7 | GSM4909320 | Human | Breast | IDC | 2.30e-05 | -3.39e-01 | 0.1575 |
| Page: 1 2 3 4 5 6 7 8 9 10 11 12 13 14 15 |
| Tissue | Expression Dynamics | Abbreviation |
| Breast | 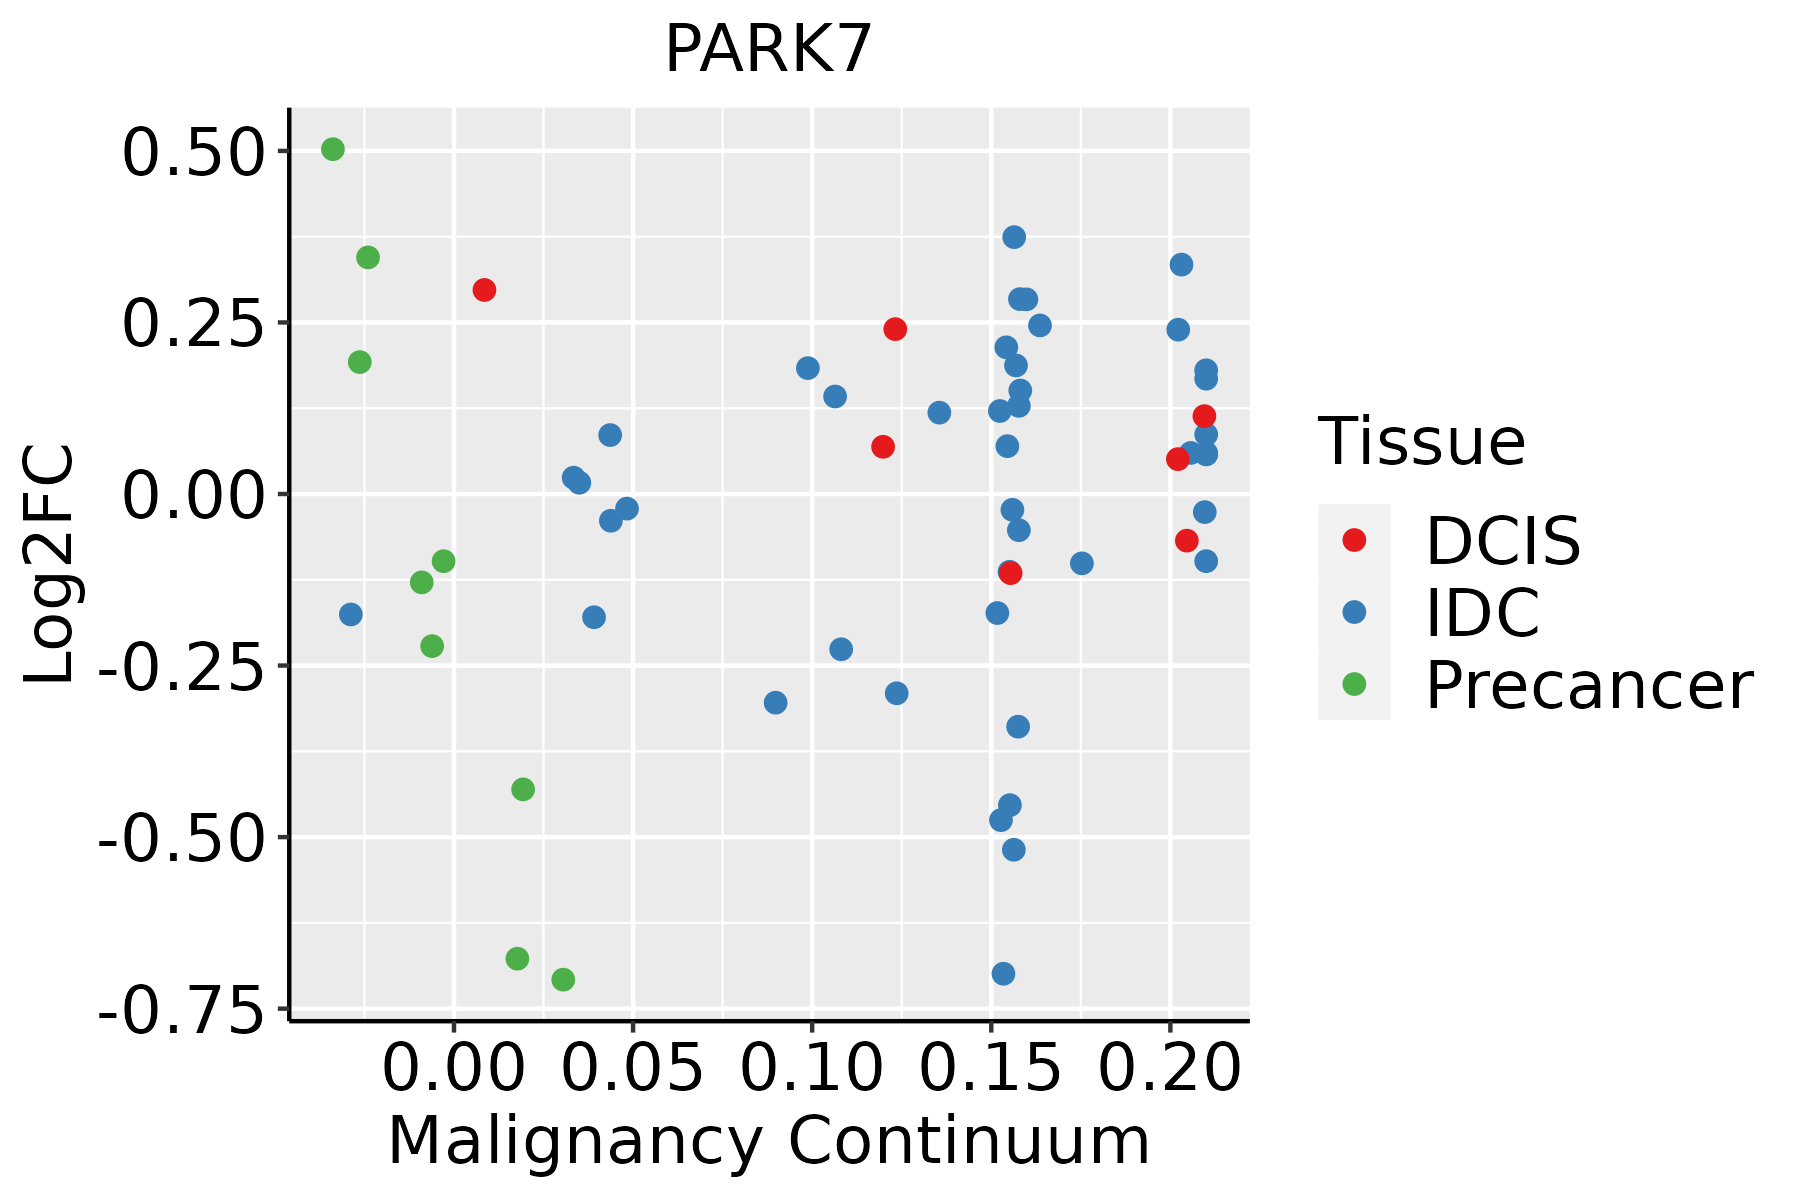 | IDC: Invasive ductal carcinoma |
| DCIS: Ductal carcinoma in situ | ||
| Precancer(BRCA1-mut): Precancerous lesion from BRCA1 mutation carriers | ||
| Cervix | 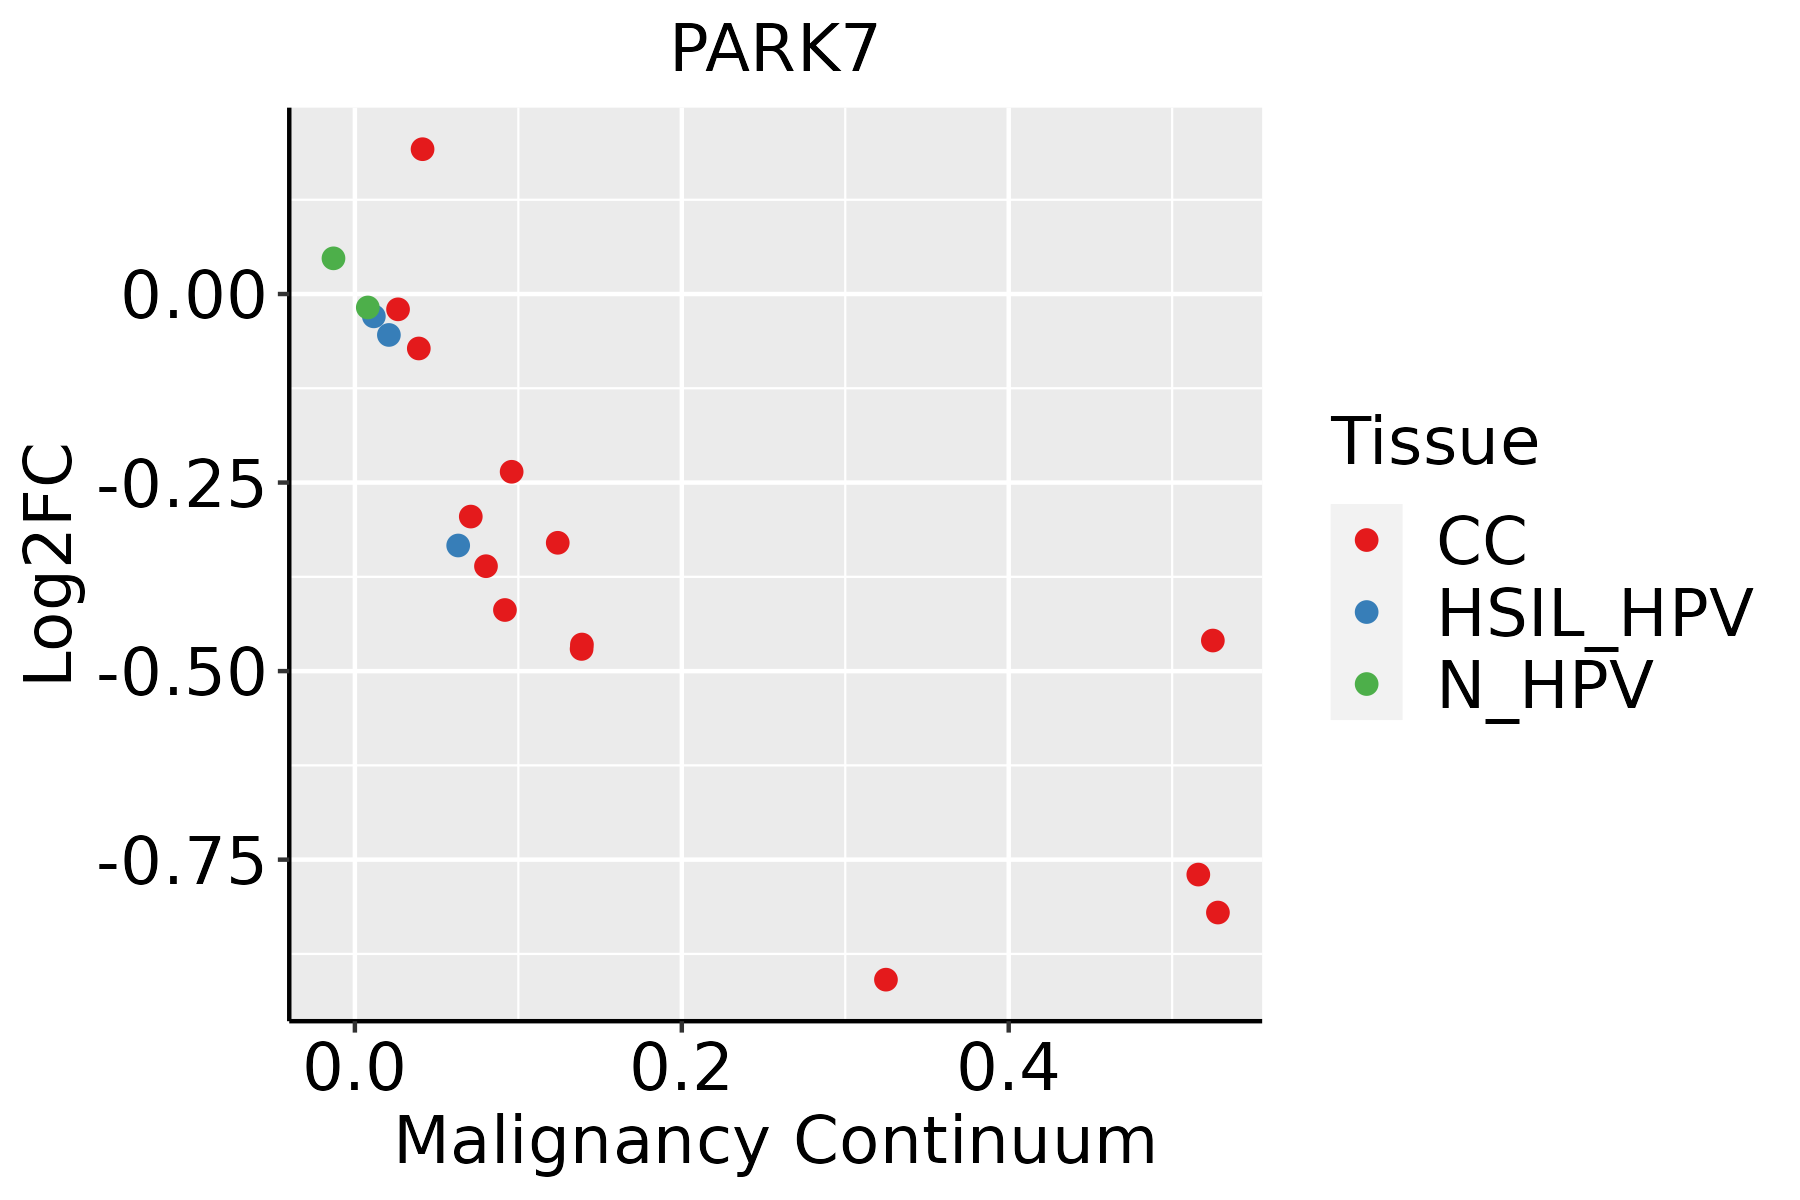 | CC: Cervix cancer |
| HSIL_HPV: HPV-infected high-grade squamous intraepithelial lesions | ||
| N_HPV: HPV-infected normal cervix | ||
| Colorectum (GSE201348) |  | FAP: Familial adenomatous polyposis |
| CRC: Colorectal cancer | ||
| Colorectum (HTA11) |  | AD: Adenomas |
| SER: Sessile serrated lesions | ||
| MSI-H: Microsatellite-high colorectal cancer | ||
| MSS: Microsatellite stable colorectal cancer | ||
| Endometrium | 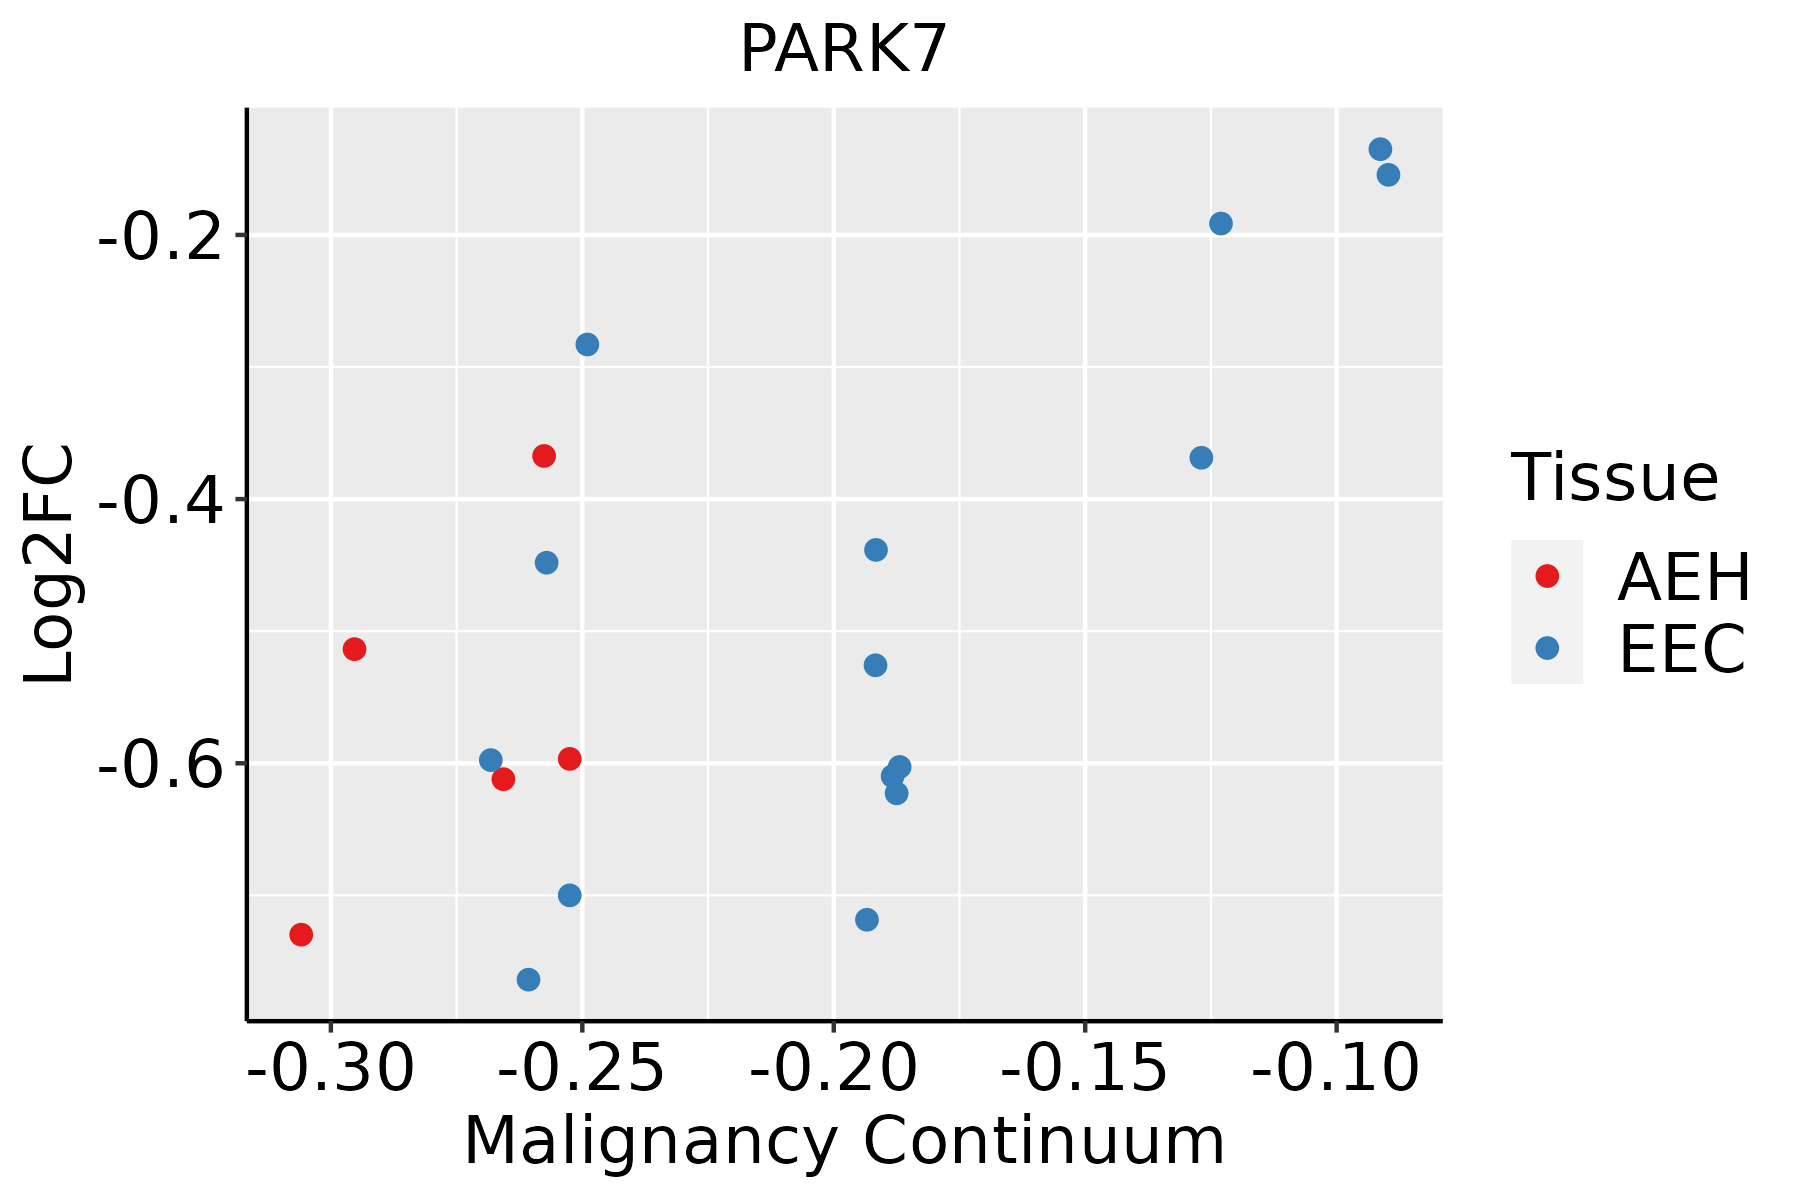 | AEH: Atypical endometrial hyperplasia |
| EEC: Endometrioid Cancer | ||
| Esophagus | 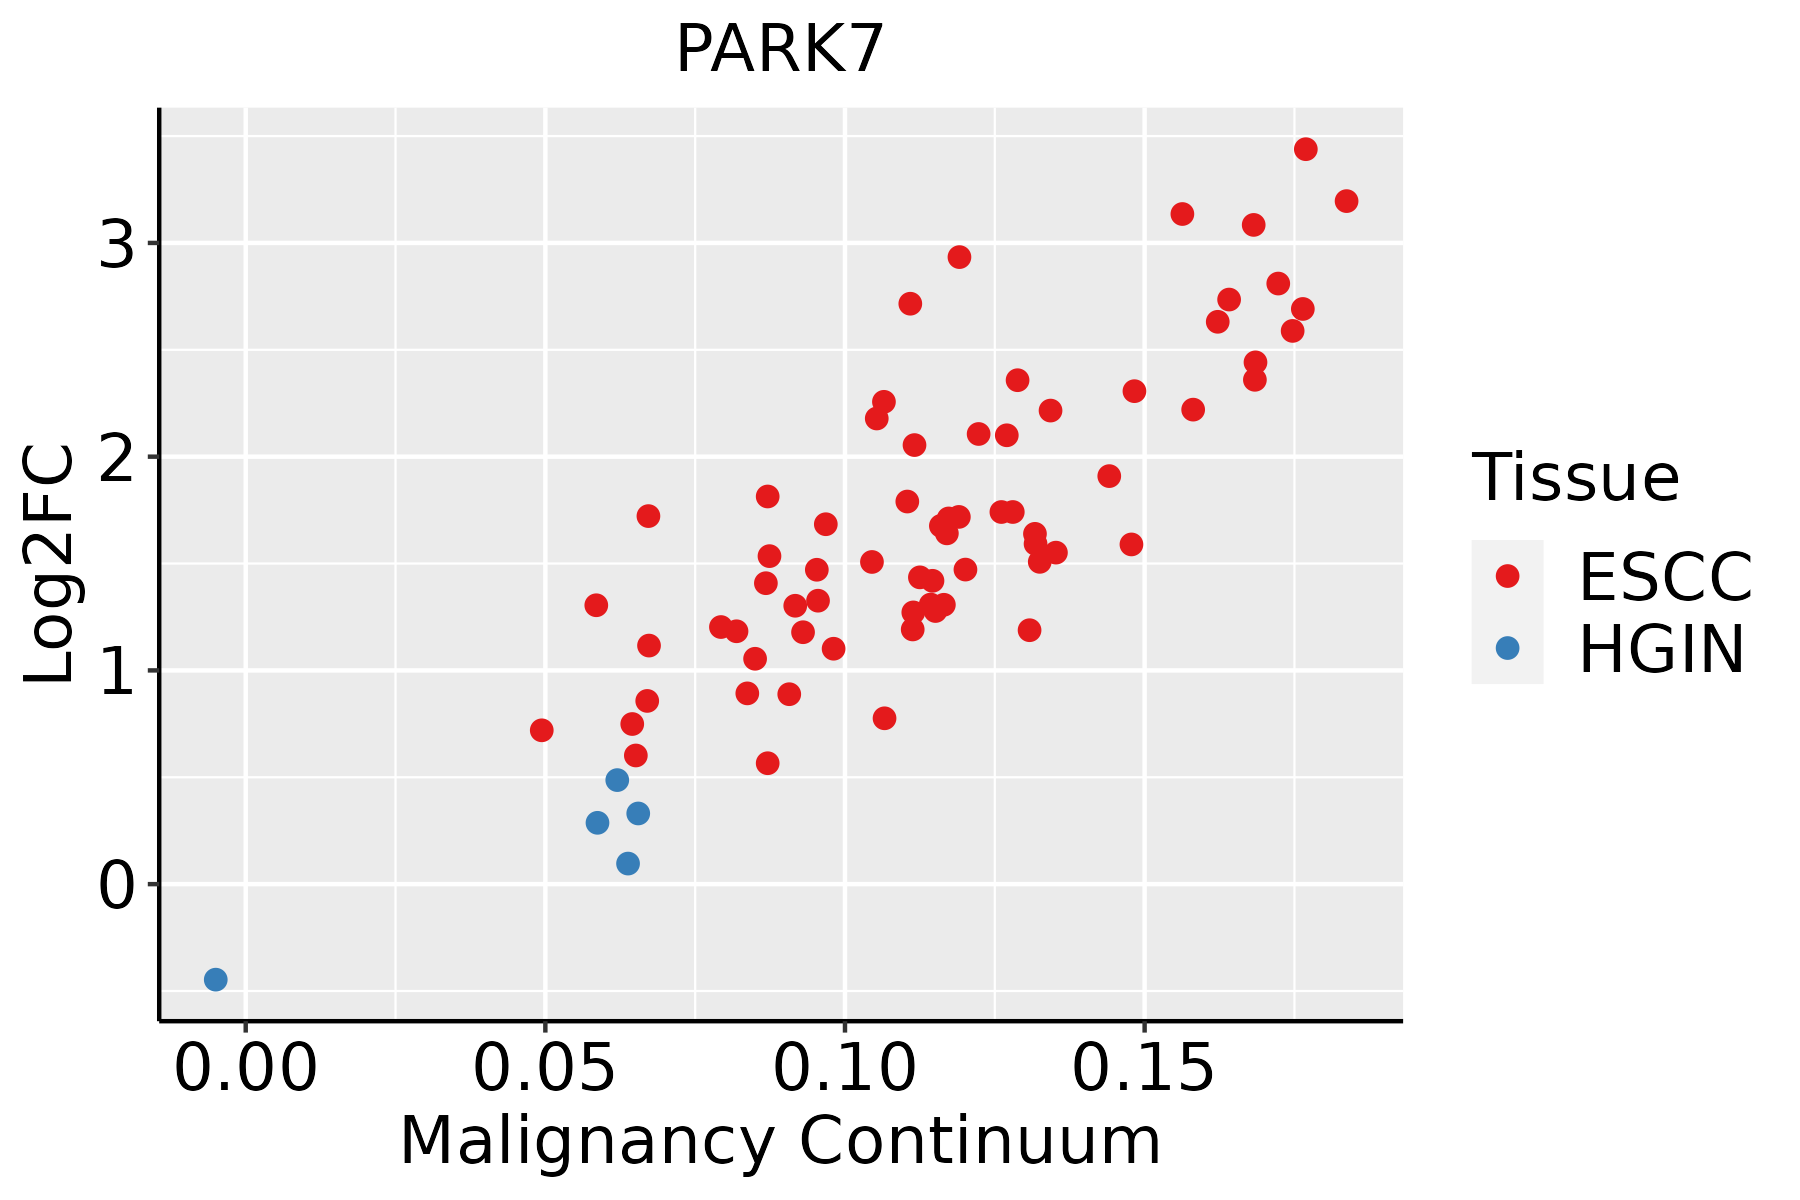 | ESCC: Esophageal squamous cell carcinoma |
| HGIN: High-grade intraepithelial neoplasias | ||
| LGIN: Low-grade intraepithelial neoplasias | ||
| GC |  | CAG: Chronic atrophic gastritis |
| CAG with IM: Chronic atrophic gastritis with intestinal metaplasia | ||
| CSG: Chronic superficial gastritis | ||
| GC: Gastric cancer | ||
| SIM: Severe intestinal metaplasia | ||
| WIM: Wild intestinal metaplasia | ||
| Liver |  | HCC: Hepatocellular carcinoma |
| NAFLD: Non-alcoholic fatty liver disease | ||
| Oral Cavity | 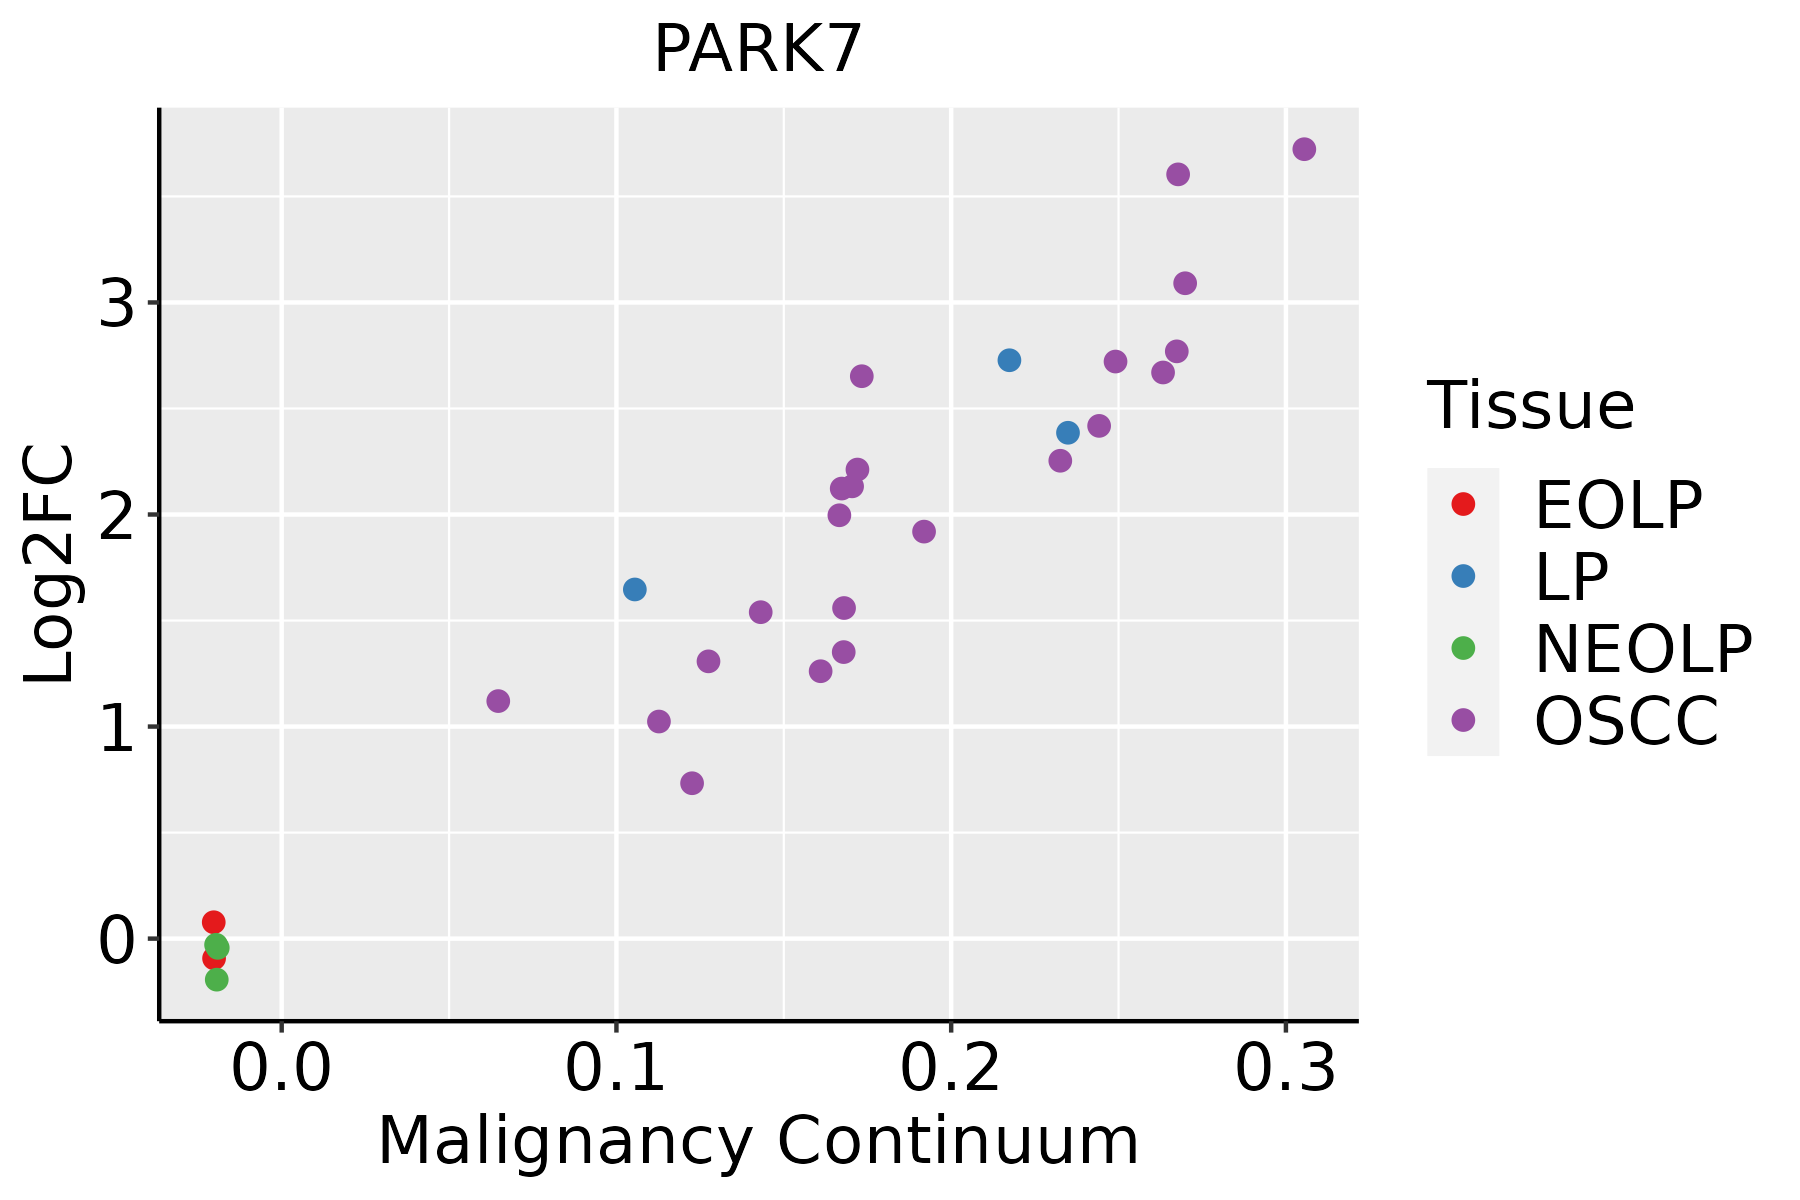 | EOLP: Erosive Oral lichen planus |
| LP: leukoplakia | ||
| NEOLP: Non-erosive oral lichen planus | ||
| OSCC: Oral squamous cell carcinoma | ||
| Prostate |  | BPH: Benign Prostatic Hyperplasia |
| Skin | 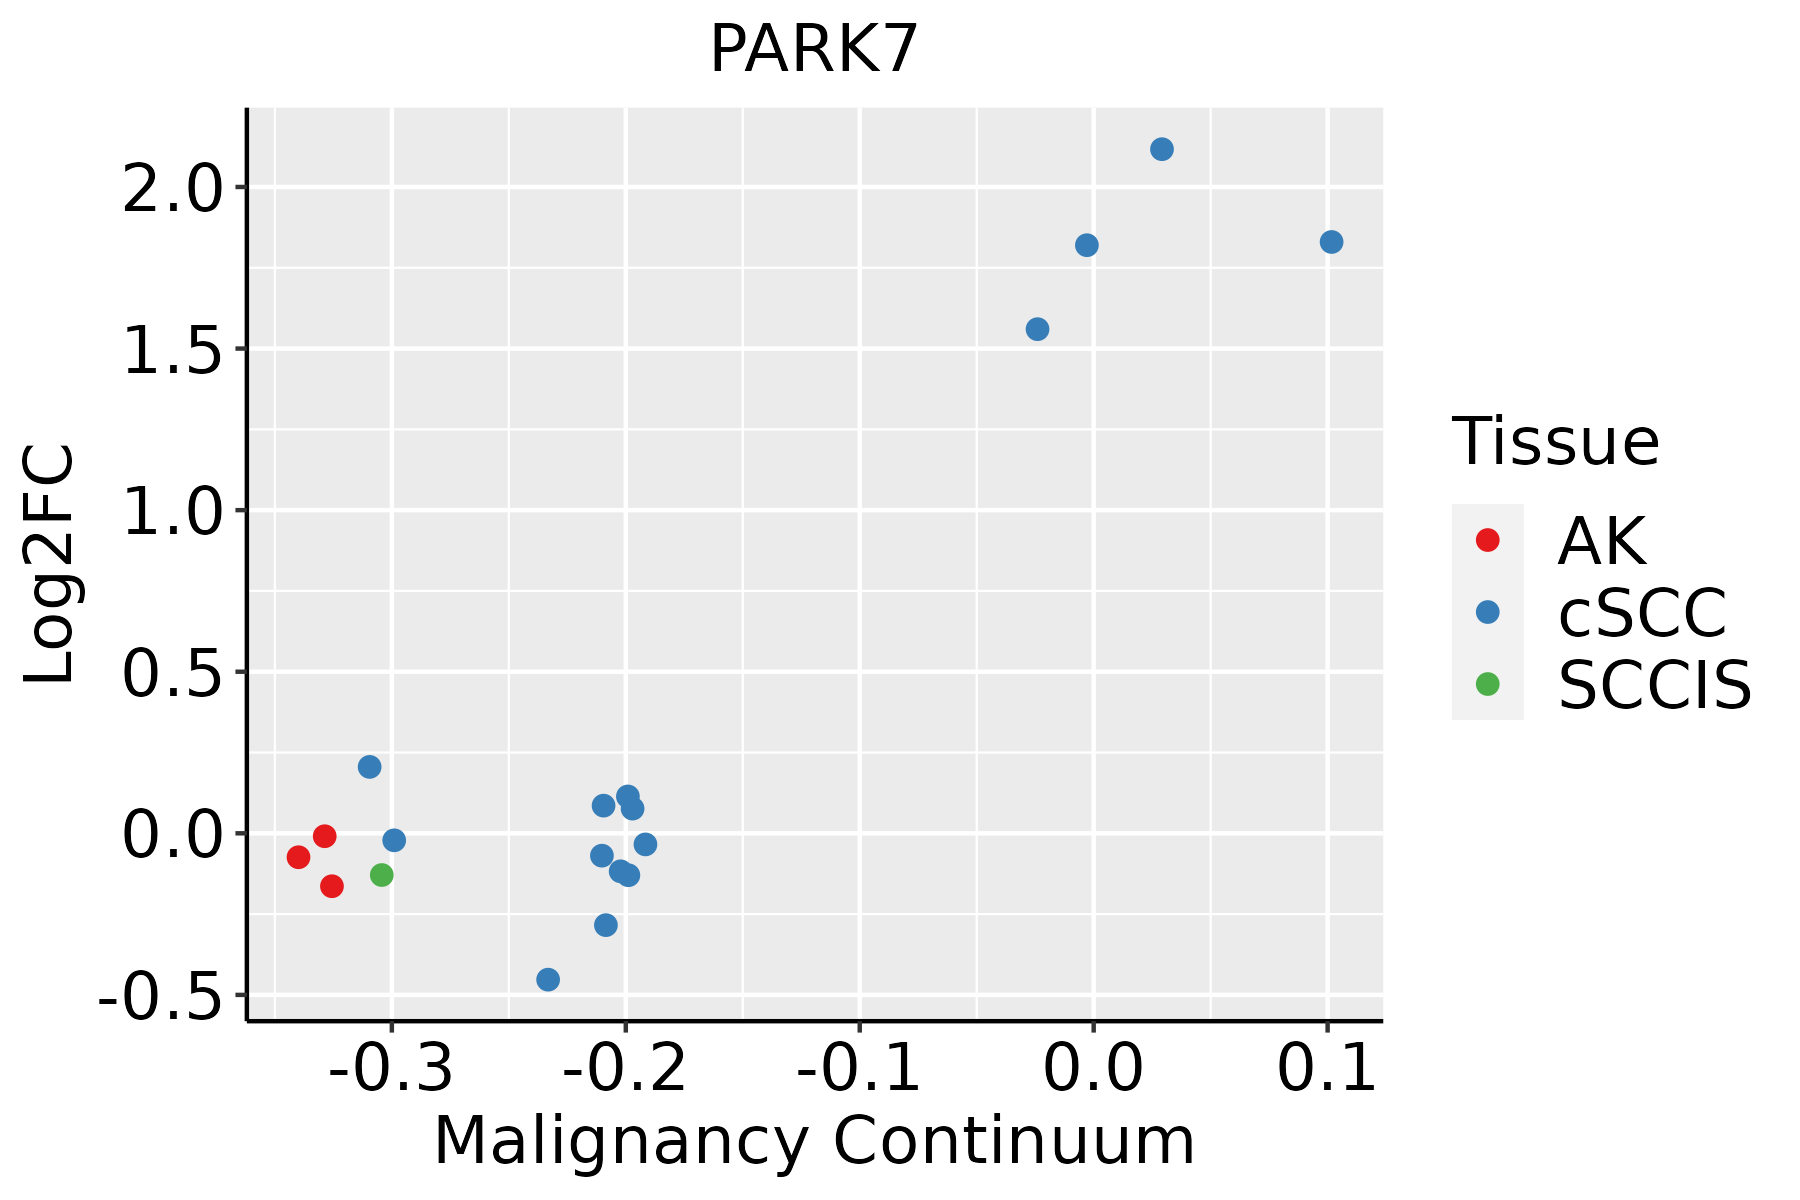 | AK: Actinic keratosis |
| cSCC: Cutaneous squamous cell carcinoma | ||
| SCCIS:squamous cell carcinoma in situ | ||
| Thyroid |  | ATC: Anaplastic thyroid cancer |
| HT: Hashimoto's thyroiditis | ||
| PTC: Papillary thyroid cancer |
| ∗log2FC in expression of this searched gene in stem-like cells from each diseased tissue sample relative to stem-like cells in normal samples in each tissue plotted against the malignancy continuum. Samples are colored based on if they are from different disease stage. |
Top |
Malignant transformation related pathway analysis |
| Find out the enriched GO biological processes and KEGG pathways involved in transition from healthy to precancer to cancer |
| Tissue | Disease Stage | Enriched GO biological Processes |
| Colorectum | AD |  |
| Colorectum | SER |  |
| Colorectum | MSS |  |
| Colorectum | MSI-H |  |
| Colorectum | FAP |  |
| ∗Top 15 enriched GO BP terms are showed in the bar plot of each disease state in each tissue. Each row represents a significant GO biological process which is colored according to the -log10(p.adjust). |
| Page: 1 2 3 4 5 6 7 8 9 |
| GO ID | Tissue | Disease Stage | Description | Gene Ratio | Bg Ratio | pvalue | p.adjust | Count |
| GO:00460349 | Breast | Precancer | ATP metabolic process | 82/1080 | 277/18723 | 1.94e-36 | 5.19e-33 | 82 |
| GO:00061199 | Breast | Precancer | oxidative phosphorylation | 53/1080 | 141/18723 | 1.15e-29 | 2.04e-26 | 53 |
| GO:00090608 | Breast | Precancer | aerobic respiration | 58/1080 | 189/18723 | 5.69e-27 | 7.62e-24 | 58 |
| GO:00060918 | Breast | Precancer | generation of precursor metabolites and energy | 94/1080 | 490/18723 | 1.54e-25 | 1.64e-22 | 94 |
| GO:00453338 | Breast | Precancer | cellular respiration | 59/1080 | 230/18723 | 5.97e-23 | 5.32e-20 | 59 |
| GO:00159808 | Breast | Precancer | energy derivation by oxidation of organic compounds | 70/1080 | 318/18723 | 8.33e-23 | 6.37e-20 | 70 |
| GO:00196468 | Breast | Precancer | aerobic electron transport chain | 34/1080 | 87/18723 | 3.95e-20 | 2.64e-17 | 34 |
| GO:00427738 | Breast | Precancer | ATP synthesis coupled electron transport | 35/1080 | 95/18723 | 1.08e-19 | 5.76e-17 | 35 |
| GO:00427758 | Breast | Precancer | mitochondrial ATP synthesis coupled electron transport | 35/1080 | 95/18723 | 1.08e-19 | 5.76e-17 | 35 |
| GO:00971939 | Breast | Precancer | intrinsic apoptotic signaling pathway | 59/1080 | 288/18723 | 8.07e-18 | 3.60e-15 | 59 |
| GO:20012339 | Breast | Precancer | regulation of apoptotic signaling pathway | 65/1080 | 356/18723 | 7.70e-17 | 3.17e-14 | 65 |
| GO:00229048 | Breast | Precancer | respiratory electron transport chain | 35/1080 | 114/18723 | 8.51e-17 | 3.26e-14 | 35 |
| GO:20012429 | Breast | Precancer | regulation of intrinsic apoptotic signaling pathway | 41/1080 | 164/18723 | 6.48e-16 | 2.31e-13 | 41 |
| GO:00229008 | Breast | Precancer | electron transport chain | 42/1080 | 175/18723 | 1.37e-15 | 4.59e-13 | 42 |
| GO:19026008 | Breast | Precancer | proton transmembrane transport | 39/1080 | 157/18723 | 4.18e-15 | 1.18e-12 | 39 |
| GO:00069799 | Breast | Precancer | response to oxidative stress | 70/1080 | 446/18723 | 1.59e-14 | 4.26e-12 | 70 |
| GO:00525479 | Breast | Precancer | regulation of peptidase activity | 71/1080 | 461/18723 | 2.72e-14 | 6.94e-12 | 71 |
| GO:00525489 | Breast | Precancer | regulation of endopeptidase activity | 67/1080 | 432/18723 | 1.06e-13 | 2.36e-11 | 67 |
| GO:20001169 | Breast | Precancer | regulation of cysteine-type endopeptidase activity | 43/1080 | 235/18723 | 1.30e-11 | 1.83e-09 | 43 |
| GO:00432819 | Breast | Precancer | regulation of cysteine-type endopeptidase activity involved in apoptotic process | 40/1080 | 209/18723 | 1.59e-11 | 2.07e-09 | 40 |
| Pathway ID | Tissue | Disease Stage | Description | Gene Ratio | Bg Ratio | pvalue | p.adjust | qvalue | Count |
| hsa0501218 | Breast | Precancer | Parkinson disease | 99/684 | 266/8465 | 3.58e-42 | 5.65e-40 | 4.33e-40 | 99 |
| hsa0502216 | Breast | Precancer | Pathways of neurodegeneration - multiple diseases | 112/684 | 476/8465 | 6.96e-27 | 2.44e-25 | 1.87e-25 | 112 |
| hsa0501219 | Breast | Precancer | Parkinson disease | 99/684 | 266/8465 | 3.58e-42 | 5.65e-40 | 4.33e-40 | 99 |
| hsa0502217 | Breast | Precancer | Pathways of neurodegeneration - multiple diseases | 112/684 | 476/8465 | 6.96e-27 | 2.44e-25 | 1.87e-25 | 112 |
| hsa0501224 | Breast | IDC | Parkinson disease | 107/867 | 266/8465 | 2.57e-39 | 8.36e-37 | 6.26e-37 | 107 |
| hsa0502223 | Breast | IDC | Pathways of neurodegeneration - multiple diseases | 116/867 | 476/8465 | 3.63e-20 | 1.18e-18 | 8.82e-19 | 116 |
| hsa0501234 | Breast | IDC | Parkinson disease | 107/867 | 266/8465 | 2.57e-39 | 8.36e-37 | 6.26e-37 | 107 |
| hsa0502233 | Breast | IDC | Pathways of neurodegeneration - multiple diseases | 116/867 | 476/8465 | 3.63e-20 | 1.18e-18 | 8.82e-19 | 116 |
| hsa0501243 | Breast | DCIS | Parkinson disease | 106/846 | 266/8465 | 1.64e-39 | 5.29e-37 | 3.90e-37 | 106 |
| hsa0502243 | Breast | DCIS | Pathways of neurodegeneration - multiple diseases | 114/846 | 476/8465 | 4.74e-20 | 1.53e-18 | 1.13e-18 | 114 |
| hsa0501253 | Breast | DCIS | Parkinson disease | 106/846 | 266/8465 | 1.64e-39 | 5.29e-37 | 3.90e-37 | 106 |
| hsa0502253 | Breast | DCIS | Pathways of neurodegeneration - multiple diseases | 114/846 | 476/8465 | 4.74e-20 | 1.53e-18 | 1.13e-18 | 114 |
| hsa0501220 | Cervix | CC | Parkinson disease | 102/1267 | 266/8465 | 1.81e-21 | 1.47e-19 | 8.66e-20 | 102 |
| hsa0502218 | Cervix | CC | Pathways of neurodegeneration - multiple diseases | 128/1267 | 476/8465 | 2.87e-12 | 9.29e-11 | 5.50e-11 | 128 |
| hsa05012110 | Cervix | CC | Parkinson disease | 102/1267 | 266/8465 | 1.81e-21 | 1.47e-19 | 8.66e-20 | 102 |
| hsa0502219 | Cervix | CC | Pathways of neurodegeneration - multiple diseases | 128/1267 | 476/8465 | 2.87e-12 | 9.29e-11 | 5.50e-11 | 128 |
| hsa0501225 | Cervix | HSIL_HPV | Parkinson disease | 43/459 | 266/8465 | 6.69e-11 | 6.53e-09 | 5.28e-09 | 43 |
| hsa0502224 | Cervix | HSIL_HPV | Pathways of neurodegeneration - multiple diseases | 46/459 | 476/8465 | 8.10e-05 | 1.08e-03 | 8.72e-04 | 46 |
| hsa0501235 | Cervix | HSIL_HPV | Parkinson disease | 43/459 | 266/8465 | 6.69e-11 | 6.53e-09 | 5.28e-09 | 43 |
| hsa0502234 | Cervix | HSIL_HPV | Pathways of neurodegeneration - multiple diseases | 46/459 | 476/8465 | 8.10e-05 | 1.08e-03 | 8.72e-04 | 46 |
| Page: 1 2 3 4 5 6 |
Top |
Cell-cell communication analysis |
| Identification of potential cell-cell interactions between two cell types and their ligand-receptor pairs for different disease states |
| Ligand | Receptor | LRpair | Pathway | Tissue | Disease Stage |
| Page: 1 |
Top |
Single-cell gene regulatory network inference analysis |
| Find out the significant the regulons (TFs) and the target genes of each regulon across cell types for different disease states |
| TF | Cell Type | Tissue | Disease Stage | Target Gene | RSS | Regulon Activity |
| ∗The dot plots of a searched regulon are shown for all cell subpopulations in each disease state of each tissue based on the regulon specific score inferred using pySCENIC and by calculating the average expression. |
| Page: 1 |
Top |
Somatic mutation of malignant transformation related genes |
| Annotation of somatic variants for genes involved in malignant transformation |
| Hugo Symbol | Variant Class | Variant Classification | dbSNP RS | HGVSc | HGVSp | HGVSp Short | SWISSPROT | BIOTYPE | SIFT | PolyPhen | Tumor Sample Barcode | Tissue | Histology | Sex | Age | Stage | Therapy Types | Drugs | Outcome |
| PARK7 | SNV | Missense_Mutation | novel | c.473C>A | p.Pro158His | p.P158H | Q99497 | protein_coding | deleterious(0) | probably_damaging(0.999) | TCGA-2W-A8YY-01 | Cervix | cervical & endocervical cancer | Female | <65 | I/II | Chemotherapy | cisplatin | CR |
| PARK7 | SNV | Missense_Mutation | rs145727915 | c.143N>A | p.Arg48His | p.R48H | Q99497 | protein_coding | deleterious(0) | possibly_damaging(0.456) | TCGA-AA-A01R-01 | Colorectum | colon adenocarcinoma | Male | <65 | III/IV | Chemotherapy | 5-fluorouracil | PD |
| PARK7 | insertion | Frame_Shift_Ins | rs759703272 | c.182_183insA | p.Glu64ArgfsTer5 | p.E64Rfs*5 | Q99497 | protein_coding | TCGA-AD-A5EJ-01 | Colorectum | colon adenocarcinoma | Female | >=65 | I/II | Unknown | Unknown | SD | ||
| PARK7 | SNV | Missense_Mutation | novel | c.254N>A | p.Ser85Tyr | p.S85Y | Q99497 | protein_coding | deleterious(0) | probably_damaging(0.979) | TCGA-AX-A06F-01 | Endometrium | uterine corpus endometrioid carcinoma | Female | <65 | III/IV | Chemotherapy | carboplatin | SD |
| PARK7 | SNV | Missense_Mutation | rs758016497 | c.56C>T | p.Thr19Met | p.T19M | Q99497 | protein_coding | tolerated(0.17) | benign(0.44) | TCGA-B5-A11J-01 | Endometrium | uterine corpus endometrioid carcinoma | Female | <65 | I/II | Unknown | Unknown | SD |
| PARK7 | SNV | Missense_Mutation | rs371514726 | c.494C>T | p.Ala165Val | p.A165V | Q99497 | protein_coding | deleterious(0.01) | benign(0.264) | TCGA-B5-A3FC-01 | Endometrium | uterine corpus endometrioid carcinoma | Female | <65 | I/II | Unknown | Unknown | SD |
| PARK7 | SNV | Missense_Mutation | rs182164240 | c.292C>T | p.Arg98Trp | p.R98W | Q99497 | protein_coding | tolerated(0.06) | benign(0.022) | TCGA-BS-A0UA-01 | Endometrium | uterine corpus endometrioid carcinoma | Female | >=65 | I/II | Unknown | Unknown | PD |
| PARK7 | SNV | Missense_Mutation | novel | c.412N>T | p.His138Tyr | p.H138Y | Q99497 | protein_coding | tolerated(0.24) | benign(0.013) | TCGA-D1-A175-01 | Endometrium | uterine corpus endometrioid carcinoma | Female | <65 | I/II | Chemotherapy | paclitaxel | SD |
| PARK7 | SNV | Missense_Mutation | novel | c.355T>G | p.Phe119Val | p.F119V | Q99497 | protein_coding | tolerated(0.52) | benign(0.003) | TCGA-EO-A22X-01 | Endometrium | uterine corpus endometrioid carcinoma | Female | <65 | III/IV | Unspecific | Carboplatin | Complete Response |
| PARK7 | SNV | Missense_Mutation | rs768782230 | c.433N>T | p.Arg145Cys | p.R145C | Q99497 | protein_coding | deleterious(0) | probably_damaging(0.948) | TCGA-EO-A3AY-01 | Endometrium | uterine corpus endometrioid carcinoma | Female | <65 | I/II | Unknown | Unknown | PD |
| Page: 1 2 |
Top |
Related drugs of malignant transformation related genes |
| Identification of chemicals and drugs interact with genes involved in malignant transfromation |
| (DGIdb 4.0) |
| Entrez ID | Symbol | Category | Interaction Types | Drug Claim Name | Drug Name | PMIDs |
| Page: 1 |

Copyright 2023-Present -The University of Texas Health Science Center at Houston |