
|
|||||
|
 | |
| |
| |
| |
| |
| |
|
Gene: PARK2 |
Gene summary for PARK2 |
| Gene information | Species | Human | Gene symbol | PARK2 | Gene ID | 5071 |
| Gene name | parkin RBR E3 ubiquitin protein ligase | |
| Gene Alias | AR-JP | |
| Cytomap | 6q26 | |
| Gene Type | protein-coding | GO ID | GO:0000122 | UniProtAcc | O60260 |
Top |
Malignant transformation analysis |
| Identification of the aberrant gene expression in precancerous and cancerous lesions by comparing the gene expression of stem-like cells in diseased tissues with normal stem cells |
| Entrez ID | Symbol | Replicates | Species | Organ | Tissue | Adj P-value | Log2FC | Malignancy |
| 5071 | PARK2 | HTA11_99999970781_79442 | Human | Colorectum | MSS | 1.21e-39 | 6.68e-01 | 0.294 |
| 5071 | PARK2 | HTA11_99999965062_69753 | Human | Colorectum | MSI-H | 1.91e-08 | 9.63e-01 | 0.3487 |
| 5071 | PARK2 | HTA11_99999965104_69814 | Human | Colorectum | MSS | 1.30e-49 | 1.38e+00 | 0.281 |
| 5071 | PARK2 | HTA11_99999971662_82457 | Human | Colorectum | MSS | 1.37e-47 | 8.89e-01 | 0.3859 |
| 5071 | PARK2 | HTA11_99999973899_84307 | Human | Colorectum | MSS | 3.35e-11 | 4.71e-01 | 0.2585 |
| 5071 | PARK2 | HTA11_99999974143_84620 | Human | Colorectum | MSS | 5.24e-29 | 5.39e-01 | 0.3005 |
| 5071 | PARK2 | HCC1_Meng | Human | Liver | HCC | 1.27e-07 | 1.44e-02 | 0.0246 |
| 5071 | PARK2 | HCC1 | Human | Liver | HCC | 4.10e-13 | 1.94e+00 | 0.5336 |
| 5071 | PARK2 | HCC2 | Human | Liver | HCC | 3.72e-22 | 1.71e+00 | 0.5341 |
| 5071 | PARK2 | HCC5 | Human | Liver | HCC | 1.13e-19 | 1.09e+00 | 0.4932 |
| Page: 1 |
| Tissue | Expression Dynamics | Abbreviation |
| Colorectum (GSE201348) |  | FAP: Familial adenomatous polyposis |
| CRC: Colorectal cancer | ||
| Colorectum (HTA11) |  | AD: Adenomas |
| SER: Sessile serrated lesions | ||
| MSI-H: Microsatellite-high colorectal cancer | ||
| MSS: Microsatellite stable colorectal cancer | ||
| Endometrium | 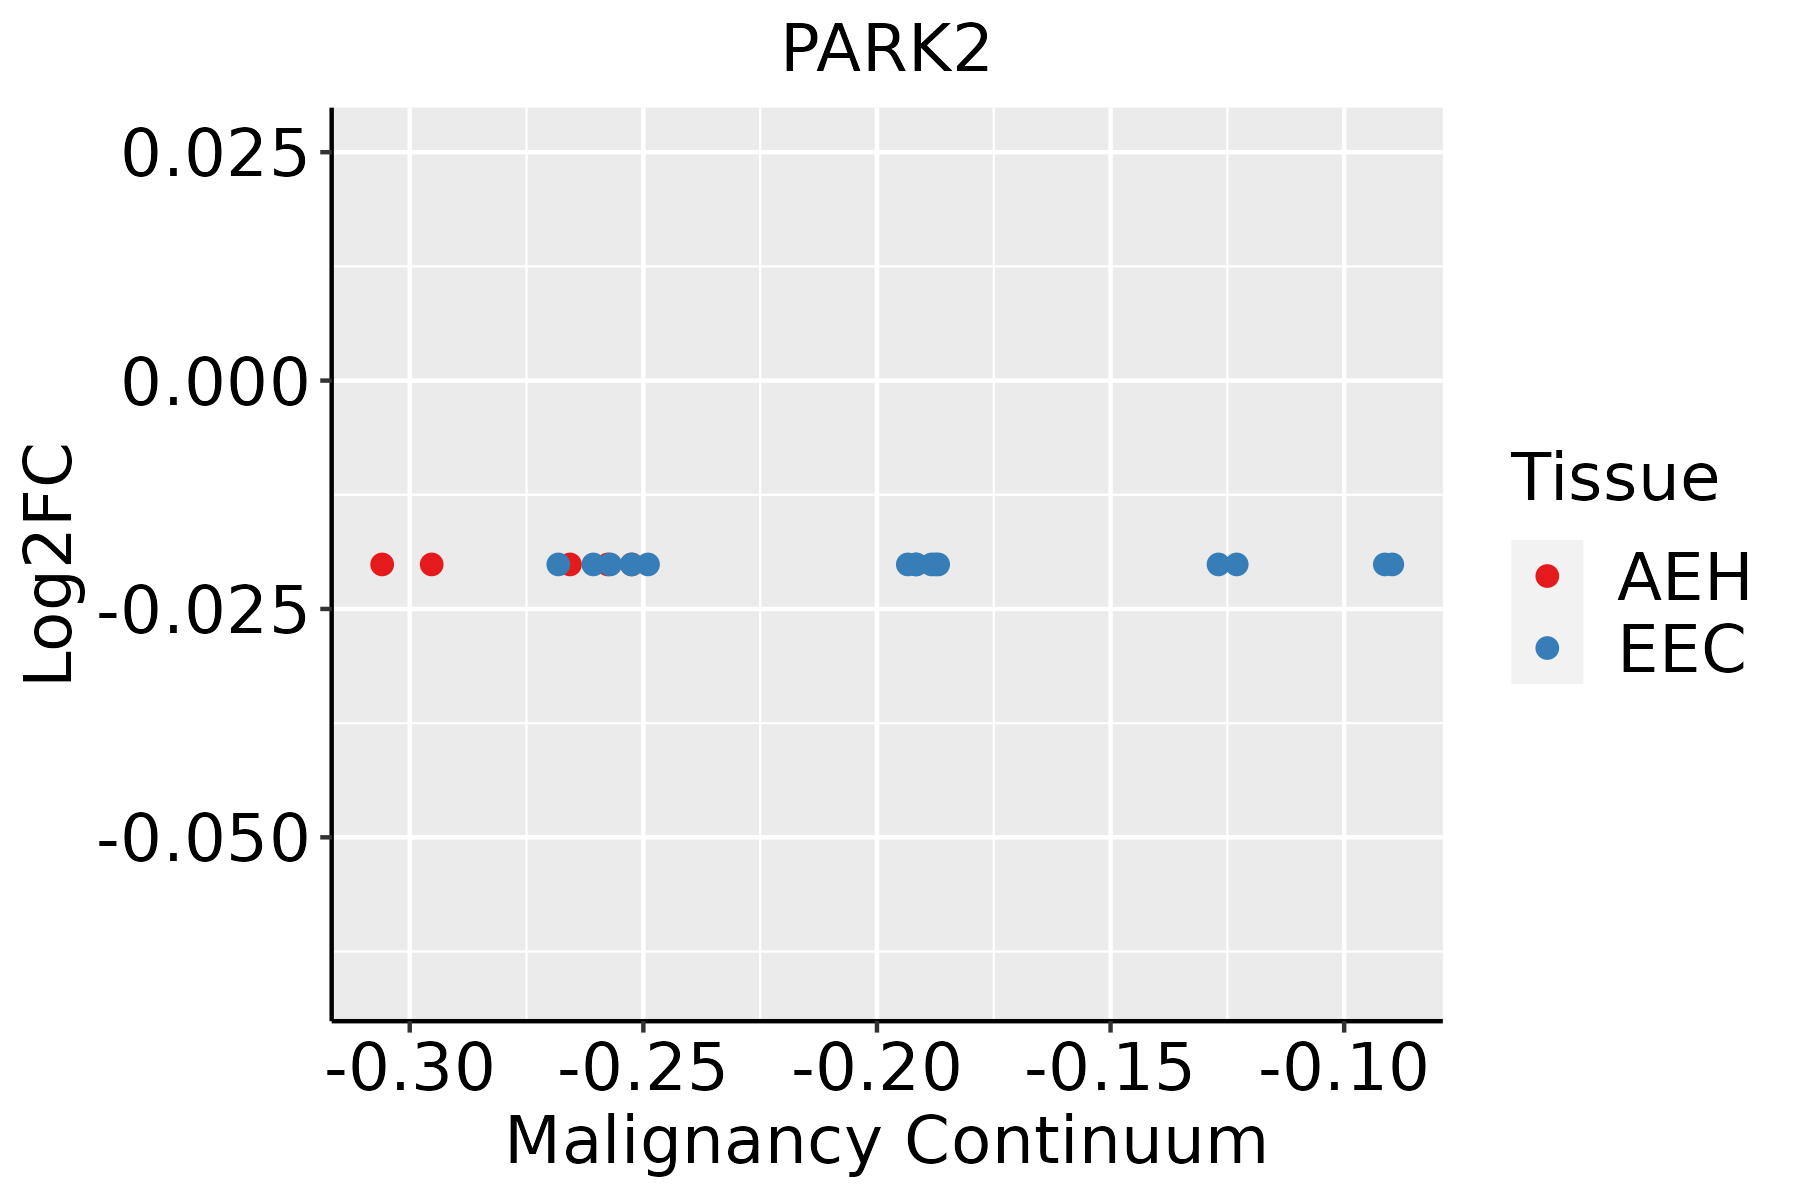 | AEH: Atypical endometrial hyperplasia |
| EEC: Endometrioid Cancer | ||
| Liver | 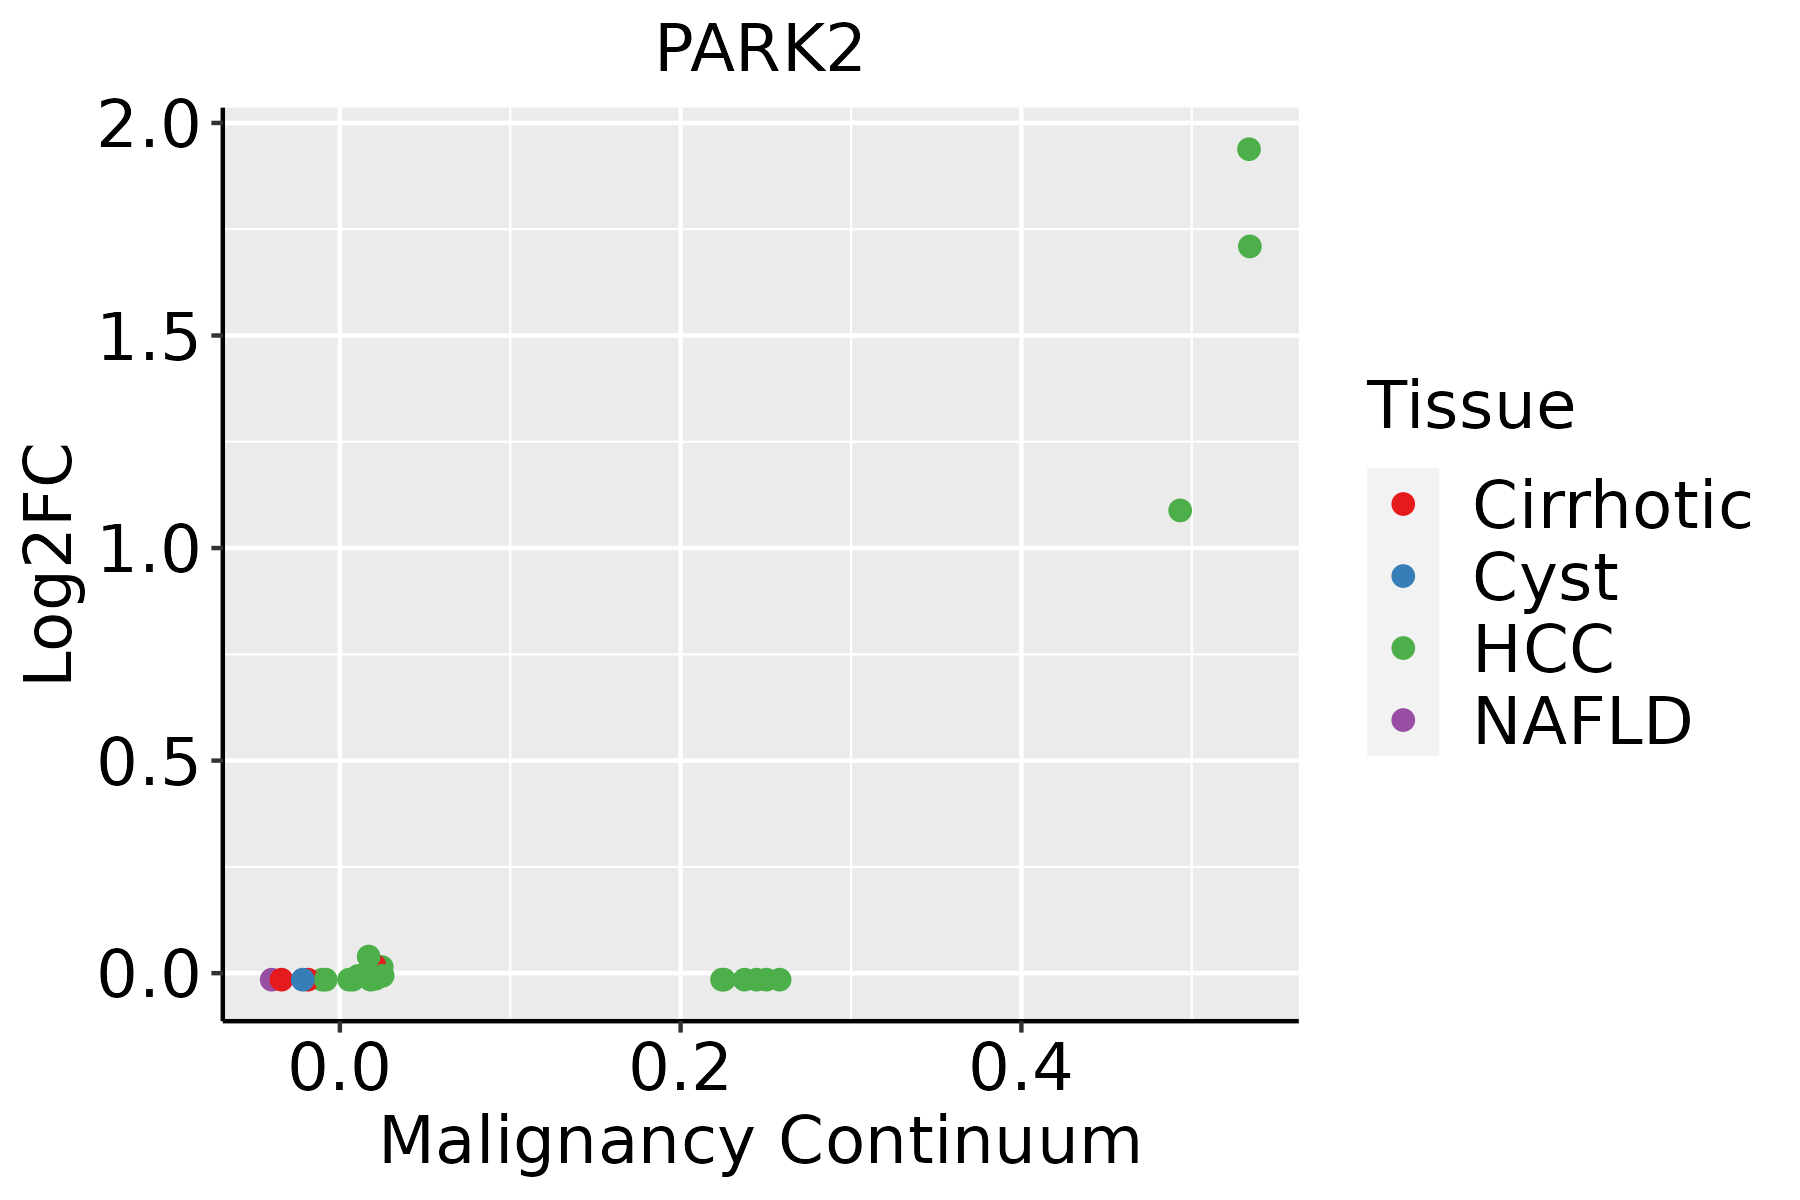 | HCC: Hepatocellular carcinoma |
| NAFLD: Non-alcoholic fatty liver disease |
| ∗log2FC in expression of this searched gene in stem-like cells from each diseased tissue sample relative to stem-like cells in normal samples in each tissue plotted against the malignancy continuum. Samples are colored based on if they are from different disease stage. |
Top |
Malignant transformation related pathway analysis |
| Find out the enriched GO biological processes and KEGG pathways involved in transition from healthy to precancer to cancer |
| Tissue | Disease Stage | Enriched GO biological Processes |
| Colorectum | AD |  |
| Colorectum | SER |  |
| Colorectum | MSS |  |
| Colorectum | MSI-H |  |
| Colorectum | FAP |  |
| ∗Top 15 enriched GO BP terms are showed in the bar plot of each disease state in each tissue. Each row represents a significant GO biological process which is colored according to the -log10(p.adjust). |
| Page: 1 2 3 4 5 6 7 8 9 |
| GO ID | Tissue | Disease Stage | Description | Gene Ratio | Bg Ratio | pvalue | p.adjust | Count |
| Page: 1 |
| Pathway ID | Tissue | Disease Stage | Description | Gene Ratio | Bg Ratio | pvalue | p.adjust | qvalue | Count |
| hsa05012 | Colorectum | AD | Parkinson disease | 147/2092 | 266/8465 | 2.53e-27 | 8.48e-25 | 5.41e-25 | 147 |
| hsa05014 | Colorectum | AD | Amyotrophic lateral sclerosis | 164/2092 | 364/8465 | 4.28e-18 | 1.27e-16 | 8.09e-17 | 164 |
| hsa05022 | Colorectum | AD | Pathways of neurodegeneration - multiple diseases | 201/2092 | 476/8465 | 4.54e-18 | 1.27e-16 | 8.09e-17 | 201 |
| hsa04141 | Colorectum | AD | Protein processing in endoplasmic reticulum | 80/2092 | 174/8465 | 5.96e-10 | 1.25e-08 | 7.96e-09 | 80 |
| hsa04120 | Colorectum | AD | Ubiquitin mediated proteolysis | 58/2092 | 142/8465 | 1.46e-05 | 1.53e-04 | 9.76e-05 | 58 |
| hsa04137 | Colorectum | AD | Mitophagy - animal | 29/2092 | 72/8465 | 2.49e-03 | 1.35e-02 | 8.59e-03 | 29 |
| hsa050121 | Colorectum | AD | Parkinson disease | 147/2092 | 266/8465 | 2.53e-27 | 8.48e-25 | 5.41e-25 | 147 |
| hsa050141 | Colorectum | AD | Amyotrophic lateral sclerosis | 164/2092 | 364/8465 | 4.28e-18 | 1.27e-16 | 8.09e-17 | 164 |
| hsa050221 | Colorectum | AD | Pathways of neurodegeneration - multiple diseases | 201/2092 | 476/8465 | 4.54e-18 | 1.27e-16 | 8.09e-17 | 201 |
| hsa041411 | Colorectum | AD | Protein processing in endoplasmic reticulum | 80/2092 | 174/8465 | 5.96e-10 | 1.25e-08 | 7.96e-09 | 80 |
| hsa041201 | Colorectum | AD | Ubiquitin mediated proteolysis | 58/2092 | 142/8465 | 1.46e-05 | 1.53e-04 | 9.76e-05 | 58 |
| hsa041371 | Colorectum | AD | Mitophagy - animal | 29/2092 | 72/8465 | 2.49e-03 | 1.35e-02 | 8.59e-03 | 29 |
| hsa050222 | Colorectum | SER | Pathways of neurodegeneration - multiple diseases | 168/1580 | 476/8465 | 6.23e-19 | 2.07e-17 | 1.50e-17 | 168 |
| hsa050142 | Colorectum | SER | Amyotrophic lateral sclerosis | 138/1580 | 364/8465 | 9.89e-19 | 2.99e-17 | 2.17e-17 | 138 |
| hsa041412 | Colorectum | SER | Protein processing in endoplasmic reticulum | 60/1580 | 174/8465 | 4.20e-07 | 7.33e-06 | 5.32e-06 | 60 |
| hsa041202 | Colorectum | SER | Ubiquitin mediated proteolysis | 39/1580 | 142/8465 | 6.18e-03 | 3.66e-02 | 2.66e-02 | 39 |
| hsa050223 | Colorectum | SER | Pathways of neurodegeneration - multiple diseases | 168/1580 | 476/8465 | 6.23e-19 | 2.07e-17 | 1.50e-17 | 168 |
| hsa050143 | Colorectum | SER | Amyotrophic lateral sclerosis | 138/1580 | 364/8465 | 9.89e-19 | 2.99e-17 | 2.17e-17 | 138 |
| hsa041413 | Colorectum | SER | Protein processing in endoplasmic reticulum | 60/1580 | 174/8465 | 4.20e-07 | 7.33e-06 | 5.32e-06 | 60 |
| hsa041203 | Colorectum | SER | Ubiquitin mediated proteolysis | 39/1580 | 142/8465 | 6.18e-03 | 3.66e-02 | 2.66e-02 | 39 |
| Page: 1 2 3 4 5 |
Top |
Cell-cell communication analysis |
| Identification of potential cell-cell interactions between two cell types and their ligand-receptor pairs for different disease states |
| Ligand | Receptor | LRpair | Pathway | Tissue | Disease Stage |
| Page: 1 |
Top |
Single-cell gene regulatory network inference analysis |
| Find out the significant the regulons (TFs) and the target genes of each regulon across cell types for different disease states |
| TF | Cell Type | Tissue | Disease Stage | Target Gene | RSS | Regulon Activity |
| ∗The dot plots of a searched regulon are shown for all cell subpopulations in each disease state of each tissue based on the regulon specific score inferred using pySCENIC and by calculating the average expression. |
| Page: 1 |
Top |
Somatic mutation of malignant transformation related genes |
| Annotation of somatic variants for genes involved in malignant transformation |
| Hugo Symbol | Variant Class | Variant Classification | dbSNP RS | HGVSc | HGVSp | HGVSp Short | SWISSPROT | BIOTYPE | SIFT | PolyPhen | Tumor Sample Barcode | Tissue | Histology | Sex | Age | Stage | Therapy Types | Drugs | Outcome |
| PARK2 | SNV | Missense_Mutation | c.1183G>A | p.Glu395Lys | p.E395K | O60260 | protein_coding | tolerated(0.52) | benign(0.003) | TCGA-B6-A0I9-01 | Breast | breast invasive carcinoma | Female | <65 | III/IV | Unknown | Unknown | PD | |
| PARK2 | SNV | Missense_Mutation | novel | c.976C>A | p.Gln326Lys | p.Q326K | O60260 | protein_coding | tolerated(0.21) | possibly_damaging(0.472) | TCGA-B6-A0WS-01 | Breast | breast invasive carcinoma | Female | <65 | I/II | Unknown | Unknown | SD |
| PARK2 | SNV | Missense_Mutation | c.970N>T | p.Val324Phe | p.V324F | O60260 | protein_coding | deleterious(0) | probably_damaging(0.951) | TCGA-BH-A0DX-01 | Breast | breast invasive carcinoma | Female | <65 | I/II | Chemotherapy | taxotere | CR | |
| PARK2 | SNV | Missense_Mutation | c.1205N>C | p.Arg402Pro | p.R402P | O60260 | protein_coding | deleterious(0) | probably_damaging(1) | TCGA-BH-A18V-01 | Breast | breast invasive carcinoma | Female | <65 | I/II | Unknown | Unknown | SD | |
| PARK2 | SNV | Missense_Mutation | c.1041N>C | p.Gln347His | p.Q347H | O60260 | protein_coding | tolerated(0.12) | possibly_damaging(0.643) | TCGA-C8-A1HM-01 | Breast | breast invasive carcinoma | Female | >=65 | I/II | Chemotherapy | doxorubicin | CR | |
| PARK2 | insertion | Nonsense_Mutation | novel | c.1257_1258insTACTAAAAATACAAAAAATTAGCCGGGTGTGGTGGCGGGCGCCTG | p.Pro419_Arg420insTyrTerLysTyrLysLysLeuAlaGlyCysGlyGlyGlyArgLeu | p.P419_R420insY*KYKKLAGCGGGRL | O60260 | protein_coding | TCGA-BH-A0B8-01 | Breast | breast invasive carcinoma | Female | <65 | I/II | Hormone Therapy | arimidex | SD | ||
| PARK2 | SNV | Missense_Mutation | rs529808032 | c.1028N>T | p.Pro343Leu | p.P343L | O60260 | protein_coding | deleterious(0.04) | probably_damaging(0.996) | TCGA-C5-A1MF-01 | Cervix | cervical & endocervical cancer | Female | <65 | I/II | Unknown | Unknown | SD |
| PARK2 | SNV | Missense_Mutation | c.25N>G | p.Ser9Ala | p.S9A | O60260 | protein_coding | tolerated(0.12) | probably_damaging(0.954) | TCGA-EA-A1QT-01 | Cervix | cervical & endocervical cancer | Female | <65 | I/II | Unknown | Unknown | SD | |
| PARK2 | SNV | Missense_Mutation | c.130N>C | p.Ile44Leu | p.I44L | O60260 | protein_coding | tolerated(0.25) | benign(0.085) | TCGA-AA-3710-01 | Colorectum | colon adenocarcinoma | Female | >=65 | I/II | Unknown | Unknown | SD | |
| PARK2 | SNV | Missense_Mutation | c.665N>A | p.Thr222Lys | p.T222K | O60260 | protein_coding | tolerated(0.26) | benign(0.046) | TCGA-AA-3815-01 | Colorectum | colon adenocarcinoma | Female | >=65 | I/II | Unknown | Unknown | SD |
| Page: 1 2 3 4 5 6 7 8 9 |
Top |
Related drugs of malignant transformation related genes |
| Identification of chemicals and drugs interact with genes involved in malignant transfromation |
| (DGIdb 4.0) |
| Entrez ID | Symbol | Category | Interaction Types | Drug Claim Name | Drug Name | PMIDs |
| Page: 1 |

Copyright 2023-Present -The University of Texas Health Science Center at Houston |