
|
|||||
|
 | |
| |
| |
| |
| |
| |
|
Gene: PARG |
Gene summary for PARG |
| Gene information | Species | Human | Gene symbol | PARG | Gene ID | 8505 |
| Gene name | poly(ADP-ribose) glycohydrolase | |
| Gene Alias | PARG99 | |
| Cytomap | 10q11.23 | |
| Gene Type | protein-coding | GO ID | GO:0005975 | UniProtAcc | Q86W56 |
Top |
Malignant transformation analysis |
| Identification of the aberrant gene expression in precancerous and cancerous lesions by comparing the gene expression of stem-like cells in diseased tissues with normal stem cells |
| Entrez ID | Symbol | Replicates | Species | Organ | Tissue | Adj P-value | Log2FC | Malignancy |
| 8505 | PARG | CCI_2 | Human | Cervix | CC | 2.59e-07 | 1.00e+00 | 0.5249 |
| 8505 | PARG | CCI_3 | Human | Cervix | CC | 4.25e-06 | 5.15e-01 | 0.516 |
| 8505 | PARG | HTA11_3410_2000001011 | Human | Colorectum | AD | 1.58e-07 | -4.40e-01 | 0.0155 |
| 8505 | PARG | HTA11_2951_2000001011 | Human | Colorectum | AD | 3.65e-03 | -6.67e-01 | 0.0216 |
| 8505 | PARG | HTA11_3361_2000001011 | Human | Colorectum | AD | 2.05e-04 | -5.33e-01 | -0.1207 |
| 8505 | PARG | HTA11_696_2000001011 | Human | Colorectum | AD | 5.48e-11 | -4.35e-01 | -0.1464 |
| 8505 | PARG | HTA11_866_2000001011 | Human | Colorectum | AD | 4.32e-07 | -3.74e-01 | -0.1001 |
| 8505 | PARG | HTA11_866_3004761011 | Human | Colorectum | AD | 5.60e-08 | -5.25e-01 | 0.096 |
| 8505 | PARG | HTA11_7696_3000711011 | Human | Colorectum | AD | 1.11e-13 | -5.01e-01 | 0.0674 |
| 8505 | PARG | HTA11_99999971662_82457 | Human | Colorectum | MSS | 1.50e-06 | -3.68e-01 | 0.3859 |
| 8505 | PARG | HTA11_99999974143_84620 | Human | Colorectum | MSS | 2.85e-15 | -5.01e-01 | 0.3005 |
| 8505 | PARG | A015-C-203 | Human | Colorectum | FAP | 1.83e-22 | -2.58e-01 | -0.1294 |
| 8505 | PARG | A015-C-204 | Human | Colorectum | FAP | 3.06e-02 | -2.33e-01 | -0.0228 |
| 8505 | PARG | A014-C-040 | Human | Colorectum | FAP | 3.83e-02 | -3.42e-01 | -0.1184 |
| 8505 | PARG | A002-C-201 | Human | Colorectum | FAP | 7.76e-07 | -2.23e-01 | 0.0324 |
| 8505 | PARG | A002-C-203 | Human | Colorectum | FAP | 1.18e-02 | -1.35e-01 | 0.2786 |
| 8505 | PARG | A001-C-119 | Human | Colorectum | FAP | 1.69e-03 | -3.36e-01 | -0.1557 |
| 8505 | PARG | A001-C-108 | Human | Colorectum | FAP | 3.49e-13 | -1.19e-01 | -0.0272 |
| 8505 | PARG | A002-C-205 | Human | Colorectum | FAP | 1.16e-12 | -2.47e-01 | -0.1236 |
| 8505 | PARG | A015-C-006 | Human | Colorectum | FAP | 7.00e-10 | -2.82e-01 | -0.0994 |
| Page: 1 2 3 4 5 |
| Tissue | Expression Dynamics | Abbreviation |
| Cervix | 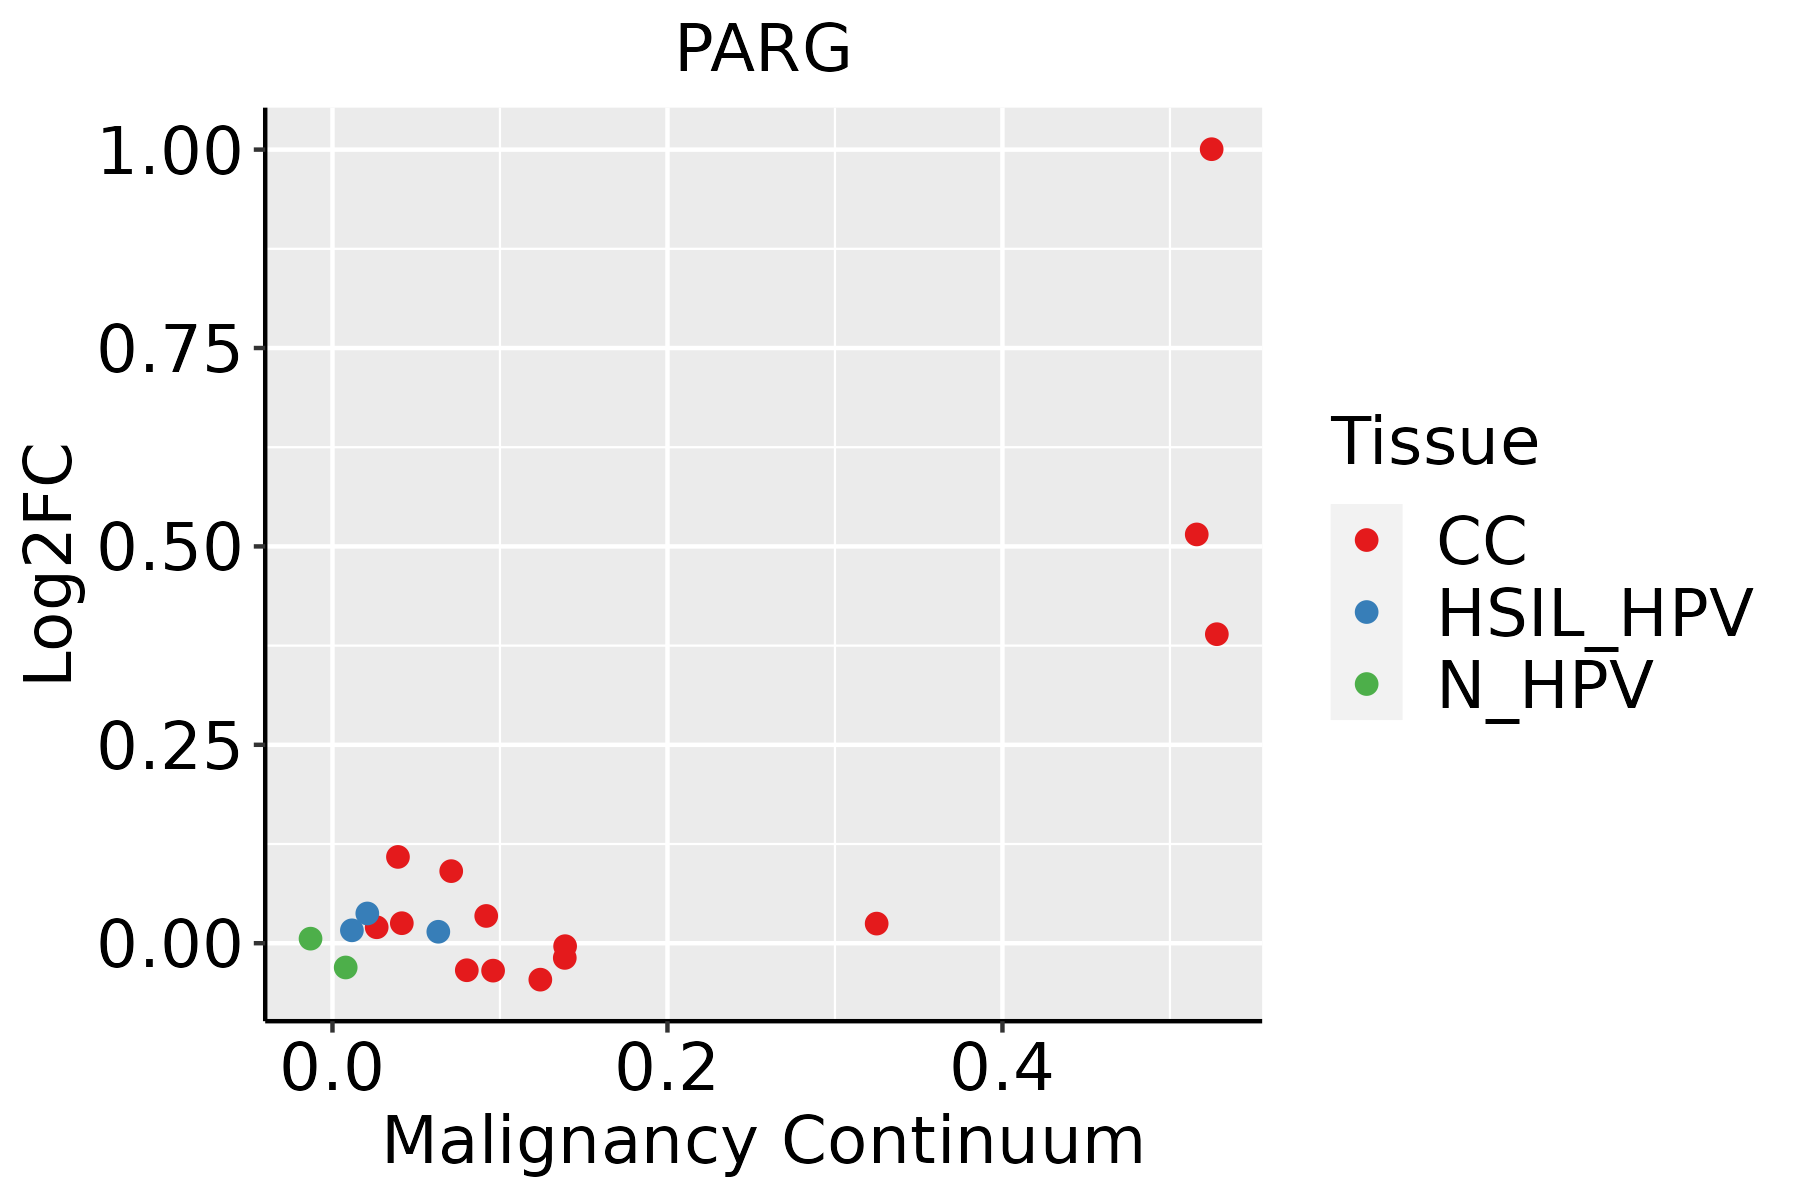 | CC: Cervix cancer |
| HSIL_HPV: HPV-infected high-grade squamous intraepithelial lesions | ||
| N_HPV: HPV-infected normal cervix | ||
| Colorectum (GSE201348) |  | FAP: Familial adenomatous polyposis |
| CRC: Colorectal cancer | ||
| Colorectum (HTA11) |  | AD: Adenomas |
| SER: Sessile serrated lesions | ||
| MSI-H: Microsatellite-high colorectal cancer | ||
| MSS: Microsatellite stable colorectal cancer | ||
| Esophagus |  | ESCC: Esophageal squamous cell carcinoma |
| HGIN: High-grade intraepithelial neoplasias | ||
| LGIN: Low-grade intraepithelial neoplasias | ||
| Liver | 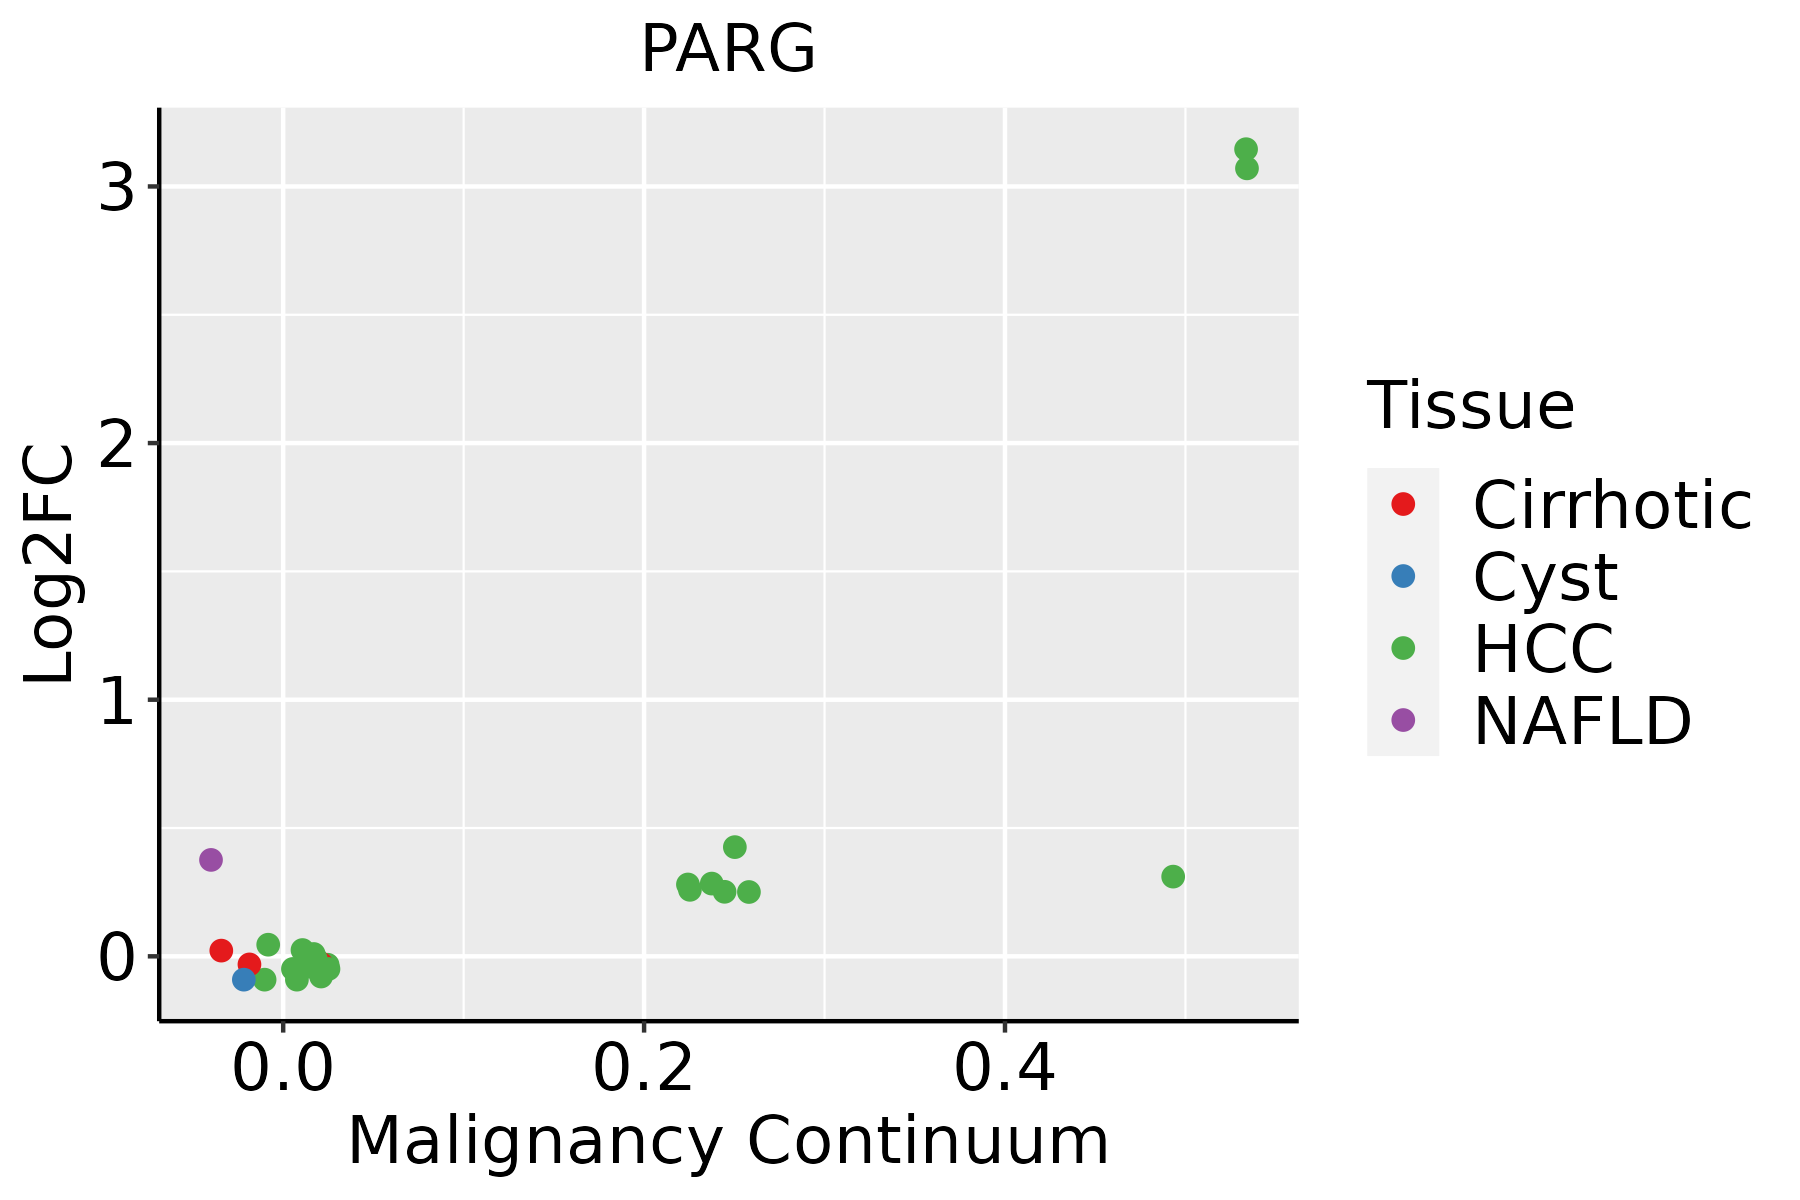 | HCC: Hepatocellular carcinoma |
| NAFLD: Non-alcoholic fatty liver disease |
| ∗log2FC in expression of this searched gene in stem-like cells from each diseased tissue sample relative to stem-like cells in normal samples in each tissue plotted against the malignancy continuum. Samples are colored based on if they are from different disease stage. |
Top |
Malignant transformation related pathway analysis |
| Find out the enriched GO biological processes and KEGG pathways involved in transition from healthy to precancer to cancer |
| Tissue | Disease Stage | Enriched GO biological Processes |
| Colorectum | AD |  |
| Colorectum | SER |  |
| Colorectum | MSS |  |
| Colorectum | MSI-H |  |
| Colorectum | FAP |  |
| ∗Top 15 enriched GO BP terms are showed in the bar plot of each disease state in each tissue. Each row represents a significant GO biological process which is colored according to the -log10(p.adjust). |
| Page: 1 2 3 4 5 6 7 8 9 |
| GO ID | Tissue | Disease Stage | Description | Gene Ratio | Bg Ratio | pvalue | p.adjust | Count |
| GO:004603410 | Cervix | CC | ATP metabolic process | 90/2311 | 277/18723 | 7.90e-19 | 2.36e-15 | 90 |
| GO:000701510 | Cervix | CC | actin filament organization | 109/2311 | 442/18723 | 4.92e-13 | 2.45e-10 | 109 |
| GO:000697910 | Cervix | CC | response to oxidative stress | 102/2311 | 446/18723 | 2.99e-10 | 4.36e-08 | 102 |
| GO:000030210 | Cervix | CC | response to reactive oxygen species | 56/2311 | 222/18723 | 1.00e-07 | 5.25e-06 | 56 |
| GO:006219710 | Cervix | CC | cellular response to chemical stress | 76/2311 | 337/18723 | 1.01e-07 | 5.25e-06 | 76 |
| GO:003009910 | Cervix | CC | myeloid cell differentiation | 83/2311 | 381/18723 | 1.31e-07 | 6.42e-06 | 83 |
| GO:190370610 | Cervix | CC | regulation of hemopoiesis | 80/2311 | 367/18723 | 2.14e-07 | 9.55e-06 | 80 |
| GO:004854510 | Cervix | CC | response to steroid hormone | 74/2311 | 339/18723 | 5.71e-07 | 2.09e-05 | 74 |
| GO:00305229 | Cervix | CC | intracellular receptor signaling pathway | 60/2311 | 265/18723 | 1.89e-06 | 5.97e-05 | 60 |
| GO:003459910 | Cervix | CC | cellular response to oxidative stress | 63/2311 | 288/18723 | 3.58e-06 | 9.50e-05 | 63 |
| GO:00510904 | Cervix | CC | regulation of DNA-binding transcription factor activity | 87/2311 | 440/18723 | 4.85e-06 | 1.22e-04 | 87 |
| GO:19021056 | Cervix | CC | regulation of leukocyte differentiation | 61/2311 | 279/18723 | 5.16e-06 | 1.29e-04 | 61 |
| GO:004563710 | Cervix | CC | regulation of myeloid cell differentiation | 48/2311 | 210/18723 | 1.49e-05 | 2.93e-04 | 48 |
| GO:00018949 | Cervix | CC | tissue homeostasis | 57/2311 | 268/18723 | 2.43e-05 | 4.21e-04 | 57 |
| GO:00025738 | Cervix | CC | myeloid leukocyte differentiation | 47/2311 | 208/18723 | 2.48e-05 | 4.27e-04 | 47 |
| GO:00456397 | Cervix | CC | positive regulation of myeloid cell differentiation | 28/2311 | 103/18723 | 3.56e-05 | 5.70e-04 | 28 |
| GO:00319609 | Cervix | CC | response to corticosteroid | 39/2311 | 167/18723 | 5.48e-05 | 8.06e-04 | 39 |
| GO:00602498 | Cervix | CC | anatomical structure homeostasis | 63/2311 | 314/18723 | 6.03e-05 | 8.68e-04 | 63 |
| GO:00513849 | Cervix | CC | response to glucocorticoid | 35/2311 | 148/18723 | 9.87e-05 | 1.27e-03 | 35 |
| GO:003530310 | Cervix | CC | regulation of dephosphorylation | 31/2311 | 128/18723 | 1.52e-04 | 1.83e-03 | 31 |
| Page: 1 2 3 4 5 6 7 8 9 10 11 12 13 14 15 16 17 18 19 20 21 22 23 24 25 26 27 28 29 30 31 32 33 34 35 36 37 38 39 40 41 42 43 44 45 46 47 48 49 50 51 52 53 54 55 56 57 58 59 60 61 62 63 64 65 66 67 68 69 70 71 72 73 74 75 76 77 78 79 80 81 82 83 84 85 86 87 88 89 90 91 92 93 94 95 96 97 98 99 100 101 102 103 104 105 106 107 108 109 110 111 112 |
| Pathway ID | Tissue | Disease Stage | Description | Gene Ratio | Bg Ratio | pvalue | p.adjust | qvalue | Count |
| hsa034104 | Esophagus | ESCC | Base excision repair | 38/4205 | 44/8465 | 3.59e-07 | 2.62e-06 | 1.34e-06 | 38 |
| hsa0341011 | Esophagus | ESCC | Base excision repair | 38/4205 | 44/8465 | 3.59e-07 | 2.62e-06 | 1.34e-06 | 38 |
| Page: 1 |
Top |
Cell-cell communication analysis |
| Identification of potential cell-cell interactions between two cell types and their ligand-receptor pairs for different disease states |
| Ligand | Receptor | LRpair | Pathway | Tissue | Disease Stage |
| Page: 1 |
Top |
Single-cell gene regulatory network inference analysis |
| Find out the significant the regulons (TFs) and the target genes of each regulon across cell types for different disease states |
| TF | Cell Type | Tissue | Disease Stage | Target Gene | RSS | Regulon Activity |
| ∗The dot plots of a searched regulon are shown for all cell subpopulations in each disease state of each tissue based on the regulon specific score inferred using pySCENIC and by calculating the average expression. |
| Page: 1 |
Top |
Somatic mutation of malignant transformation related genes |
| Annotation of somatic variants for genes involved in malignant transformation |
| Hugo Symbol | Variant Class | Variant Classification | dbSNP RS | HGVSc | HGVSp | HGVSp Short | SWISSPROT | BIOTYPE | SIFT | PolyPhen | Tumor Sample Barcode | Tissue | Histology | Sex | Age | Stage | Therapy Types | Drugs | Outcome |
| PARG | SNV | Missense_Mutation | novel | c.2006N>T | p.Ser669Leu | p.S669L | Q86W56 | protein_coding | deleterious(0.02) | probably_damaging(0.989) | TCGA-AQ-A54N-01 | Breast | breast invasive carcinoma | Female | <65 | I/II | Unknown | Unknown | SD |
| PARG | insertion | Frame_Shift_Ins | novel | c.1451_1452insCT | p.Arg485PhefsTer3 | p.R485Ffs*3 | Q86W56 | protein_coding | TCGA-S3-AA11-01 | Breast | breast invasive carcinoma | Female | >=65 | I/II | Hormone Therapy | letrozole | CR | ||
| PARG | SNV | Missense_Mutation | rs4614387 | c.1453N>T | p.Arg485Trp | p.R485W | Q86W56 | protein_coding | deleterious(0) | benign(0.072) | TCGA-C5-A8YQ-01 | Cervix | cervical & endocervical cancer | Female | >=65 | I/II | Chemotherapy | cisplatin | PD |
| PARG | SNV | Missense_Mutation | novel | c.517N>G | p.Gln173Glu | p.Q173E | Q86W56 | protein_coding | tolerated_low_confidence(0.16) | benign(0.001) | TCGA-C5-A8YQ-01 | Cervix | cervical & endocervical cancer | Female | >=65 | I/II | Chemotherapy | cisplatin | PD |
| PARG | SNV | Missense_Mutation | novel | c.2515N>C | p.Glu839Gln | p.E839Q | Q86W56 | protein_coding | tolerated(0.06) | benign(0.312) | TCGA-EK-A3GJ-01 | Cervix | cervical & endocervical cancer | Female | <65 | I/II | Unknown | Unknown | SD |
| PARG | SNV | Missense_Mutation | novel | c.815G>A | p.Gly272Asp | p.G272D | Q86W56 | protein_coding | tolerated_low_confidence(0.64) | benign(0.049) | TCGA-VS-A8EB-01 | Cervix | cervical & endocervical cancer | Female | <65 | III/IV | Unknown | Unknown | PD |
| PARG | SNV | Missense_Mutation | novel | c.1199C>G | p.Ser400Cys | p.S400C | Q86W56 | protein_coding | deleterious_low_confidence(0.02) | possibly_damaging(0.628) | TCGA-VS-A8Q8-01 | Cervix | cervical & endocervical cancer | Female | <65 | I/II | Unknown | Unknown | PD |
| PARG | deletion | Frame_Shift_Del | novel | c.2808delN | p.Tyr936Ter | p.Y936* | Q86W56 | protein_coding | TCGA-C5-A7X3-01 | Cervix | cervical & endocervical cancer | Female | >=65 | III/IV | Chemotherapy | cisplatin | SD | ||
| PARG | SNV | Missense_Mutation | novel | c.2173N>G | p.Thr725Ala | p.T725A | Q86W56 | protein_coding | deleterious(0.02) | benign(0.359) | TCGA-A6-5661-01 | Colorectum | colon adenocarcinoma | Female | >=65 | I/II | Unknown | Unknown | SD |
| PARG | SNV | Missense_Mutation | novel | c.1865C>G | p.Ser622Cys | p.S622C | Q86W56 | protein_coding | deleterious(0.02) | probably_damaging(0.995) | TCGA-AA-3662-01 | Colorectum | colon adenocarcinoma | Female | >=65 | III/IV | Chemotherapy | capecitabine | PR |
| Page: 1 2 3 4 5 6 7 8 9 |
Top |
Related drugs of malignant transformation related genes |
| Identification of chemicals and drugs interact with genes involved in malignant transfromation |
| (DGIdb 4.0) |
| Entrez ID | Symbol | Category | Interaction Types | Drug Claim Name | Drug Name | PMIDs |
| 8505 | PARG | ENZYME | BENZAMIDE | BENZAMIDE | 21692479 |
| Page: 1 |

Copyright 2023-Present -The University of Texas Health Science Center at Houston |