
|
|||||
|
 | |
| |
| |
| |
| |
| |
|
Gene: PARD6G |
Gene summary for PARD6G |
| Gene information | Species | Human | Gene symbol | PARD6G | Gene ID | 84552 |
| Gene name | par-6 family cell polarity regulator gamma | |
| Gene Alias | PAR-6G | |
| Cytomap | 18q23 | |
| Gene Type | protein-coding | GO ID | GO:0000226 | UniProtAcc | Q9BYG4 |
Top |
Malignant transformation analysis |
| Identification of the aberrant gene expression in precancerous and cancerous lesions by comparing the gene expression of stem-like cells in diseased tissues with normal stem cells |
| Entrez ID | Symbol | Replicates | Species | Organ | Tissue | Adj P-value | Log2FC | Malignancy |
| 84552 | PARD6G | HCC1_Meng | Human | Liver | HCC | 1.03e-14 | 4.90e-02 | 0.0246 |
| 84552 | PARD6G | HCC1 | Human | Liver | HCC | 2.76e-20 | 1.96e+00 | 0.5336 |
| 84552 | PARD6G | HCC2 | Human | Liver | HCC | 9.70e-30 | 1.73e+00 | 0.5341 |
| 84552 | PARD6G | HCC5 | Human | Liver | HCC | 2.34e-35 | 1.86e+00 | 0.4932 |
| 84552 | PARD6G | S014 | Human | Liver | HCC | 7.34e-17 | 5.30e-01 | 0.2254 |
| 84552 | PARD6G | S015 | Human | Liver | HCC | 7.09e-16 | 5.57e-01 | 0.2375 |
| 84552 | PARD6G | S016 | Human | Liver | HCC | 2.43e-26 | 6.92e-01 | 0.2243 |
| 84552 | PARD6G | C04 | Human | Oral cavity | OSCC | 8.85e-04 | 3.92e-01 | 0.2633 |
| 84552 | PARD6G | C30 | Human | Oral cavity | OSCC | 1.90e-36 | 1.21e+00 | 0.3055 |
| 84552 | PARD6G | C38 | Human | Oral cavity | OSCC | 1.77e-08 | 1.01e+00 | 0.172 |
| 84552 | PARD6G | C43 | Human | Oral cavity | OSCC | 2.35e-09 | 1.72e-01 | 0.1704 |
| 84552 | PARD6G | C46 | Human | Oral cavity | OSCC | 9.95e-08 | 3.39e-01 | 0.1673 |
| 84552 | PARD6G | C51 | Human | Oral cavity | OSCC | 5.79e-03 | 3.10e-01 | 0.2674 |
| 84552 | PARD6G | C08 | Human | Oral cavity | OSCC | 1.38e-02 | 1.16e-01 | 0.1919 |
| 84552 | PARD6G | LN46 | Human | Oral cavity | OSCC | 1.78e-04 | 3.72e-01 | 0.1666 |
| 84552 | PARD6G | SYSMH1 | Human | Oral cavity | OSCC | 9.63e-12 | 2.76e-01 | 0.1127 |
| 84552 | PARD6G | SYSMH2 | Human | Oral cavity | OSCC | 4.72e-09 | 2.36e-01 | 0.2326 |
| 84552 | PARD6G | SYSMH3 | Human | Oral cavity | OSCC | 1.19e-18 | 4.02e-01 | 0.2442 |
| 84552 | PARD6G | SYSMH4 | Human | Oral cavity | OSCC | 3.95e-03 | 9.97e-02 | 0.1226 |
| 84552 | PARD6G | SYSMH5 | Human | Oral cavity | OSCC | 3.35e-03 | 1.43e-01 | 0.0647 |
| Page: 1 2 |
| Tissue | Expression Dynamics | Abbreviation |
| Liver |  | HCC: Hepatocellular carcinoma |
| NAFLD: Non-alcoholic fatty liver disease | ||
| Oral Cavity | 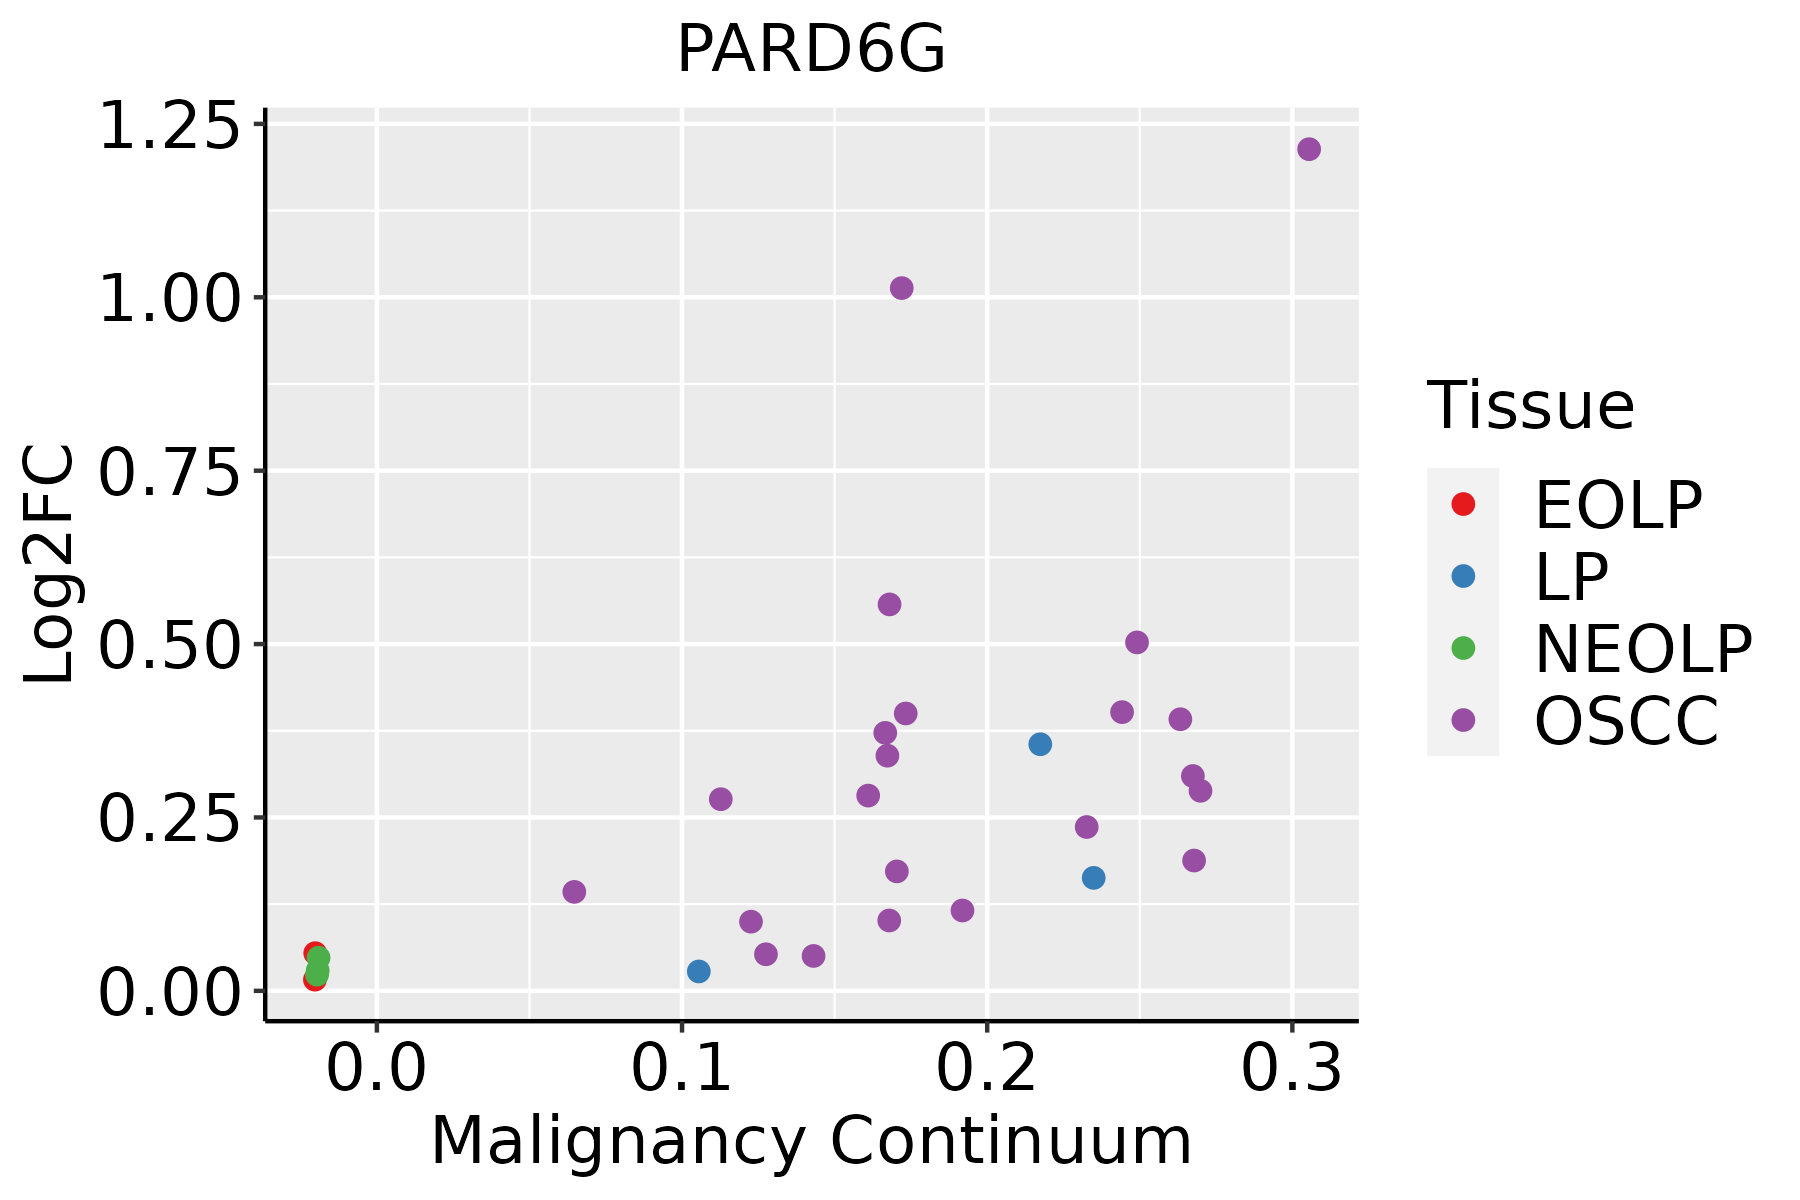 | EOLP: Erosive Oral lichen planus |
| LP: leukoplakia | ||
| NEOLP: Non-erosive oral lichen planus | ||
| OSCC: Oral squamous cell carcinoma | ||
| Skin |  | AK: Actinic keratosis |
| cSCC: Cutaneous squamous cell carcinoma | ||
| SCCIS:squamous cell carcinoma in situ |
| ∗log2FC in expression of this searched gene in stem-like cells from each diseased tissue sample relative to stem-like cells in normal samples in each tissue plotted against the malignancy continuum. Samples are colored based on if they are from different disease stage. |
Top |
Malignant transformation related pathway analysis |
| Find out the enriched GO biological processes and KEGG pathways involved in transition from healthy to precancer to cancer |
| Tissue | Disease Stage | Enriched GO biological Processes |
| Colorectum | AD |  |
| Colorectum | SER |  |
| Colorectum | MSS |  |
| Colorectum | MSI-H |  |
| Colorectum | FAP |  |
| ∗Top 15 enriched GO BP terms are showed in the bar plot of each disease state in each tissue. Each row represents a significant GO biological process which is colored according to the -log10(p.adjust). |
| Page: 1 2 3 4 5 6 7 8 9 |
| GO ID | Tissue | Disease Stage | Description | Gene Ratio | Bg Ratio | pvalue | p.adjust | Count |
| GO:000716322 | Liver | HCC | establishment or maintenance of cell polarity | 133/7958 | 218/18723 | 2.48e-08 | 5.73e-07 | 133 |
| GO:0031023 | Liver | HCC | microtubule organizing center organization | 82/7958 | 143/18723 | 2.38e-04 | 1.79e-03 | 82 |
| GO:0007098 | Liver | HCC | centrosome cycle | 75/7958 | 130/18723 | 3.33e-04 | 2.34e-03 | 75 |
| GO:000716318 | Oral cavity | OSCC | establishment or maintenance of cell polarity | 129/7305 | 218/18723 | 1.16e-09 | 2.86e-08 | 129 |
| GO:00070981 | Oral cavity | OSCC | centrosome cycle | 66/7305 | 130/18723 | 4.17e-03 | 1.70e-02 | 66 |
| GO:00310232 | Oral cavity | OSCC | microtubule organizing center organization | 70/7305 | 143/18723 | 9.71e-03 | 3.44e-02 | 70 |
| GO:000716326 | Skin | AK | establishment or maintenance of cell polarity | 53/1910 | 218/18723 | 1.32e-09 | 1.26e-07 | 53 |
| GO:000716327 | Skin | cSCC | establishment or maintenance of cell polarity | 103/4864 | 218/18723 | 9.44e-12 | 4.85e-10 | 103 |
| GO:00310234 | Skin | cSCC | microtubule organizing center organization | 58/4864 | 143/18723 | 9.47e-05 | 8.83e-04 | 58 |
| GO:00070983 | Skin | cSCC | centrosome cycle | 53/4864 | 130/18723 | 1.59e-04 | 1.39e-03 | 53 |
| Page: 1 |
| Pathway ID | Tissue | Disease Stage | Description | Gene Ratio | Bg Ratio | pvalue | p.adjust | qvalue | Count |
| hsa0414422 | Liver | HCC | Endocytosis | 178/4020 | 251/8465 | 2.03e-14 | 5.22e-13 | 2.91e-13 | 178 |
| hsa0453042 | Liver | HCC | Tight junction | 110/4020 | 169/8465 | 2.45e-06 | 2.28e-05 | 1.27e-05 | 110 |
| hsa051652 | Liver | HCC | Human papillomavirus infection | 188/4020 | 331/8465 | 3.34e-04 | 1.49e-03 | 8.29e-04 | 188 |
| hsa0414432 | Liver | HCC | Endocytosis | 178/4020 | 251/8465 | 2.03e-14 | 5.22e-13 | 2.91e-13 | 178 |
| hsa0453052 | Liver | HCC | Tight junction | 110/4020 | 169/8465 | 2.45e-06 | 2.28e-05 | 1.27e-05 | 110 |
| hsa051653 | Liver | HCC | Human papillomavirus infection | 188/4020 | 331/8465 | 3.34e-04 | 1.49e-03 | 8.29e-04 | 188 |
| hsa0414427 | Oral cavity | OSCC | Endocytosis | 174/3704 | 251/8465 | 9.42e-17 | 4.51e-15 | 2.29e-15 | 174 |
| hsa051659 | Oral cavity | OSCC | Human papillomavirus infection | 200/3704 | 331/8465 | 3.83e-10 | 4.93e-09 | 2.51e-09 | 200 |
| hsa0453030 | Oral cavity | OSCC | Tight junction | 102/3704 | 169/8465 | 8.68e-06 | 3.93e-05 | 2.00e-05 | 102 |
| hsa0439016 | Oral cavity | OSCC | Hippo signaling pathway | 86/3704 | 157/8465 | 3.30e-03 | 8.24e-03 | 4.20e-03 | 86 |
| hsa0436014 | Oral cavity | OSCC | Axon guidance | 97/3704 | 182/8465 | 5.59e-03 | 1.33e-02 | 6.76e-03 | 97 |
| hsa0401518 | Oral cavity | OSCC | Rap1 signaling pathway | 107/3704 | 210/8465 | 2.01e-02 | 4.34e-02 | 2.21e-02 | 107 |
| hsa04144112 | Oral cavity | OSCC | Endocytosis | 174/3704 | 251/8465 | 9.42e-17 | 4.51e-15 | 2.29e-15 | 174 |
| hsa0516514 | Oral cavity | OSCC | Human papillomavirus infection | 200/3704 | 331/8465 | 3.83e-10 | 4.93e-09 | 2.51e-09 | 200 |
| hsa04530114 | Oral cavity | OSCC | Tight junction | 102/3704 | 169/8465 | 8.68e-06 | 3.93e-05 | 2.00e-05 | 102 |
| hsa0439017 | Oral cavity | OSCC | Hippo signaling pathway | 86/3704 | 157/8465 | 3.30e-03 | 8.24e-03 | 4.20e-03 | 86 |
| hsa0436015 | Oral cavity | OSCC | Axon guidance | 97/3704 | 182/8465 | 5.59e-03 | 1.33e-02 | 6.76e-03 | 97 |
| hsa0401519 | Oral cavity | OSCC | Rap1 signaling pathway | 107/3704 | 210/8465 | 2.01e-02 | 4.34e-02 | 2.21e-02 | 107 |
| Page: 1 |
Top |
Cell-cell communication analysis |
| Identification of potential cell-cell interactions between two cell types and their ligand-receptor pairs for different disease states |
| Ligand | Receptor | LRpair | Pathway | Tissue | Disease Stage |
| Page: 1 |
Top |
Single-cell gene regulatory network inference analysis |
| Find out the significant the regulons (TFs) and the target genes of each regulon across cell types for different disease states |
| TF | Cell Type | Tissue | Disease Stage | Target Gene | RSS | Regulon Activity |
| ∗The dot plots of a searched regulon are shown for all cell subpopulations in each disease state of each tissue based on the regulon specific score inferred using pySCENIC and by calculating the average expression. |
| Page: 1 |
Top |
Somatic mutation of malignant transformation related genes |
| Annotation of somatic variants for genes involved in malignant transformation |
| Hugo Symbol | Variant Class | Variant Classification | dbSNP RS | HGVSc | HGVSp | HGVSp Short | SWISSPROT | BIOTYPE | SIFT | PolyPhen | Tumor Sample Barcode | Tissue | Histology | Sex | Age | Stage | Therapy Types | Drugs | Outcome |
| PARD6G | SNV | Missense_Mutation | novel | c.773N>A | p.Arg258His | p.R258H | Q9BYG4 | protein_coding | deleterious(0.01) | probably_damaging(0.968) | TCGA-E2-A9RU-01 | Breast | breast invasive carcinoma | Female | >=65 | III/IV | Hormone Therapy | arimidex | SD |
| PARD6G | SNV | Missense_Mutation | novel | c.589N>T | p.Arg197Cys | p.R197C | Q9BYG4 | protein_coding | deleterious(0) | probably_damaging(1) | TCGA-2W-A8YY-01 | Cervix | cervical & endocervical cancer | Female | <65 | I/II | Chemotherapy | cisplatin | CR |
| PARD6G | SNV | Missense_Mutation | c.1096N>A | p.Gly366Ser | p.G366S | Q9BYG4 | protein_coding | tolerated_low_confidence(0.12) | possibly_damaging(0.464) | TCGA-AA-3864-01 | Colorectum | colon adenocarcinoma | Male | >=65 | I/II | Unknown | Unknown | SD | |
| PARD6G | SNV | Missense_Mutation | rs750051978 | c.841N>A | p.Ala281Thr | p.A281T | Q9BYG4 | protein_coding | tolerated(0.27) | benign(0.005) | TCGA-AA-3864-01 | Colorectum | colon adenocarcinoma | Male | >=65 | I/II | Unknown | Unknown | SD |
| PARD6G | SNV | Missense_Mutation | rs776972451 | c.412N>T | p.Arg138Cys | p.R138C | Q9BYG4 | protein_coding | deleterious(0) | possibly_damaging(0.586) | TCGA-AA-A01P-01 | Colorectum | colon adenocarcinoma | Female | >=65 | III/IV | Unknown | Unknown | PD |
| PARD6G | SNV | Missense_Mutation | rs777931177 | c.931N>T | p.Arg311Cys | p.R311C | Q9BYG4 | protein_coding | tolerated_low_confidence(0.13) | benign(0.443) | TCGA-AD-6889-01 | Colorectum | colon adenocarcinoma | Male | >=65 | I/II | Chemotherapy | xeloda | PD |
| PARD6G | SNV | Missense_Mutation | rs748057470 | c.705N>T | p.Met235Ile | p.M235I | Q9BYG4 | protein_coding | deleterious(0) | possibly_damaging(0.879) | TCGA-D5-6531-01 | Colorectum | colon adenocarcinoma | Male | >=65 | I/II | Unknown | Unknown | SD |
| PARD6G | SNV | Missense_Mutation | c.464N>T | p.Thr155Met | p.T155M | Q9BYG4 | protein_coding | deleterious(0) | probably_damaging(0.937) | TCGA-G4-6309-01 | Colorectum | colon adenocarcinoma | Female | <65 | III/IV | Chemotherapy | xeloda | PD | |
| PARD6G | SNV | Missense_Mutation | c.712N>A | p.Ala238Thr | p.A238T | Q9BYG4 | protein_coding | deleterious(0) | probably_damaging(0.983) | TCGA-G4-6586-01 | Colorectum | colon adenocarcinoma | Female | >=65 | I/II | Unknown | Unknown | SD | |
| PARD6G | SNV | Missense_Mutation | novel | c.95N>C | p.Phe32Ser | p.F32S | Q9BYG4 | protein_coding | deleterious(0) | probably_damaging(0.998) | TCGA-AG-3893-01 | Colorectum | rectum adenocarcinoma | Male | >=65 | III/IV | Chemotherapy | folinic | CR |
| Page: 1 2 3 4 |
Top |
Related drugs of malignant transformation related genes |
| Identification of chemicals and drugs interact with genes involved in malignant transfromation |
| (DGIdb 4.0) |
| Entrez ID | Symbol | Category | Interaction Types | Drug Claim Name | Drug Name | PMIDs |
| Page: 1 |

Copyright 2023-Present -The University of Texas Health Science Center at Houston |