
|
|||||
|
 | |
| |
| |
| |
| |
| |
|
Gene: PARD6B |
Gene summary for PARD6B |
| Gene information | Species | Human | Gene symbol | PARD6B | Gene ID | 84612 |
| Gene name | par-6 family cell polarity regulator beta | |
| Gene Alias | PAR6B | |
| Cytomap | 20q13.13 | |
| Gene Type | protein-coding | GO ID | GO:0000226 | UniProtAcc | Q9BYG5 |
Top |
Malignant transformation analysis |
| Identification of the aberrant gene expression in precancerous and cancerous lesions by comparing the gene expression of stem-like cells in diseased tissues with normal stem cells |
| Entrez ID | Symbol | Replicates | Species | Organ | Tissue | Adj P-value | Log2FC | Malignancy |
| 84612 | PARD6B | GSM4909293 | Human | Breast | IDC | 7.57e-03 | 1.93e-01 | 0.1581 |
| 84612 | PARD6B | GSM4909298 | Human | Breast | IDC | 5.60e-06 | 2.48e-01 | 0.1551 |
| 84612 | PARD6B | GSM4909301 | Human | Breast | IDC | 2.10e-66 | 1.20e+00 | 0.1577 |
| 84612 | PARD6B | GSM4909302 | Human | Breast | IDC | 3.41e-06 | 3.80e-01 | 0.1545 |
| 84612 | PARD6B | GSM4909304 | Human | Breast | IDC | 8.20e-06 | 2.98e-01 | 0.1636 |
| 84612 | PARD6B | GSM4909308 | Human | Breast | IDC | 1.59e-18 | 4.87e-01 | 0.158 |
| 84612 | PARD6B | GSM4909311 | Human | Breast | IDC | 6.79e-08 | 7.56e-02 | 0.1534 |
| 84612 | PARD6B | GSM4909312 | Human | Breast | IDC | 1.14e-05 | 3.04e-01 | 0.1552 |
| 84612 | PARD6B | GSM4909319 | Human | Breast | IDC | 1.77e-08 | -2.55e-02 | 0.1563 |
| 84612 | PARD6B | GSM4909321 | Human | Breast | IDC | 1.29e-06 | 3.48e-01 | 0.1559 |
| 84612 | PARD6B | M1 | Human | Breast | IDC | 3.87e-13 | 5.46e-01 | 0.1577 |
| 84612 | PARD6B | NCCBC2 | Human | Breast | DCIS | 6.78e-03 | 4.35e-01 | 0.1554 |
| 84612 | PARD6B | P3 | Human | Breast | IDC | 1.38e-06 | 7.05e-01 | 0.1542 |
| 84612 | PARD6B | DCIS2 | Human | Breast | DCIS | 7.59e-42 | 1.36e-01 | 0.0085 |
| 84612 | PARD6B | LZE4T | Human | Esophagus | ESCC | 4.76e-08 | 3.56e-01 | 0.0811 |
| 84612 | PARD6B | LZE5T | Human | Esophagus | ESCC | 3.92e-09 | 8.25e-01 | 0.0514 |
| 84612 | PARD6B | LZE24T | Human | Esophagus | ESCC | 3.91e-08 | 2.68e-01 | 0.0596 |
| 84612 | PARD6B | P2T-E | Human | Esophagus | ESCC | 1.45e-23 | 5.33e-01 | 0.1177 |
| 84612 | PARD6B | P4T-E | Human | Esophagus | ESCC | 2.33e-26 | 6.37e-01 | 0.1323 |
| 84612 | PARD6B | P5T-E | Human | Esophagus | ESCC | 9.96e-15 | 3.19e-01 | 0.1327 |
| Page: 1 2 3 4 5 |
| Tissue | Expression Dynamics | Abbreviation |
| Breast | 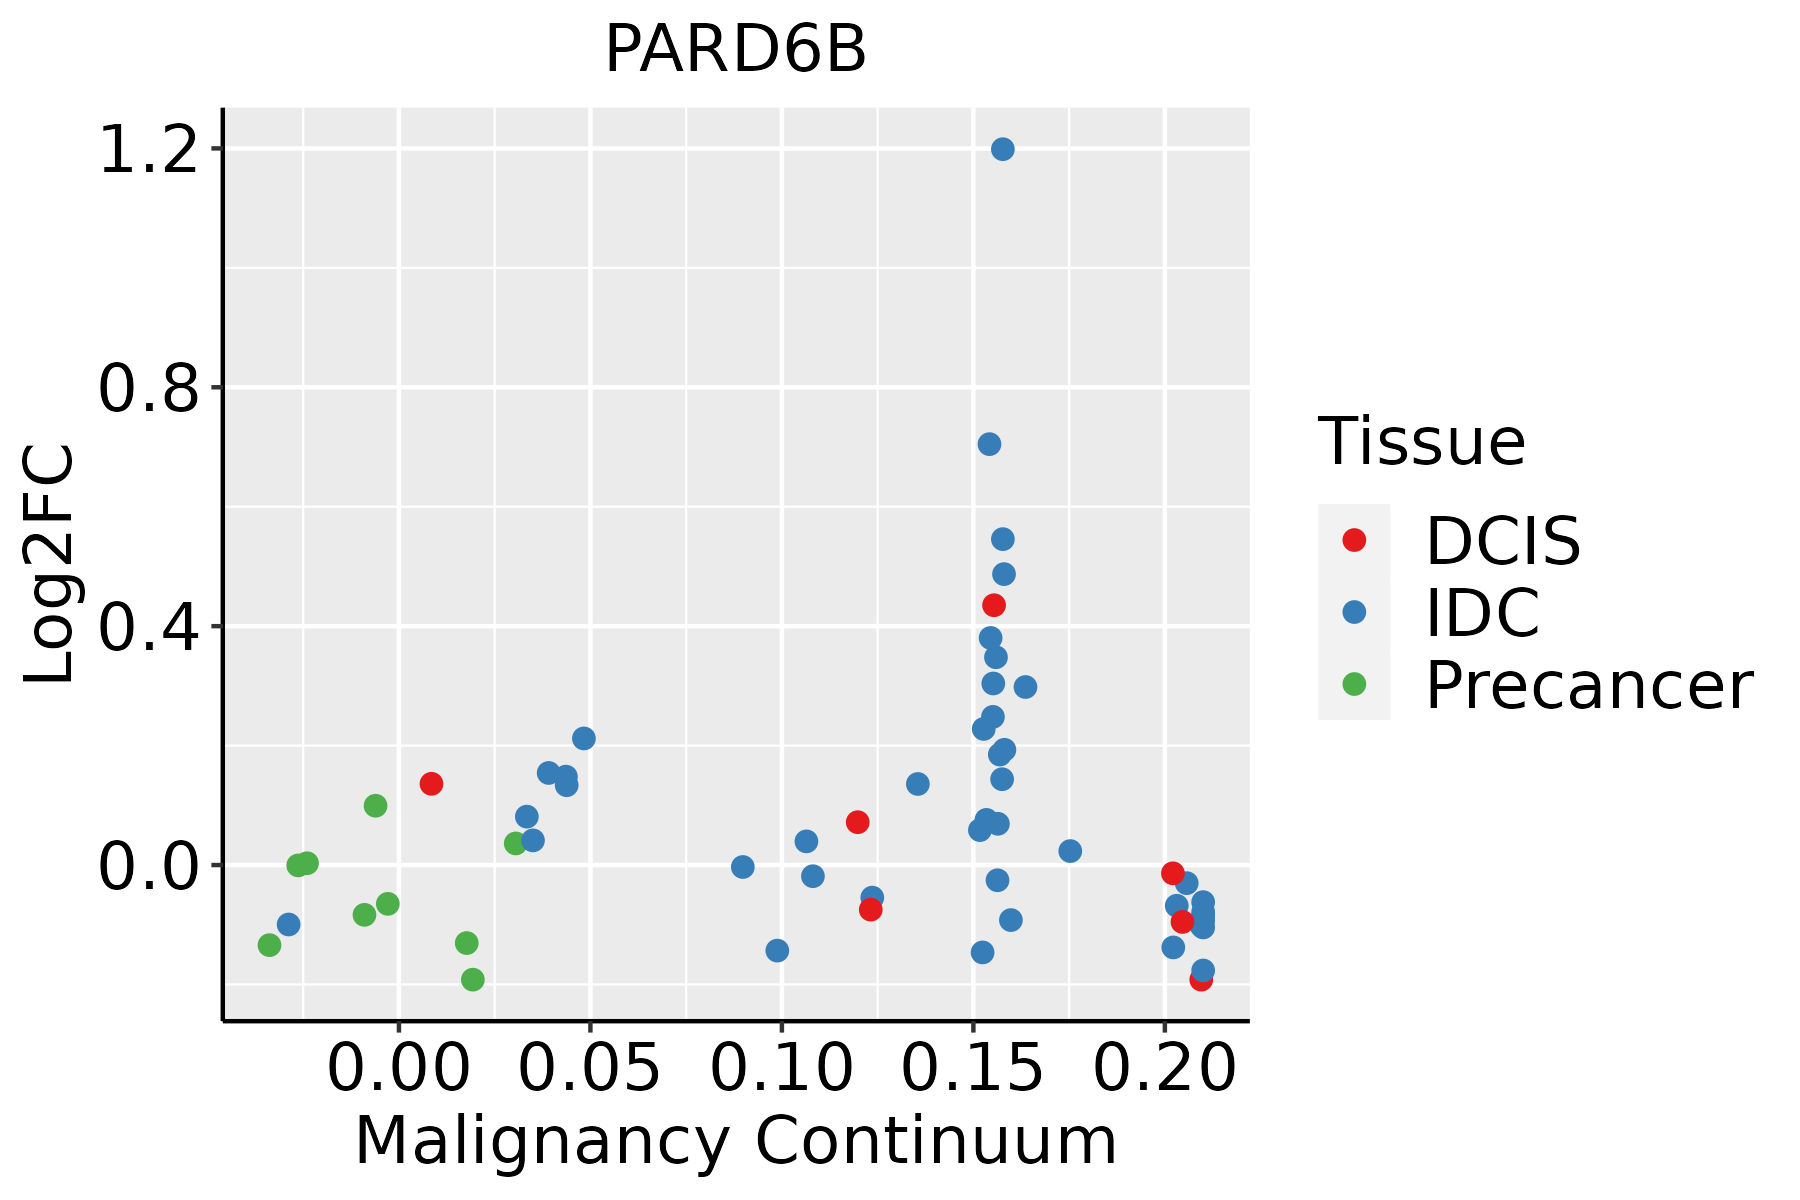 | IDC: Invasive ductal carcinoma |
| DCIS: Ductal carcinoma in situ | ||
| Precancer(BRCA1-mut): Precancerous lesion from BRCA1 mutation carriers | ||
| Esophagus | 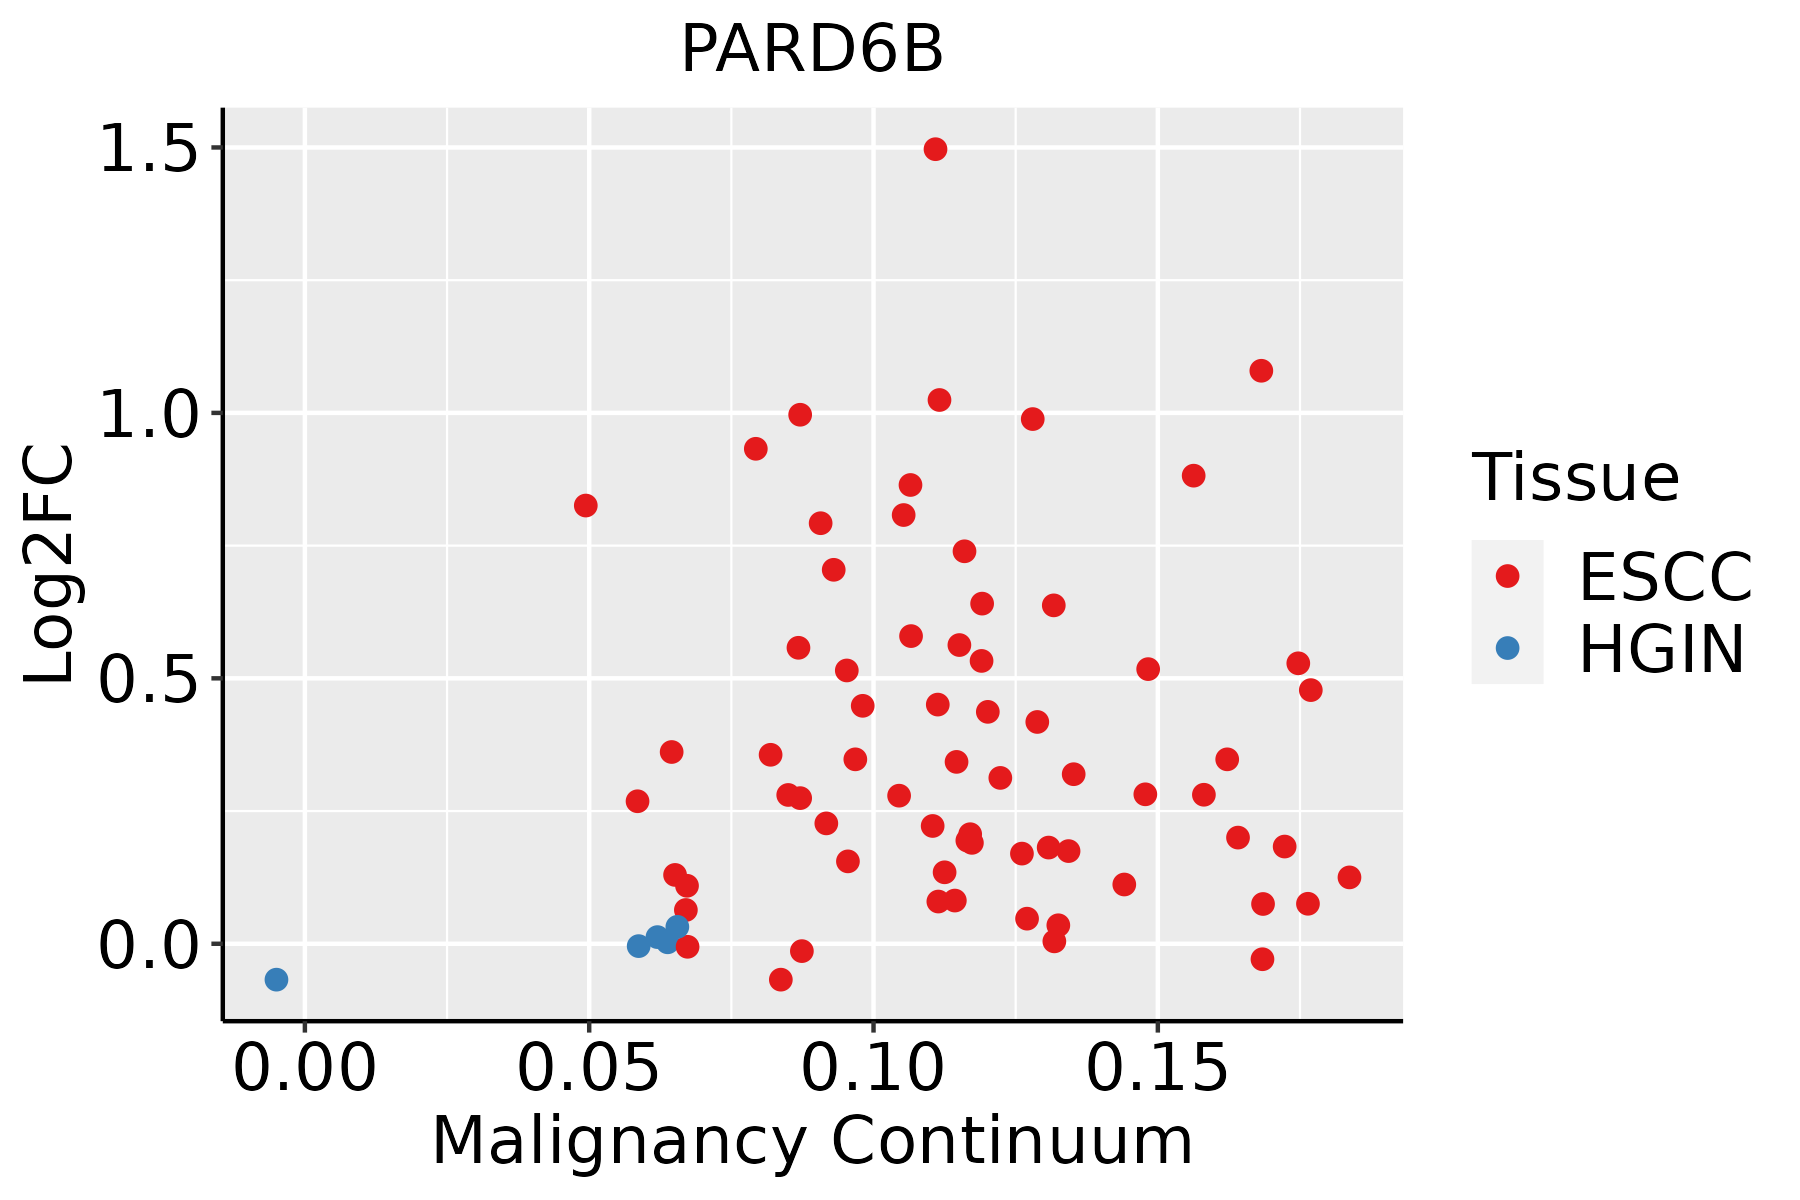 | ESCC: Esophageal squamous cell carcinoma |
| HGIN: High-grade intraepithelial neoplasias | ||
| LGIN: Low-grade intraepithelial neoplasias | ||
| Liver |  | HCC: Hepatocellular carcinoma |
| NAFLD: Non-alcoholic fatty liver disease | ||
| Oral Cavity | 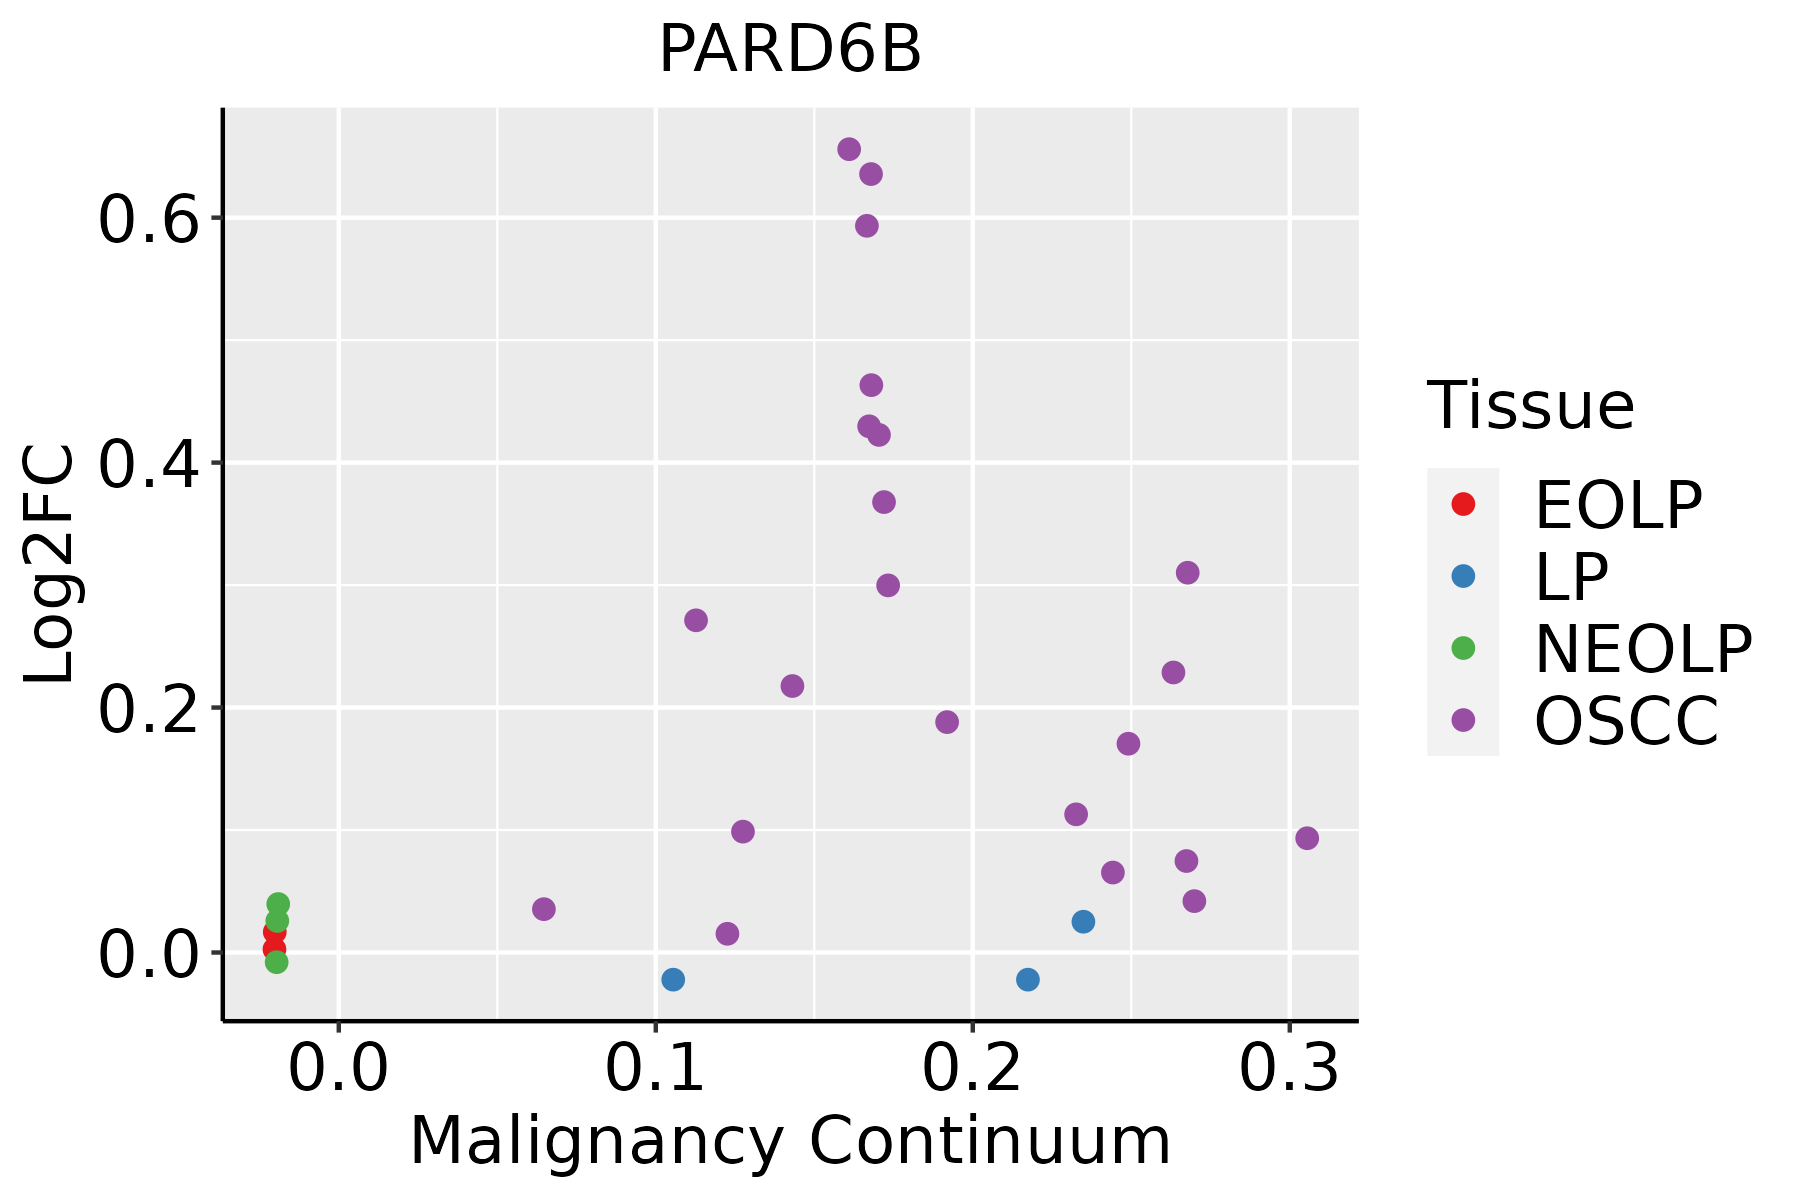 | EOLP: Erosive Oral lichen planus |
| LP: leukoplakia | ||
| NEOLP: Non-erosive oral lichen planus | ||
| OSCC: Oral squamous cell carcinoma | ||
| Thyroid |  | ATC: Anaplastic thyroid cancer |
| HT: Hashimoto's thyroiditis | ||
| PTC: Papillary thyroid cancer |
| ∗log2FC in expression of this searched gene in stem-like cells from each diseased tissue sample relative to stem-like cells in normal samples in each tissue plotted against the malignancy continuum. Samples are colored based on if they are from different disease stage. |
Top |
Malignant transformation related pathway analysis |
| Find out the enriched GO biological processes and KEGG pathways involved in transition from healthy to precancer to cancer |
| Tissue | Disease Stage | Enriched GO biological Processes |
| Colorectum | AD |  |
| Colorectum | SER |  |
| Colorectum | MSS |  |
| Colorectum | MSI-H |  |
| Colorectum | FAP |  |
| ∗Top 15 enriched GO BP terms are showed in the bar plot of each disease state in each tissue. Each row represents a significant GO biological process which is colored according to the -log10(p.adjust). |
| Page: 1 2 3 4 5 6 7 8 9 |
| GO ID | Tissue | Disease Stage | Description | Gene Ratio | Bg Ratio | pvalue | p.adjust | Count |
| GO:000716314 | Breast | IDC | establishment or maintenance of cell polarity | 32/1434 | 218/18723 | 2.84e-04 | 4.33e-03 | 32 |
| GO:000716324 | Breast | DCIS | establishment or maintenance of cell polarity | 32/1390 | 218/18723 | 1.62e-04 | 2.71e-03 | 32 |
| GO:000716320 | Esophagus | ESCC | establishment or maintenance of cell polarity | 143/8552 | 218/18723 | 2.05e-09 | 4.65e-08 | 143 |
| GO:00070982 | Esophagus | ESCC | centrosome cycle | 85/8552 | 130/18723 | 4.41e-06 | 4.69e-05 | 85 |
| GO:00310233 | Esophagus | ESCC | microtubule organizing center organization | 92/8552 | 143/18723 | 5.04e-06 | 5.31e-05 | 92 |
| GO:006156415 | Esophagus | ESCC | axon development | 251/8552 | 467/18723 | 2.41e-04 | 1.49e-03 | 251 |
| GO:003432918 | Esophagus | ESCC | cell junction assembly | 227/8552 | 420/18723 | 3.06e-04 | 1.83e-03 | 227 |
| GO:004521620 | Esophagus | ESCC | cell-cell junction organization | 114/8552 | 200/18723 | 8.04e-04 | 4.16e-03 | 114 |
| GO:000740915 | Esophagus | ESCC | axonogenesis | 219/8552 | 418/18723 | 3.14e-03 | 1.31e-02 | 219 |
| GO:000716312 | Liver | Cirrhotic | establishment or maintenance of cell polarity | 82/4634 | 218/18723 | 1.55e-05 | 2.11e-04 | 82 |
| GO:004521612 | Liver | Cirrhotic | cell-cell junction organization | 70/4634 | 200/18723 | 7.23e-04 | 5.36e-03 | 70 |
| GO:00070437 | Liver | Cirrhotic | cell-cell junction assembly | 50/4634 | 146/18723 | 6.23e-03 | 3.09e-02 | 50 |
| GO:000716322 | Liver | HCC | establishment or maintenance of cell polarity | 133/7958 | 218/18723 | 2.48e-08 | 5.73e-07 | 133 |
| GO:0031023 | Liver | HCC | microtubule organizing center organization | 82/7958 | 143/18723 | 2.38e-04 | 1.79e-03 | 82 |
| GO:0007098 | Liver | HCC | centrosome cycle | 75/7958 | 130/18723 | 3.33e-04 | 2.34e-03 | 75 |
| GO:004521622 | Liver | HCC | cell-cell junction organization | 107/7958 | 200/18723 | 1.06e-03 | 6.11e-03 | 107 |
| GO:000704312 | Liver | HCC | cell-cell junction assembly | 76/7958 | 146/18723 | 1.23e-02 | 4.47e-02 | 76 |
| GO:000716318 | Oral cavity | OSCC | establishment or maintenance of cell polarity | 129/7305 | 218/18723 | 1.16e-09 | 2.86e-08 | 129 |
| GO:004521618 | Oral cavity | OSCC | cell-cell junction organization | 97/7305 | 200/18723 | 3.83e-03 | 1.57e-02 | 97 |
| GO:00070981 | Oral cavity | OSCC | centrosome cycle | 66/7305 | 130/18723 | 4.17e-03 | 1.70e-02 | 66 |
| Page: 1 2 3 |
| Pathway ID | Tissue | Disease Stage | Description | Gene Ratio | Bg Ratio | pvalue | p.adjust | qvalue | Count |
| hsa0453024 | Breast | IDC | Tight junction | 38/867 | 169/8465 | 2.07e-06 | 3.20e-05 | 2.39e-05 | 38 |
| hsa0453034 | Breast | IDC | Tight junction | 38/867 | 169/8465 | 2.07e-06 | 3.20e-05 | 2.39e-05 | 38 |
| hsa0453044 | Breast | DCIS | Tight junction | 37/846 | 169/8465 | 3.07e-06 | 4.20e-05 | 3.09e-05 | 37 |
| hsa0414416 | Breast | DCIS | Endocytosis | 37/846 | 251/8465 | 9.92e-03 | 4.40e-02 | 3.24e-02 | 37 |
| hsa0453054 | Breast | DCIS | Tight junction | 37/846 | 169/8465 | 3.07e-06 | 4.20e-05 | 3.09e-05 | 37 |
| hsa0414417 | Breast | DCIS | Endocytosis | 37/846 | 251/8465 | 9.92e-03 | 4.40e-02 | 3.24e-02 | 37 |
| hsa04144210 | Esophagus | ESCC | Endocytosis | 186/4205 | 251/8465 | 9.74e-16 | 4.66e-14 | 2.39e-14 | 186 |
| hsa0516510 | Esophagus | ESCC | Human papillomavirus infection | 215/4205 | 331/8465 | 7.86e-09 | 7.12e-08 | 3.65e-08 | 215 |
| hsa04530211 | Esophagus | ESCC | Tight junction | 105/4205 | 169/8465 | 6.73e-04 | 2.23e-03 | 1.14e-03 | 105 |
| hsa0436016 | Esophagus | ESCC | Axon guidance | 108/4205 | 182/8465 | 5.13e-03 | 1.30e-02 | 6.67e-03 | 108 |
| hsa0439018 | Esophagus | ESCC | Hippo signaling pathway | 92/4205 | 157/8465 | 1.46e-02 | 3.31e-02 | 1.69e-02 | 92 |
| hsa0414437 | Esophagus | ESCC | Endocytosis | 186/4205 | 251/8465 | 9.74e-16 | 4.66e-14 | 2.39e-14 | 186 |
| hsa0516515 | Esophagus | ESCC | Human papillomavirus infection | 215/4205 | 331/8465 | 7.86e-09 | 7.12e-08 | 3.65e-08 | 215 |
| hsa04530310 | Esophagus | ESCC | Tight junction | 105/4205 | 169/8465 | 6.73e-04 | 2.23e-03 | 1.14e-03 | 105 |
| hsa0436017 | Esophagus | ESCC | Axon guidance | 108/4205 | 182/8465 | 5.13e-03 | 1.30e-02 | 6.67e-03 | 108 |
| hsa0439019 | Esophagus | ESCC | Hippo signaling pathway | 92/4205 | 157/8465 | 1.46e-02 | 3.31e-02 | 1.69e-02 | 92 |
| hsa0414412 | Liver | Cirrhotic | Endocytosis | 119/2530 | 251/8465 | 2.33e-09 | 4.56e-08 | 2.81e-08 | 119 |
| hsa0453022 | Liver | Cirrhotic | Tight junction | 82/2530 | 169/8465 | 2.14e-07 | 2.85e-06 | 1.76e-06 | 82 |
| hsa05165 | Liver | Cirrhotic | Human papillomavirus infection | 124/2530 | 331/8465 | 1.55e-03 | 7.83e-03 | 4.83e-03 | 124 |
| hsa0414413 | Liver | Cirrhotic | Endocytosis | 119/2530 | 251/8465 | 2.33e-09 | 4.56e-08 | 2.81e-08 | 119 |
| Page: 1 2 |
Top |
Cell-cell communication analysis |
| Identification of potential cell-cell interactions between two cell types and their ligand-receptor pairs for different disease states |
| Ligand | Receptor | LRpair | Pathway | Tissue | Disease Stage |
| Page: 1 |
Top |
Single-cell gene regulatory network inference analysis |
| Find out the significant the regulons (TFs) and the target genes of each regulon across cell types for different disease states |
| TF | Cell Type | Tissue | Disease Stage | Target Gene | RSS | Regulon Activity |
| ∗The dot plots of a searched regulon are shown for all cell subpopulations in each disease state of each tissue based on the regulon specific score inferred using pySCENIC and by calculating the average expression. |
| Page: 1 |
Top |
Somatic mutation of malignant transformation related genes |
| Annotation of somatic variants for genes involved in malignant transformation |
| Hugo Symbol | Variant Class | Variant Classification | dbSNP RS | HGVSc | HGVSp | HGVSp Short | SWISSPROT | BIOTYPE | SIFT | PolyPhen | Tumor Sample Barcode | Tissue | Histology | Sex | Age | Stage | Therapy Types | Drugs | Outcome |
| PARD6B | SNV | Missense_Mutation | c.571N>C | p.Gly191Arg | p.G191R | Q9BYG5 | protein_coding | deleterious(0) | probably_damaging(1) | TCGA-A8-A09M-01 | Breast | breast invasive carcinoma | Female | >=65 | III/IV | Chemotherapy | paclitaxel | CR | |
| PARD6B | SNV | Missense_Mutation | c.640G>A | p.Glu214Lys | p.E214K | Q9BYG5 | protein_coding | deleterious(0) | probably_damaging(0.999) | TCGA-D8-A1J9-01 | Breast | breast invasive carcinoma | Female | <65 | I/II | Unknown | Unknown | SD | |
| PARD6B | insertion | Nonsense_Mutation | novel | c.1084_1085insACAGGACTATTAGCTGTTAATGATGAAG | p.Leu362HisfsTer7 | p.L362Hfs*7 | Q9BYG5 | protein_coding | TCGA-AN-A049-01 | Breast | breast invasive carcinoma | Female | <65 | I/II | Unknown | Unknown | SD | ||
| PARD6B | SNV | Missense_Mutation | c.355N>A | p.Val119Ile | p.V119I | Q9BYG5 | protein_coding | tolerated(0.43) | benign(0.015) | TCGA-2W-A8YY-01 | Cervix | cervical & endocervical cancer | Female | <65 | I/II | Chemotherapy | cisplatin | CR | |
| PARD6B | SNV | Missense_Mutation | c.1006N>T | p.Pro336Ser | p.P336S | Q9BYG5 | protein_coding | tolerated_low_confidence(0.31) | benign(0.001) | TCGA-FU-A3HZ-01 | Cervix | cervical & endocervical cancer | Female | <65 | I/II | Chemotherapy | cisplatin | CR | |
| PARD6B | SNV | Missense_Mutation | rs763915421 | c.743N>T | p.Pro248Leu | p.P248L | Q9BYG5 | protein_coding | deleterious(0) | probably_damaging(1) | TCGA-IR-A3LI-01 | Cervix | cervical & endocervical cancer | Female | <65 | I/II | Chemotherapy | cisplatin | CR |
| PARD6B | SNV | Missense_Mutation | novel | c.256N>G | p.Asn86Asp | p.N86D | Q9BYG5 | protein_coding | tolerated(0.06) | benign(0.281) | TCGA-VS-A8QH-01 | Cervix | cervical & endocervical cancer | Female | >=65 | I/II | Chemotherapy | gemcitabine | PD |
| PARD6B | SNV | Missense_Mutation | c.467N>A | p.Arg156His | p.R156H | Q9BYG5 | protein_coding | deleterious(0) | probably_damaging(0.992) | TCGA-AA-3492-01 | Colorectum | colon adenocarcinoma | Female | >=65 | I/II | Unknown | Unknown | SD | |
| PARD6B | SNV | Missense_Mutation | c.212N>A | p.Pro71His | p.P71H | Q9BYG5 | protein_coding | deleterious(0) | probably_damaging(0.999) | TCGA-D5-6930-01 | Colorectum | colon adenocarcinoma | Male | >=65 | I/II | Unknown | Unknown | SD | |
| PARD6B | SNV | Missense_Mutation | c.422N>T | p.Pro141Leu | p.P141L | Q9BYG5 | protein_coding | deleterious(0.02) | benign(0.17) | TCGA-BM-6198-01 | Colorectum | rectum adenocarcinoma | Male | >=65 | III/IV | Chemotherapy | xeloda | SD |
| Page: 1 2 3 |
Top |
Related drugs of malignant transformation related genes |
| Identification of chemicals and drugs interact with genes involved in malignant transfromation |
| (DGIdb 4.0) |
| Entrez ID | Symbol | Category | Interaction Types | Drug Claim Name | Drug Name | PMIDs |
| Page: 1 |

Copyright 2023-Present -The University of Texas Health Science Center at Houston |