Schematic overview of the cellular and molecular mechanisms involved in the cancer progression, including the proposed cellular and molecular mechanisms in cancer cells trajectory. AT1: alveolar type 1 cells; AT2: alveolar type 2 cells; AAH: atypical adenomatous hyperplasia; AIS: adenocarcinoma in situ; MIA: minimally invasive adenocarcinoma; IA: invasive adenocarcinoma; EMT: epithelial-mesenchymal transition

Home

Download

Statistics

Help

Contact

Center for Computational Systems Medicine
leaf

Gene summary

leaf

Malignant transformation analysis

leaf

Malignant transformation related pathway analysis

leaf

Cell-cell communication analysis

leaf

Single-cell gene regulatory network inference analysis

leaf

Somatic mutation of malignant transformation related genes

leaf

Related drugs of malignant transformation related genes

Gene: PARD3B

Gene summary for PARD3B

check button Gene summary.

Gene informationSpeciesHuman
Gene symbol

PARD3B

Gene ID

117583

Gene namepar-3 family cell polarity regulator beta
Gene AliasALS2CR19
Cytomap2q33.3
Gene Typeprotein-coding
GO ID

GO:0000226

UniProtAcc

Q8TEW8


Top

Malignant transformation analysis

check button Identification of the aberrant gene expression in precancerous and cancerous lesions by comparing the gene expression of stem-like cells in diseased tissues with normal stem cells
check button Malignant transformation involving gene list.
Entrez IDSymbolReplicatesSpeciesOrganTissueAdj P-valueLog2FCMalignancy
117583PARD3BHTA11_3410_2000001011HumanColorectumAD1.88e-55-7.90e-010.0155
117583PARD3BHTA11_2951_2000001011HumanColorectumAD3.24e-05-5.67e-010.0216
117583PARD3BHTA11_3361_2000001011HumanColorectumAD2.37e-19-6.39e-01-0.1207
117583PARD3BHTA11_5212_2000001011HumanColorectumAD7.70e-03-3.74e-01-0.2061
117583PARD3BHTA11_5216_2000001011HumanColorectumSER1.47e-08-6.37e-01-0.1462
117583PARD3BHTA11_546_2000001011HumanColorectumAD2.34e-02-4.31e-01-0.0842
117583PARD3BHTA11_9341_2000001011HumanColorectumSER2.84e-03-4.76e-01-0.00410000000000005
117583PARD3BHTA11_7862_2000001011HumanColorectumAD1.48e-03-3.32e-01-0.0179
117583PARD3BHTA11_866_3004761011HumanColorectumAD8.54e-33-7.06e-010.096
117583PARD3BHTA11_9408_2000001011HumanColorectumAD1.22e-05-7.23e-010.0451
117583PARD3BHTA11_8622_2000001021HumanColorectumSER2.33e-23-8.95e-010.0528
117583PARD3BHTA11_10623_2000001011HumanColorectumAD6.62e-03-4.39e-01-0.0177
117583PARD3BHTA11_10711_2000001011HumanColorectumAD1.94e-02-3.18e-010.0338
117583PARD3BHTA11_6818_2000001011HumanColorectumAD3.28e-04-4.53e-010.0112
117583PARD3BHTA11_11156_2000001011HumanColorectumAD6.22e-04-4.94e-010.0397
117583PARD3BHTA11_99999970781_79442HumanColorectumMSS2.65e-27-5.87e-010.294
117583PARD3BHTA11_99999965104_69814HumanColorectumMSS3.41e-06-4.50e-010.281
117583PARD3BHTA11_99999971662_82457HumanColorectumMSS4.07e-12-5.03e-010.3859
117583PARD3BHTA11_99999974143_84620HumanColorectumMSS2.60e-13-5.09e-010.3005
117583PARD3BA001-C-207HumanColorectumFAP1.82e-03-3.00e-010.1278
Page: 1 2 3 4 5 6 7 

check button Transcriptomic changes along malignancy continuum.
TissueExpression DynamicsAbbreviation
Colorectum (GSE201348)The image shows the transcriptomic changes along malignancy continuum.log2FC in expression of this searched gene in stem-like cells from each diseased tissue sample relative to stem-like cells in normal samples in each tissue plotted against the malignancy continuum. Samples are colored based on if they are from different disease stage.FAP: Familial adenomatous polyposis
CRC: Colorectal cancer
Colorectum (HTA11)The image shows the transcriptomic changes along malignancy continuum.log2FC in expression of this searched gene in stem-like cells from each diseased tissue sample relative to stem-like cells in normal samples in each tissue plotted against the malignancy continuum. Samples are colored based on if they are from different disease stage.AD: Adenomas
SER: Sessile serrated lesions
MSI-H: Microsatellite-high colorectal cancer
MSS: Microsatellite stable colorectal cancer
EndometriumThe image shows the transcriptomic changes along malignancy continuum.log2FC in expression of this searched gene in stem-like cells from each diseased tissue sample relative to stem-like cells in normal samples in each tissue plotted against the malignancy continuum. Samples are colored based on if they are from different disease stage.
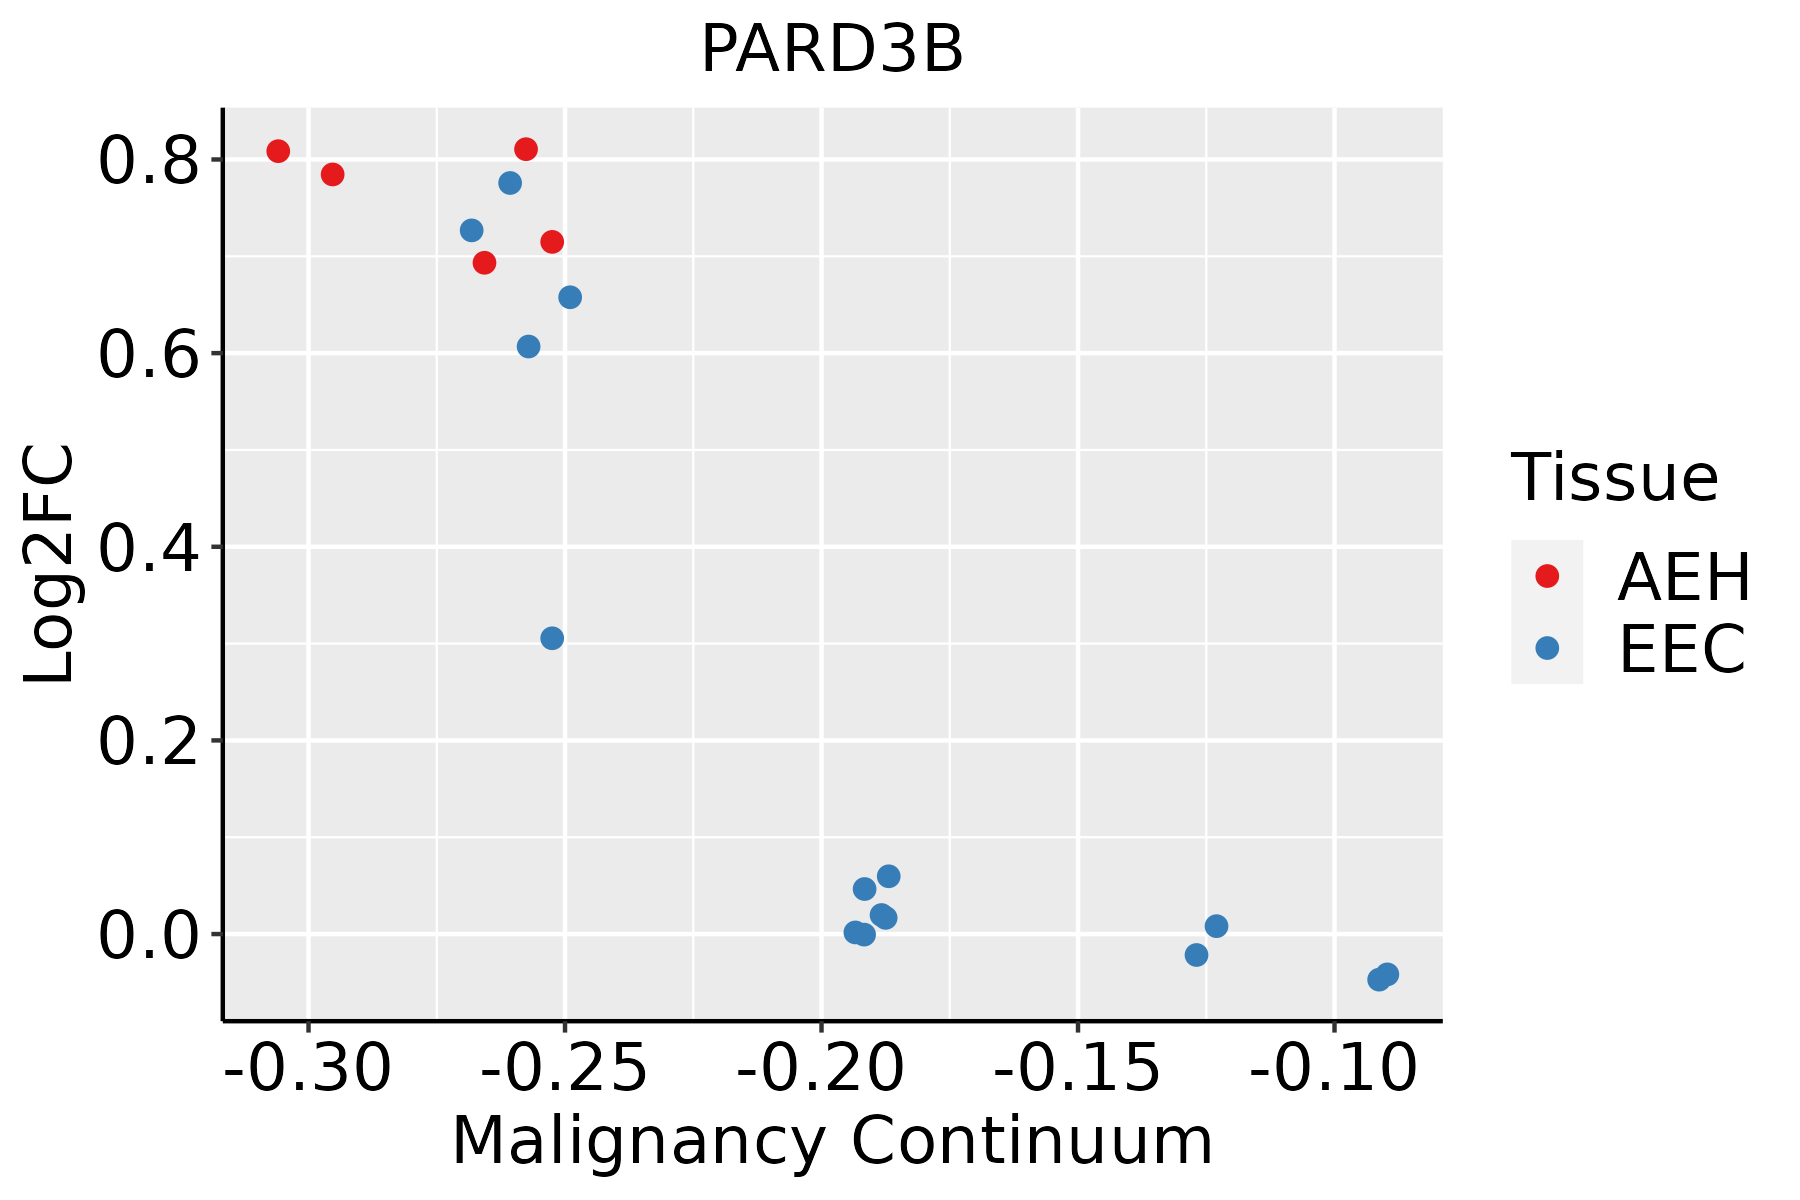
AEH: Atypical endometrial hyperplasia
EEC: Endometrioid Cancer
GCThe image shows the transcriptomic changes along malignancy continuum.log2FC in expression of this searched gene in stem-like cells from each diseased tissue sample relative to stem-like cells in normal samples in each tissue plotted against the malignancy continuum. Samples are colored based on if they are from different disease stage.CAG: Chronic atrophic gastritis
CAG with IM: Chronic atrophic gastritis with intestinal metaplasia
CSG: Chronic superficial gastritis
GC: Gastric cancer
SIM: Severe intestinal metaplasia
WIM: Wild intestinal metaplasia
LiverThe image shows the transcriptomic changes along malignancy continuum.log2FC in expression of this searched gene in stem-like cells from each diseased tissue sample relative to stem-like cells in normal samples in each tissue plotted against the malignancy continuum. Samples are colored based on if they are from different disease stage.HCC: Hepatocellular carcinoma
NAFLD: Non-alcoholic fatty liver disease
LungThe image shows the transcriptomic changes along malignancy continuum.log2FC in expression of this searched gene in stem-like cells from each diseased tissue sample relative to stem-like cells in normal samples in each tissue plotted against the malignancy continuum. Samples are colored based on if they are from different disease stage.
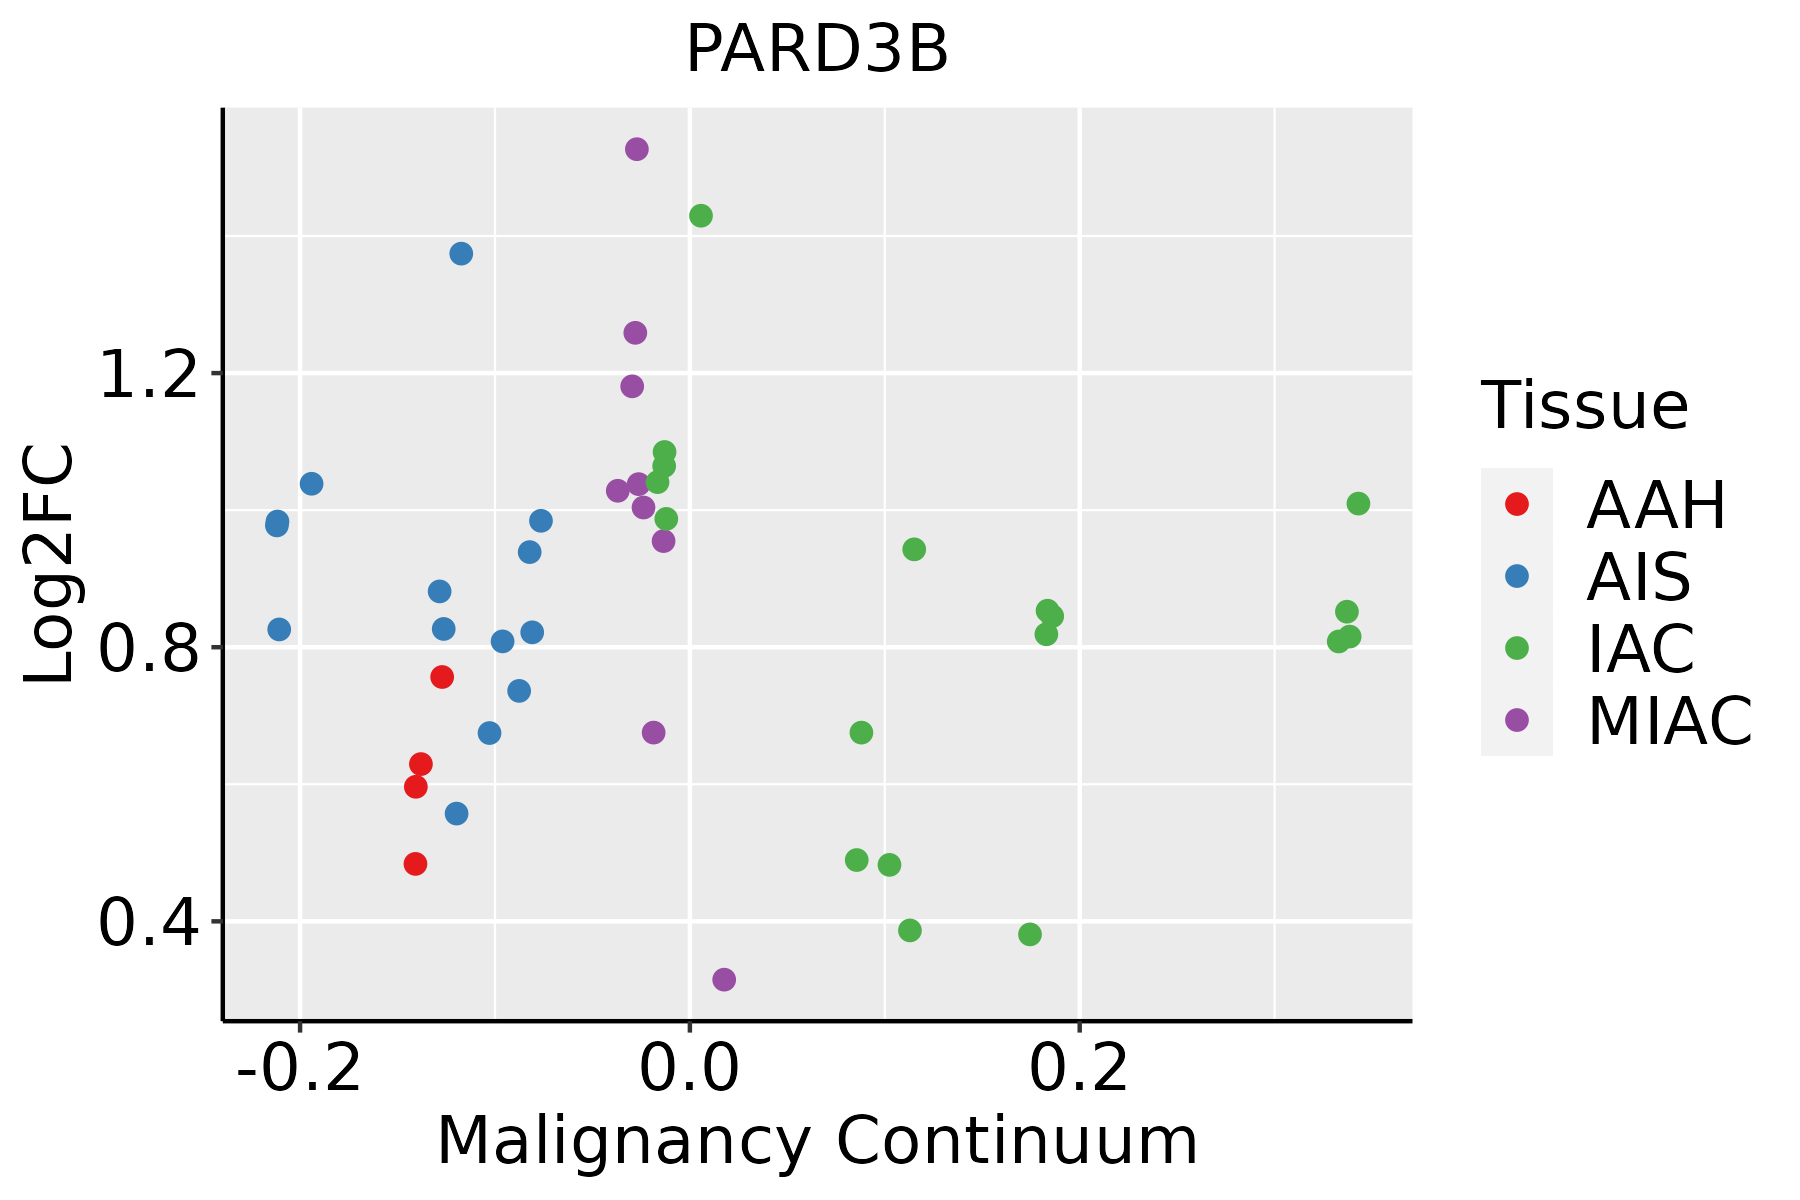
AAH: Atypical adenomatous hyperplasia
AIS: Adenocarcinoma in situ
IAC: Invasive lung adenocarcinoma
MIA: Minimally invasive adenocarcinoma
SkinThe image shows the transcriptomic changes along malignancy continuum.log2FC in expression of this searched gene in stem-like cells from each diseased tissue sample relative to stem-like cells in normal samples in each tissue plotted against the malignancy continuum. Samples are colored based on if they are from different disease stage.AK: Actinic keratosis
cSCC: Cutaneous squamous cell carcinoma
SCCIS:squamous cell carcinoma in situ
∗log2FC in expression of this searched gene in stem-like cells from each diseased tissue sample relative to stem-like cells in normal samples in each tissue plotted against the malignancy continuum. Samples are colored based on if they are from different disease stage.

Top

Malignant transformation related pathway analysis

check buttonFind out the enriched GO biological processes and KEGG pathways involved in transition from healthy to precancer to cancer
check button Figure of enriched GO biological processes.
TissueDisease StageEnriched GO biological Processes
ColorectumADGO analysis - Figure of enriched GO biological processes: Top 15 enriched GO BP terms are showed in the bar plot of each disease state in each tissue. Each row represents a significant GO biological process which is colored according to the -log10(p.adjust).
ColorectumSERGO analysis - Figure of enriched GO biological processes: Top 15 enriched GO BP terms are showed in the bar plot of each disease state in each tissue. Each row represents a significant GO biological process which is colored according to the -log10(p.adjust).
ColorectumMSSGO analysis - Figure of enriched GO biological processes: Top 15 enriched GO BP terms are showed in the bar plot of each disease state in each tissue. Each row represents a significant GO biological process which is colored according to the -log10(p.adjust).
ColorectumMSI-HGO analysis - Figure of enriched GO biological processes: Top 15 enriched GO BP terms are showed in the bar plot of each disease state in each tissue. Each row represents a significant GO biological process which is colored according to the -log10(p.adjust).
ColorectumFAPGO analysis - Figure of enriched GO biological processes: Top 15 enriched GO BP terms are showed in the bar plot of each disease state in each tissue. Each row represents a significant GO biological process which is colored according to the -log10(p.adjust).
∗Top 15 enriched GO BP terms are showed in the bar plot of each disease state in each tissue. Each row represents a significant GO biological process which is colored according to the -log10(p.adjust).
Page: 1 2 3 4 5 6 7 8 9 

check button Enriched GO biological processes.
GO IDTissueDisease StageDescriptionGene RatioBg Ratiopvaluep.adjustCount
GO:0051656ColorectumADestablishment of organelle localization131/3918390/187233.00e-092.06e-07131
GO:0007163ColorectumADestablishment or maintenance of cell polarity77/3918218/187235.72e-072.08e-0577
GO:0030010ColorectumADestablishment of cell polarity50/3918143/187236.90e-051.11e-0350
GO:0045197ColorectumADestablishment or maintenance of epithelial cell apical/basal polarity20/391844/187232.26e-042.94e-0320
GO:0035088ColorectumADestablishment or maintenance of apical/basal cell polarity21/391849/187234.31e-044.82e-0321
GO:0061245ColorectumADestablishment or maintenance of bipolar cell polarity21/391849/187234.31e-044.82e-0321
GO:0051660ColorectumADestablishment of centrosome localization7/391810/187231.15e-031.04e-027
GO:00516561ColorectumSERestablishment of organelle localization100/2897390/187231.11e-076.79e-06100
GO:00071631ColorectumSERestablishment or maintenance of cell polarity60/2897218/187233.45e-061.33e-0460
GO:00451971ColorectumSERestablishment or maintenance of epithelial cell apical/basal polarity16/289744/187235.64e-047.83e-0316
GO:00350881ColorectumSERestablishment or maintenance of apical/basal cell polarity17/289749/187237.17e-049.44e-0317
GO:00612451ColorectumSERestablishment or maintenance of bipolar cell polarity17/289749/187237.17e-049.44e-0317
GO:00300101ColorectumSERestablishment of cell polarity37/2897143/187238.72e-041.06e-0237
GO:00516562ColorectumMSSestablishment of organelle localization115/3467390/187237.30e-083.67e-06115
GO:00071632ColorectumMSSestablishment or maintenance of cell polarity72/3467218/187231.90e-078.30e-0672
GO:00300102ColorectumMSSestablishment of cell polarity47/3467143/187232.74e-055.58e-0447
GO:00451972ColorectumMSSestablishment or maintenance of epithelial cell apical/basal polarity19/346744/187231.38e-042.06e-0319
GO:00350882ColorectumMSSestablishment or maintenance of apical/basal cell polarity20/346749/187232.36e-043.24e-0320
GO:00612452ColorectumMSSestablishment or maintenance of bipolar cell polarity20/346749/187232.36e-043.24e-0320
GO:00516601ColorectumMSSestablishment of centrosome localization7/346710/187235.26e-045.99e-037
Page: 1 2 3 4 5 6 7 

check button Enriched KEGG pathways.
Pathway IDTissueDisease StageDescriptionGene RatioBg Ratiopvaluep.adjustqvalueCount
Page: 1 

Top

Cell-cell communication analysis

check buttonIdentification of potential cell-cell interactions between two cell types and their ligand-receptor pairs for different disease states
LigandReceptorLRpairPathwayTissueDisease Stage
Page: 1 

Top

Single-cell gene regulatory network inference analysis

check buttonFind out the significant the regulons (TFs) and the target genes of each regulon across cell types for different disease states
TFCell TypeTissueDisease StageTarget GeneRSSRegulon Activity
∗The dot plots of a searched regulon are shown for all cell subpopulations in each disease state of each tissue based on the regulon specific score inferred using pySCENIC and by calculating the average expression.
Page: 1 

Top

Somatic mutation of malignant transformation related genes

check buttonAnnotation of somatic variants for genes involved in malignant transformation
Hugo SymbolVariant ClassVariant ClassificationdbSNP RSHGVScHGVSpHGVSp ShortSWISSPROTBIOTYPESIFTPolyPhenTumor Sample BarcodeTissueHistologySexAgeStageTherapy TypesDrugsOutcome
PARD3BSNVMissense_Mutationnovelc.992N>Gp.Ala331Glyp.A331GQ8TEW8protein_codingtolerated(0.23)benign(0.114)TCGA-A7-A6VY-01Breastbreast invasive carcinomaFemale<65I/IIChemotherapycyclophosphamideCR
PARD3BSNVMissense_Mutationrs757121760c.2404N>Cp.Asp802Hisp.D802HQ8TEW8protein_codingtolerated(0.07)probably_damaging(0.999)TCGA-BH-A2L8-01Breastbreast invasive carcinomaFemale<65I/IIChemotherapycytoxanCR
PARD3BSNVMissense_Mutationnovelc.1316N>Ap.Arg439Lysp.R439KQ8TEW8protein_codingtolerated(0.26)probably_damaging(0.985)TCGA-C8-A275-01Breastbreast invasive carcinomaFemale<65I/IIUnknownUnknownSD
PARD3BSNVMissense_Mutationnovelc.2244G>Cp.Glu748Aspp.E748DQ8TEW8protein_codingdeleterious(0)probably_damaging(0.984)TCGA-E2-A574-01Breastbreast invasive carcinomaFemale<65I/IIChemotherapyadriamycinSD
PARD3BdeletionFrame_Shift_Delc.1570_1577delNNNNNNNNp.Leu525PhefsTer13p.L525Ffs*13Q8TEW8protein_codingTCGA-A8-A06X-01Breastbreast invasive carcinomaFemale>=65I/IIUnknownUnknownSD
PARD3BSNVMissense_Mutationnovelc.2668N>Ap.Glu890Lysp.E890KQ8TEW8protein_codingtolerated(0.37)benign(0.039)TCGA-C5-A3HD-01Cervixcervical & endocervical cancerFemale<65I/IIChemotherapycisplatinSD
PARD3BSNVMissense_Mutationc.2335N>Ap.Glu779Lysp.E779KQ8TEW8protein_codingdeleterious(0)probably_damaging(0.989)TCGA-C5-A7UC-01Cervixcervical & endocervical cancerFemale<65I/IIUnknownUnknownSD
PARD3BSNVMissense_Mutationnovelc.2643N>Tp.Lys881Asnp.K881NQ8TEW8protein_codingdeleterious(0.01)probably_damaging(0.991)TCGA-EA-A3HU-01Cervixcervical & endocervical cancerFemale<65I/IIUnknownUnknownSD
PARD3BSNVMissense_Mutationnovelc.1441N>Ap.Glu481Lysp.E481KQ8TEW8protein_codingdeleterious(0)probably_damaging(0.977)TCGA-JW-A5VL-01Cervixcervical & endocervical cancerFemale<65I/IIUnknownUnknownSD
PARD3BSNVMissense_Mutationc.917N>Gp.Ile306Serp.I306SQ8TEW8protein_codingtolerated(0.6)benign(0.018)TCGA-A6-3809-01Colorectumcolon adenocarcinomaFemale>=65I/IIUnknownUnknownSD
Page: 1 2 3 4 5 6 7 8 9 10 11 12 13 14 15 16 17 

Top

Related drugs of malignant transformation related genes

check buttonIdentification of chemicals and drugs interact with genes involved in malignant transfromation
(DGIdb 4.0)
Entrez IDSymbolCategoryInteraction TypesDrug Claim NameDrug NamePMIDs
117583PARD3BNAoxaliplatinOXALIPLATIN22310351
117583PARD3BNAfluorouracilFLUOROURACIL22310351
Page: 1