
|
|||||
|
 | |
| |
| |
| |
| |
| |
|
Gene: PARD3 |
Gene summary for PARD3 |
| Gene information | Species | Human | Gene symbol | PARD3 | Gene ID | 56288 |
| Gene name | par-3 family cell polarity regulator | |
| Gene Alias | ASIP | |
| Cytomap | 10p11.22-p11.21 | |
| Gene Type | protein-coding | GO ID | GO:0000226 | UniProtAcc | Q8TEW0 |
Top |
Malignant transformation analysis |
| Identification of the aberrant gene expression in precancerous and cancerous lesions by comparing the gene expression of stem-like cells in diseased tissues with normal stem cells |
| Entrez ID | Symbol | Replicates | Species | Organ | Tissue | Adj P-value | Log2FC | Malignancy |
| 56288 | PARD3 | CA_HPV_1 | Human | Cervix | CC | 1.81e-04 | -1.66e-01 | 0.0264 |
| 56288 | PARD3 | CA_HPV_3 | Human | Cervix | CC | 1.82e-05 | 2.16e-01 | 0.0414 |
| 56288 | PARD3 | CCI_1 | Human | Cervix | CC | 6.58e-33 | 2.76e+00 | 0.528 |
| 56288 | PARD3 | CCI_2 | Human | Cervix | CC | 2.00e-17 | 2.39e+00 | 0.5249 |
| 56288 | PARD3 | CCI_3 | Human | Cervix | CC | 4.06e-44 | 2.55e+00 | 0.516 |
| 56288 | PARD3 | CCII_1 | Human | Cervix | CC | 4.96e-22 | 7.81e-01 | 0.3249 |
| 56288 | PARD3 | HTA11_3410_2000001011 | Human | Colorectum | AD | 2.65e-26 | -6.21e-01 | 0.0155 |
| 56288 | PARD3 | HTA11_2951_2000001011 | Human | Colorectum | AD | 1.02e-05 | -7.74e-01 | 0.0216 |
| 56288 | PARD3 | HTA11_1938_2000001011 | Human | Colorectum | AD | 2.23e-06 | 4.11e-01 | -0.0811 |
| 56288 | PARD3 | HTA11_347_2000001011 | Human | Colorectum | AD | 3.78e-21 | 9.00e-01 | -0.1954 |
| 56288 | PARD3 | HTA11_411_2000001011 | Human | Colorectum | SER | 5.52e-13 | 6.91e-01 | -0.2602 |
| 56288 | PARD3 | HTA11_1391_2000001011 | Human | Colorectum | AD | 1.66e-02 | 4.51e-01 | -0.059 |
| 56288 | PARD3 | HTA11_866_3004761011 | Human | Colorectum | AD | 1.05e-02 | -4.33e-01 | 0.096 |
| 56288 | PARD3 | HTA11_9408_2000001011 | Human | Colorectum | AD | 5.68e-03 | -3.99e-01 | 0.0451 |
| 56288 | PARD3 | HTA11_7696_3000711011 | Human | Colorectum | AD | 1.82e-02 | -2.80e-01 | 0.0674 |
| 56288 | PARD3 | HTA11_99999970781_79442 | Human | Colorectum | MSS | 1.70e-11 | -4.56e-01 | 0.294 |
| 56288 | PARD3 | HTA11_99999965104_69814 | Human | Colorectum | MSS | 2.69e-23 | 9.74e-01 | 0.281 |
| 56288 | PARD3 | HTA11_99999971662_82457 | Human | Colorectum | MSS | 3.73e-02 | -1.79e-02 | 0.3859 |
| 56288 | PARD3 | HTA11_99999973899_84307 | Human | Colorectum | MSS | 5.88e-04 | -5.88e-01 | 0.2585 |
| 56288 | PARD3 | HTA11_99999974143_84620 | Human | Colorectum | MSS | 2.28e-66 | -9.29e-01 | 0.3005 |
| Page: 1 2 3 4 5 6 7 8 9 10 11 12 13 14 |
| Tissue | Expression Dynamics | Abbreviation |
| Cervix |  | CC: Cervix cancer |
| HSIL_HPV: HPV-infected high-grade squamous intraepithelial lesions | ||
| N_HPV: HPV-infected normal cervix | ||
| Colorectum (GSE201348) |  | FAP: Familial adenomatous polyposis |
| CRC: Colorectal cancer | ||
| Colorectum (HTA11) |  | AD: Adenomas |
| SER: Sessile serrated lesions | ||
| MSI-H: Microsatellite-high colorectal cancer | ||
| MSS: Microsatellite stable colorectal cancer | ||
| Endometrium | 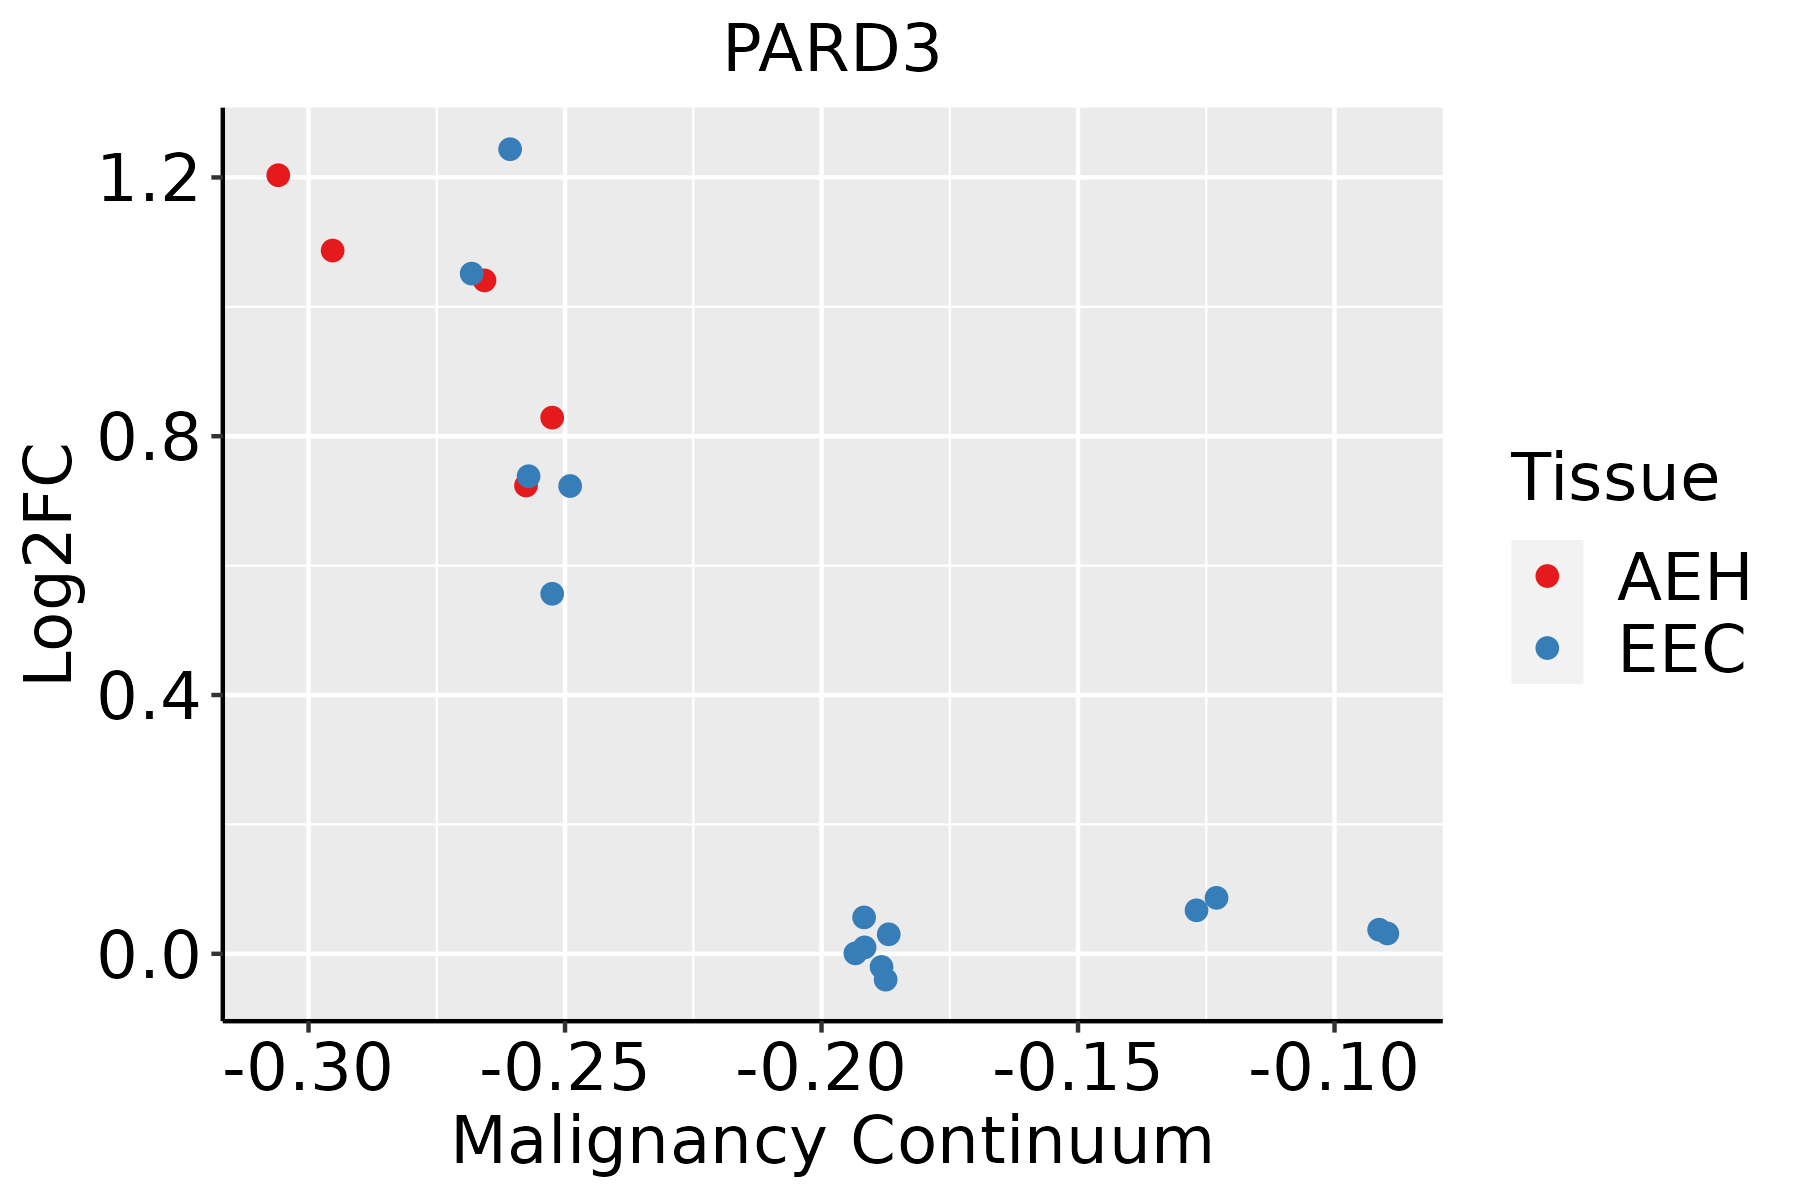 | AEH: Atypical endometrial hyperplasia |
| EEC: Endometrioid Cancer | ||
| Esophagus |  | ESCC: Esophageal squamous cell carcinoma |
| HGIN: High-grade intraepithelial neoplasias | ||
| LGIN: Low-grade intraepithelial neoplasias | ||
| GC | 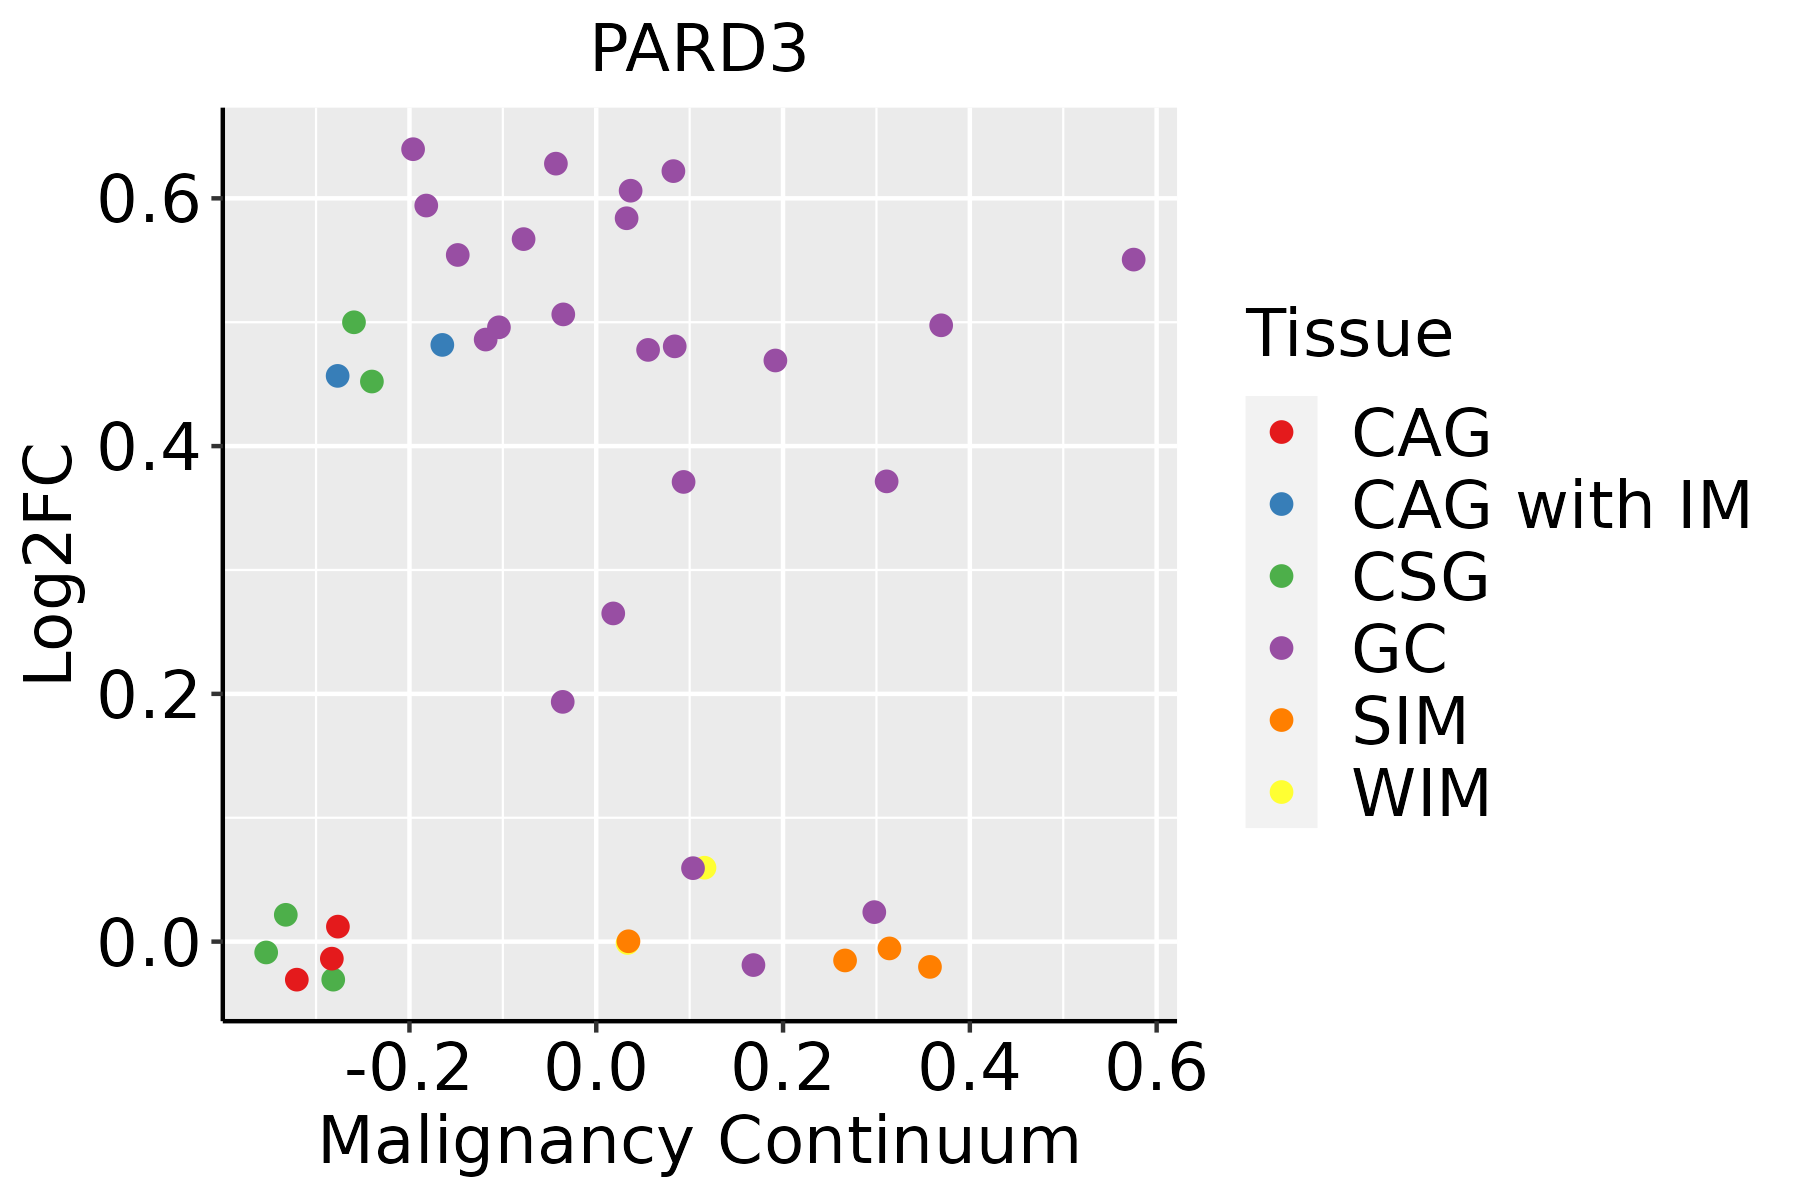 | CAG: Chronic atrophic gastritis |
| CAG with IM: Chronic atrophic gastritis with intestinal metaplasia | ||
| CSG: Chronic superficial gastritis | ||
| GC: Gastric cancer | ||
| SIM: Severe intestinal metaplasia | ||
| WIM: Wild intestinal metaplasia | ||
| Liver |  | HCC: Hepatocellular carcinoma |
| NAFLD: Non-alcoholic fatty liver disease | ||
| Lung | 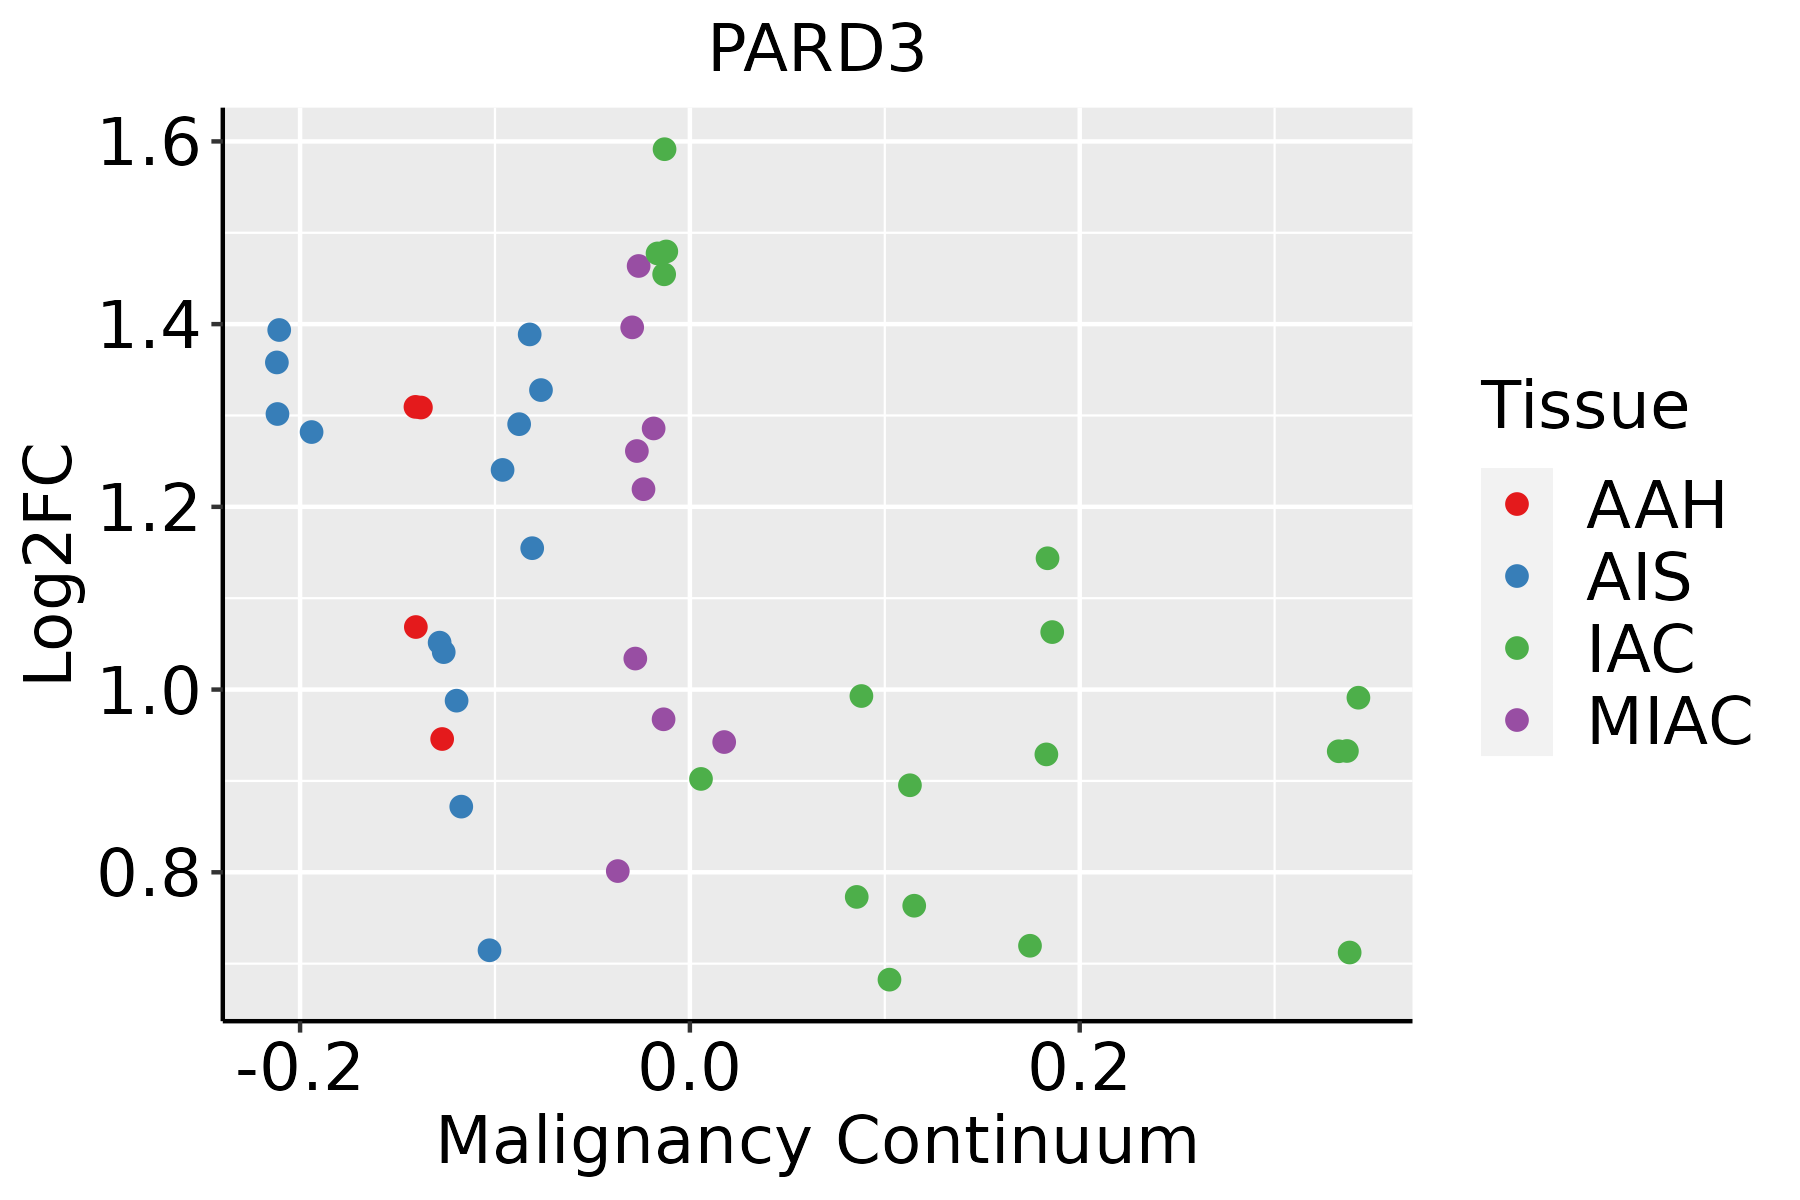 | AAH: Atypical adenomatous hyperplasia |
| AIS: Adenocarcinoma in situ | ||
| IAC: Invasive lung adenocarcinoma | ||
| MIA: Minimally invasive adenocarcinoma | ||
| Oral Cavity | 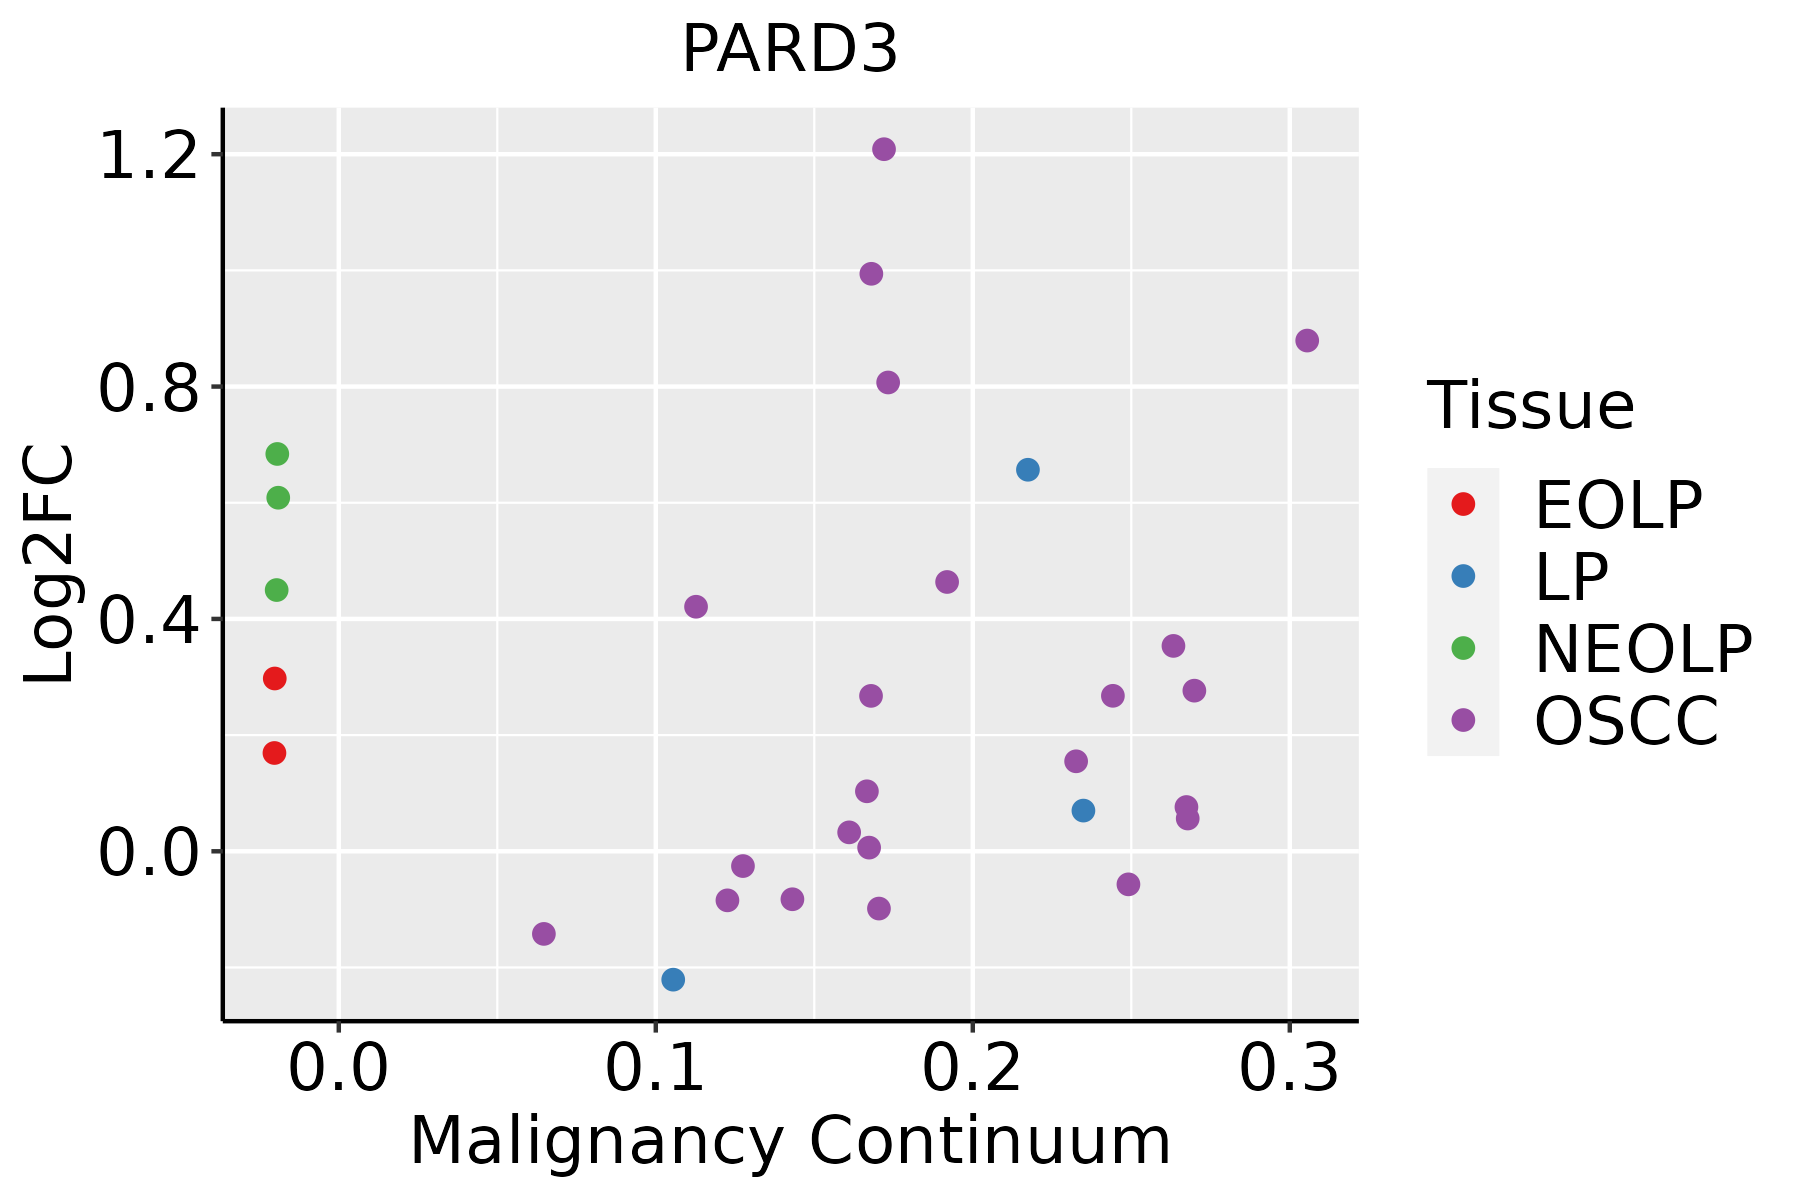 | EOLP: Erosive Oral lichen planus |
| LP: leukoplakia | ||
| NEOLP: Non-erosive oral lichen planus | ||
| OSCC: Oral squamous cell carcinoma | ||
| Prostate |  | BPH: Benign Prostatic Hyperplasia |
| Skin | 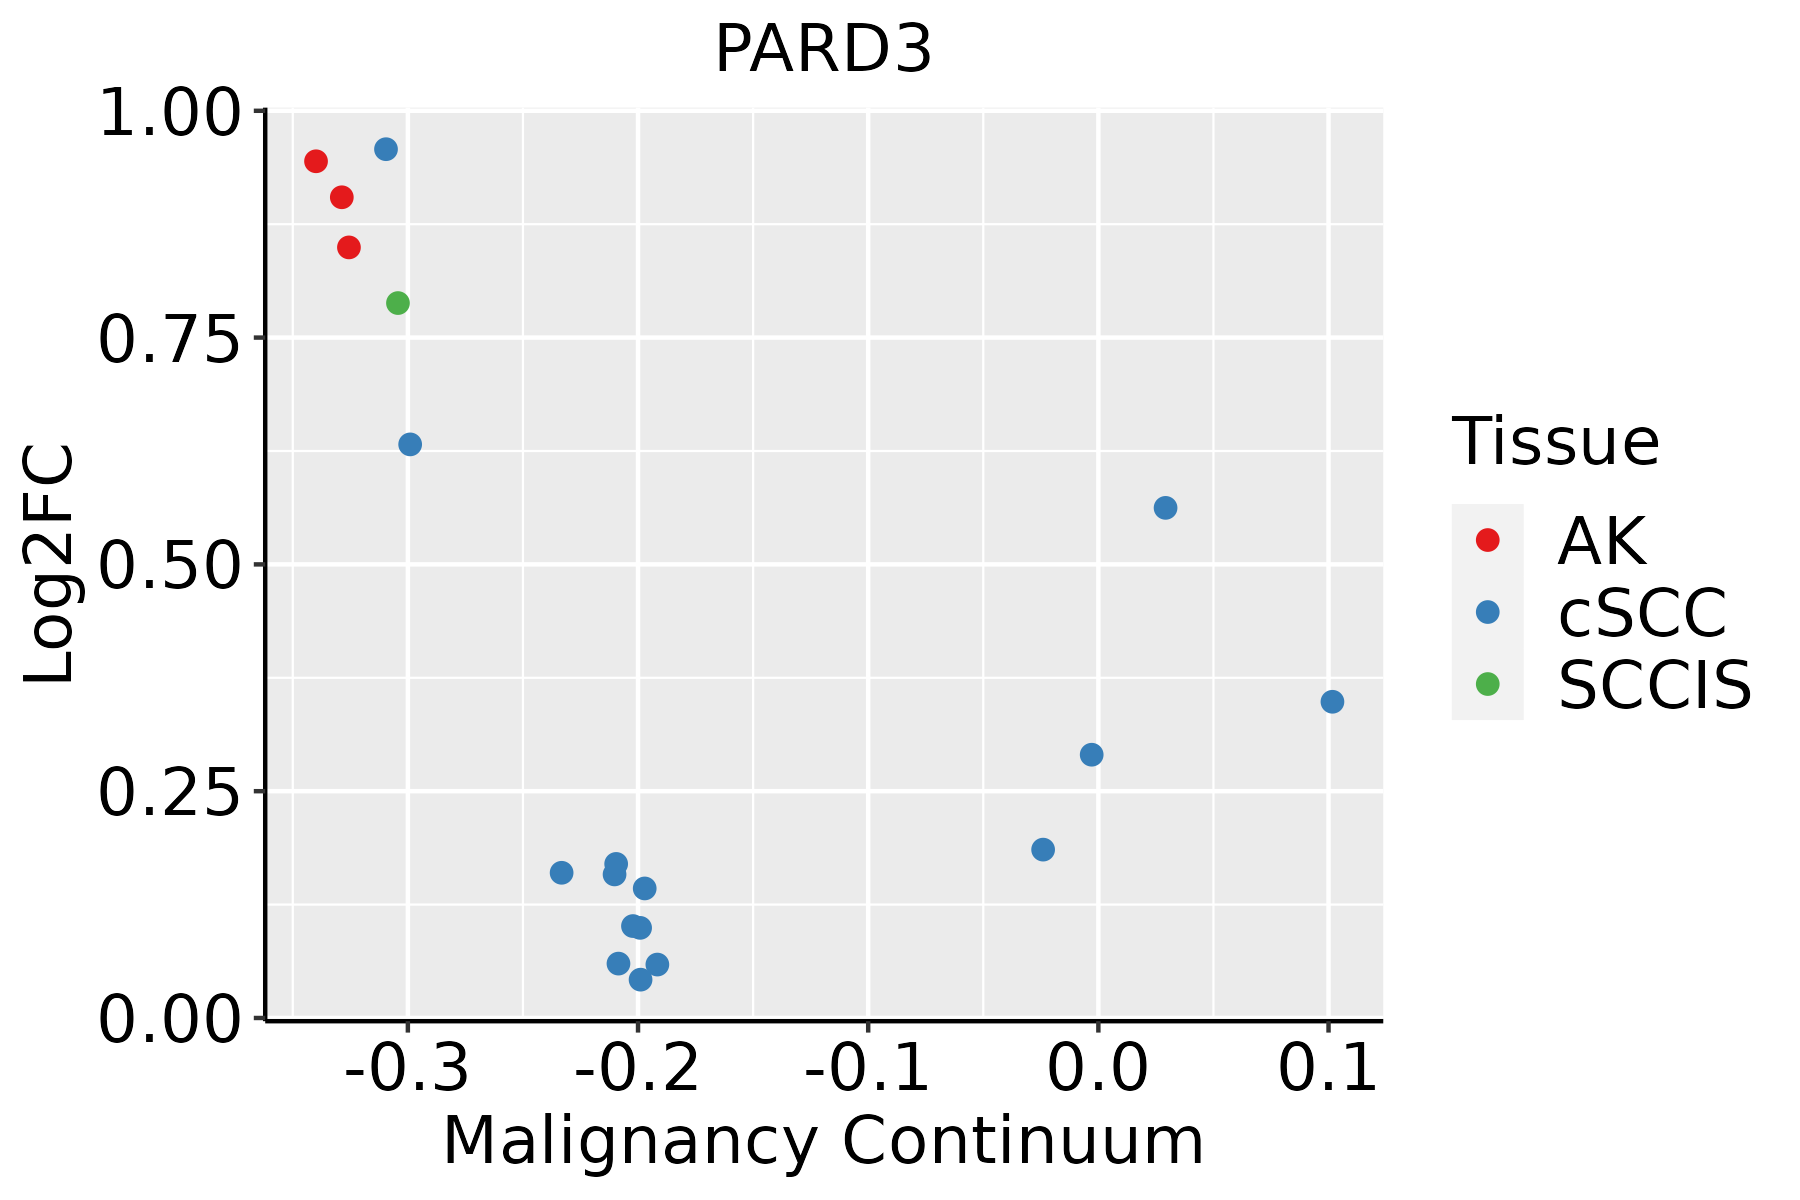 | AK: Actinic keratosis |
| cSCC: Cutaneous squamous cell carcinoma | ||
| SCCIS:squamous cell carcinoma in situ | ||
| Thyroid |  | ATC: Anaplastic thyroid cancer |
| HT: Hashimoto's thyroiditis | ||
| PTC: Papillary thyroid cancer |
| ∗log2FC in expression of this searched gene in stem-like cells from each diseased tissue sample relative to stem-like cells in normal samples in each tissue plotted against the malignancy continuum. Samples are colored based on if they are from different disease stage. |
Top |
Malignant transformation related pathway analysis |
| Find out the enriched GO biological processes and KEGG pathways involved in transition from healthy to precancer to cancer |
| Tissue | Disease Stage | Enriched GO biological Processes |
| Colorectum | AD |  |
| Colorectum | SER |  |
| Colorectum | MSS |  |
| Colorectum | MSI-H |  |
| Colorectum | FAP |  |
| ∗Top 15 enriched GO BP terms are showed in the bar plot of each disease state in each tissue. Each row represents a significant GO biological process which is colored according to the -log10(p.adjust). |
| Page: 1 2 3 4 5 6 7 8 9 |
| GO ID | Tissue | Disease Stage | Description | Gene Ratio | Bg Ratio | pvalue | p.adjust | Count |
| GO:00071639 | Cervix | CC | establishment or maintenance of cell polarity | 63/2311 | 218/18723 | 4.25e-11 | 8.76e-09 | 63 |
| GO:00452169 | Cervix | CC | cell-cell junction organization | 53/2311 | 200/18723 | 3.83e-08 | 2.53e-06 | 53 |
| GO:00300108 | Cervix | CC | establishment of cell polarity | 42/2311 | 143/18723 | 4.30e-08 | 2.62e-06 | 42 |
| GO:00343298 | Cervix | CC | cell junction assembly | 88/2311 | 420/18723 | 3.42e-07 | 1.38e-05 | 88 |
| GO:00070439 | Cervix | CC | cell-cell junction assembly | 39/2311 | 146/18723 | 1.86e-06 | 5.94e-05 | 39 |
| GO:000660510 | Cervix | CC | protein targeting | 68/2311 | 314/18723 | 2.17e-06 | 6.55e-05 | 68 |
| GO:004593610 | Cervix | CC | negative regulation of phosphate metabolic process | 88/2311 | 441/18723 | 2.92e-06 | 8.27e-05 | 88 |
| GO:001056310 | Cervix | CC | negative regulation of phosphorus metabolic process | 88/2311 | 442/18723 | 3.21e-06 | 8.77e-05 | 88 |
| GO:004232610 | Cervix | CC | negative regulation of phosphorylation | 77/2311 | 385/18723 | 1.09e-05 | 2.38e-04 | 77 |
| GO:00432978 | Cervix | CC | apical junction assembly | 24/2311 | 78/18723 | 1.36e-05 | 2.73e-04 | 24 |
| GO:00615647 | Cervix | CC | axon development | 89/2311 | 467/18723 | 1.71e-05 | 3.27e-04 | 89 |
| GO:000193310 | Cervix | CC | negative regulation of protein phosphorylation | 69/2311 | 342/18723 | 2.29e-05 | 4.01e-04 | 69 |
| GO:00516567 | Cervix | CC | establishment of organelle localization | 76/2311 | 390/18723 | 3.17e-05 | 5.21e-04 | 76 |
| GO:00901509 | Cervix | CC | establishment of protein localization to membrane | 54/2311 | 260/18723 | 7.67e-05 | 1.05e-03 | 54 |
| GO:00074097 | Cervix | CC | axonogenesis | 78/2311 | 418/18723 | 1.14e-04 | 1.43e-03 | 78 |
| GO:01201927 | Cervix | CC | tight junction assembly | 21/2311 | 74/18723 | 1.69e-04 | 2.00e-03 | 21 |
| GO:01201937 | Cervix | CC | tight junction organization | 22/2311 | 80/18723 | 1.97e-04 | 2.26e-03 | 22 |
| GO:00901627 | Cervix | CC | establishment of epithelial cell polarity | 11/2311 | 31/18723 | 7.87e-04 | 6.96e-03 | 11 |
| GO:00519603 | Cervix | CC | regulation of nervous system development | 77/2311 | 443/18723 | 1.13e-03 | 9.30e-03 | 77 |
| GO:00618425 | Cervix | CC | microtubule organizing center localization | 11/2311 | 33/18723 | 1.42e-03 | 1.11e-02 | 11 |
| Page: 1 2 3 4 5 6 7 8 9 10 11 12 13 14 15 16 17 18 19 20 21 22 23 24 25 26 27 28 29 30 31 32 33 34 35 |
| Pathway ID | Tissue | Disease Stage | Description | Gene Ratio | Bg Ratio | pvalue | p.adjust | qvalue | Count |
| hsa0452020 | Cervix | CC | Adherens junction | 33/1267 | 93/8465 | 6.99e-07 | 7.31e-06 | 4.32e-06 | 33 |
| hsa0453020 | Cervix | CC | Tight junction | 49/1267 | 169/8465 | 1.87e-06 | 1.78e-05 | 1.05e-05 | 49 |
| hsa0401512 | Cervix | CC | Rap1 signaling pathway | 56/1267 | 210/8465 | 6.23e-06 | 5.61e-05 | 3.32e-05 | 56 |
| hsa0414418 | Cervix | CC | Endocytosis | 64/1267 | 251/8465 | 6.97e-06 | 6.10e-05 | 3.61e-05 | 64 |
| hsa043609 | Cervix | CC | Axon guidance | 47/1267 | 182/8465 | 8.13e-05 | 5.38e-04 | 3.18e-04 | 47 |
| hsa051657 | Cervix | CC | Human papillomavirus infection | 74/1267 | 331/8465 | 1.70e-04 | 1.02e-03 | 6.03e-04 | 74 |
| hsa043908 | Cervix | CC | Hippo signaling pathway | 40/1267 | 157/8465 | 3.64e-04 | 1.82e-03 | 1.07e-03 | 40 |
| hsa04062 | Cervix | CC | Chemokine signaling pathway | 43/1267 | 192/8465 | 3.60e-03 | 1.34e-02 | 7.91e-03 | 43 |
| hsa04520110 | Cervix | CC | Adherens junction | 33/1267 | 93/8465 | 6.99e-07 | 7.31e-06 | 4.32e-06 | 33 |
| hsa04530110 | Cervix | CC | Tight junction | 49/1267 | 169/8465 | 1.87e-06 | 1.78e-05 | 1.05e-05 | 49 |
| hsa0401513 | Cervix | CC | Rap1 signaling pathway | 56/1267 | 210/8465 | 6.23e-06 | 5.61e-05 | 3.32e-05 | 56 |
| hsa0414419 | Cervix | CC | Endocytosis | 64/1267 | 251/8465 | 6.97e-06 | 6.10e-05 | 3.61e-05 | 64 |
| hsa0436012 | Cervix | CC | Axon guidance | 47/1267 | 182/8465 | 8.13e-05 | 5.38e-04 | 3.18e-04 | 47 |
| hsa0516512 | Cervix | CC | Human papillomavirus infection | 74/1267 | 331/8465 | 1.70e-04 | 1.02e-03 | 6.03e-04 | 74 |
| hsa0439013 | Cervix | CC | Hippo signaling pathway | 40/1267 | 157/8465 | 3.64e-04 | 1.82e-03 | 1.07e-03 | 40 |
| hsa040621 | Cervix | CC | Chemokine signaling pathway | 43/1267 | 192/8465 | 3.60e-03 | 1.34e-02 | 7.91e-03 | 43 |
| hsa04144 | Colorectum | AD | Endocytosis | 111/2092 | 251/8465 | 5.95e-12 | 1.42e-10 | 9.08e-11 | 111 |
| hsa04520 | Colorectum | AD | Adherens junction | 50/2092 | 93/8465 | 1.52e-09 | 2.83e-08 | 1.81e-08 | 50 |
| hsa04530 | Colorectum | AD | Tight junction | 76/2092 | 169/8465 | 5.49e-09 | 9.69e-08 | 6.18e-08 | 76 |
| hsa04015 | Colorectum | AD | Rap1 signaling pathway | 71/2092 | 210/8465 | 1.72e-03 | 9.68e-03 | 6.18e-03 | 71 |
| Page: 1 2 3 4 5 6 7 8 9 10 11 12 13 |
Top |
Cell-cell communication analysis |
| Identification of potential cell-cell interactions between two cell types and their ligand-receptor pairs for different disease states |
| Ligand | Receptor | LRpair | Pathway | Tissue | Disease Stage |
| GZMA | PARD3 | GZMA_PARD3 | PARs | Breast | ADJ |
| PRSS3 | PARD3 | PRSS3_PARD3 | PARs | Cervix | CC |
| CTSG | PARD3 | CTSG_PARD3 | PARs | Cervix | CC |
| GZMA | PARD3 | GZMA_PARD3 | PARs | Cervix | CC |
| PRSS3 | PARD3 | PRSS3_PARD3 | PARs | CRC | AD |
| CTSG | PARD3 | CTSG_PARD3 | PARs | CRC | AD |
| GZMA | PARD3 | GZMA_PARD3 | PARs | CRC | AD |
| PRSS3 | PARD3 | PRSS3_PARD3 | PARs | CRC | ADJ |
| CTSG | PARD3 | CTSG_PARD3 | PARs | CRC | ADJ |
| GZMA | PARD3 | GZMA_PARD3 | PARs | CRC | ADJ |
| PRSS3 | PARD3 | PRSS3_PARD3 | PARs | CRC | CRC |
| PRSS3 | PARD3 | PRSS3_PARD3 | PARs | CRC | Healthy |
| PRSS3 | PARD3 | PRSS3_PARD3 | PARs | CRC | MSI-H |
| GZMA | PARD3 | GZMA_PARD3 | PARs | CRC | MSI-H |
| PRSS3 | PARD3 | PRSS3_PARD3 | PARs | CRC | MSS |
| GZMA | PARD3 | GZMA_PARD3 | PARs | CRC | MSS |
| CTSG | PARD3 | CTSG_PARD3 | PARs | CRC | SER |
| GZMA | PARD3 | GZMA_PARD3 | PARs | CRC | SER |
| CTSG | PARD3 | CTSG_PARD3 | PARs | Endometrium | ADJ |
| GZMA | PARD3 | GZMA_PARD3 | PARs | Endometrium | ADJ |
| Page: 1 |
Top |
Single-cell gene regulatory network inference analysis |
| Find out the significant the regulons (TFs) and the target genes of each regulon across cell types for different disease states |
| TF | Cell Type | Tissue | Disease Stage | Target Gene | RSS | Regulon Activity |
| ∗The dot plots of a searched regulon are shown for all cell subpopulations in each disease state of each tissue based on the regulon specific score inferred using pySCENIC and by calculating the average expression. |
| Page: 1 |
Top |
Somatic mutation of malignant transformation related genes |
| Annotation of somatic variants for genes involved in malignant transformation |
| Hugo Symbol | Variant Class | Variant Classification | dbSNP RS | HGVSc | HGVSp | HGVSp Short | SWISSPROT | BIOTYPE | SIFT | PolyPhen | Tumor Sample Barcode | Tissue | Histology | Sex | Age | Stage | Therapy Types | Drugs | Outcome |
| PARD3 | SNV | Missense_Mutation | c.3714N>G | p.Asp1238Glu | p.D1238E | Q8TEW0 | protein_coding | deleterious_low_confidence(0.04) | probably_damaging(0.99) | TCGA-AR-A1AQ-01 | Breast | breast invasive carcinoma | Female | <65 | I/II | Chemotherapy | doxorubicin | SD | |
| PARD3 | SNV | Missense_Mutation | rs566752362 | c.2728N>T | p.Arg910Cys | p.R910C | Q8TEW0 | protein_coding | deleterious(0) | probably_damaging(0.995) | TCGA-AR-A1AV-01 | Breast | breast invasive carcinoma | Male | >=65 | I/II | Chemotherapy | cytoxan | SD |
| PARD3 | SNV | Missense_Mutation | c.1741N>A | p.Asp581Asn | p.D581N | Q8TEW0 | protein_coding | deleterious(0.03) | benign(0.116) | TCGA-D8-A1XJ-01 | Breast | breast invasive carcinoma | Female | >=65 | III/IV | Hormone Therapy | tamoxiphen | SD | |
| PARD3 | SNV | Missense_Mutation | c.2826N>A | p.Asp942Glu | p.D942E | Q8TEW0 | protein_coding | tolerated(0.12) | probably_damaging(0.992) | TCGA-E2-A15T-01 | Breast | breast invasive carcinoma | Female | >=65 | I/II | Hormone Therapy | arimidex | SD | |
| PARD3 | insertion | Frame_Shift_Ins | novel | c.3814_3815insTTTTTTTAAAACCTCGATGGTACTATGGAGTATTTCTGTTGTT | p.Gly1272ValfsTer54 | p.G1272Vfs*54 | Q8TEW0 | protein_coding | TCGA-A8-A06P-01 | Breast | breast invasive carcinoma | Female | <65 | III/IV | Unspecific | SD | |||
| PARD3 | insertion | Nonsense_Mutation | novel | c.1625_1626insATTAATTATACAAATATAGGTCTTGTTACTTAGGATGACA | p.Val544IlefsTer5 | p.V544Ifs*5 | Q8TEW0 | protein_coding | TCGA-BH-A0HF-01 | Breast | breast invasive carcinoma | Female | >=65 | I/II | Hormone Therapy | arimidex | SD | ||
| PARD3 | SNV | Missense_Mutation | rs768549956 | c.3613C>T | p.Arg1205Trp | p.R1205W | Q8TEW0 | protein_coding | deleterious_low_confidence(0) | probably_damaging(0.928) | TCGA-2W-A8YY-01 | Cervix | cervical & endocervical cancer | Female | <65 | I/II | Chemotherapy | cisplatin | CR |
| PARD3 | SNV | Missense_Mutation | novel | c.2885C>A | p.Ser962Tyr | p.S962Y | Q8TEW0 | protein_coding | deleterious(0) | probably_damaging(0.997) | TCGA-2W-A8YY-01 | Cervix | cervical & endocervical cancer | Female | <65 | I/II | Chemotherapy | cisplatin | CR |
| PARD3 | SNV | Missense_Mutation | c.3253G>C | p.Asp1085His | p.D1085H | Q8TEW0 | protein_coding | tolerated(0.12) | probably_damaging(0.999) | TCGA-DG-A2KK-01 | Cervix | cervical & endocervical cancer | Female | <65 | III/IV | Chemotherapy | cisplatin | SD | |
| PARD3 | SNV | Missense_Mutation | rs377613171 | c.3701C>T | p.Ser1234Leu | p.S1234L | Q8TEW0 | protein_coding | deleterious_low_confidence(0.01) | benign(0.124) | TCGA-EA-A50E-01 | Cervix | cervical & endocervical cancer | Female | <65 | I/II | Unknown | Unknown | PD |
| Page: 1 2 3 4 5 6 7 8 9 10 11 12 13 14 15 16 17 |
Top |
Related drugs of malignant transformation related genes |
| Identification of chemicals and drugs interact with genes involved in malignant transfromation |
| (DGIdb 4.0) |
| Entrez ID | Symbol | Category | Interaction Types | Drug Claim Name | Drug Name | PMIDs |
| Page: 1 |

Copyright 2023-Present -The University of Texas Health Science Center at Houston |