
|
|||||
|
 | |
| |
| |
| |
| |
| |
|
Gene: PAQR8 |
Gene summary for PAQR8 |
| Gene information | Species | Human | Gene symbol | PAQR8 | Gene ID | 85315 |
| Gene name | progestin and adipoQ receptor family member 8 | |
| Gene Alias | C6orf33 | |
| Cytomap | 6p12.2 | |
| Gene Type | protein-coding | GO ID | GO:0000003 | UniProtAcc | B3KXW6 |
Top |
Malignant transformation analysis |
| Identification of the aberrant gene expression in precancerous and cancerous lesions by comparing the gene expression of stem-like cells in diseased tissues with normal stem cells |
| Entrez ID | Symbol | Replicates | Species | Organ | Tissue | Adj P-value | Log2FC | Malignancy |
| 85315 | PAQR8 | HTA11_3410_2000001011 | Human | Colorectum | AD | 7.21e-13 | 2.65e-01 | 0.0155 |
| 85315 | PAQR8 | HTA11_2487_2000001011 | Human | Colorectum | SER | 1.83e-24 | 7.29e-01 | -0.1808 |
| 85315 | PAQR8 | HTA11_2951_2000001011 | Human | Colorectum | AD | 3.40e-03 | 2.52e-01 | 0.0216 |
| 85315 | PAQR8 | HTA11_1938_2000001011 | Human | Colorectum | AD | 1.30e-28 | 8.90e-01 | -0.0811 |
| 85315 | PAQR8 | HTA11_78_2000001011 | Human | Colorectum | AD | 5.43e-34 | 8.15e-01 | -0.1088 |
| 85315 | PAQR8 | HTA11_347_2000001011 | Human | Colorectum | AD | 1.57e-51 | 1.03e+00 | -0.1954 |
| 85315 | PAQR8 | HTA11_411_2000001011 | Human | Colorectum | SER | 7.44e-09 | 6.31e-01 | -0.2602 |
| 85315 | PAQR8 | HTA11_2112_2000001011 | Human | Colorectum | SER | 8.76e-08 | 4.80e-01 | -0.2196 |
| 85315 | PAQR8 | HTA11_3361_2000001011 | Human | Colorectum | AD | 8.49e-18 | 5.37e-01 | -0.1207 |
| 85315 | PAQR8 | HTA11_83_2000001011 | Human | Colorectum | SER | 4.15e-23 | 7.05e-01 | -0.1526 |
| 85315 | PAQR8 | HTA11_696_2000001011 | Human | Colorectum | AD | 1.23e-23 | 5.14e-01 | -0.1464 |
| 85315 | PAQR8 | HTA11_866_2000001011 | Human | Colorectum | AD | 2.46e-16 | 3.30e-01 | -0.1001 |
| 85315 | PAQR8 | HTA11_1391_2000001011 | Human | Colorectum | AD | 1.85e-28 | 7.07e-01 | -0.059 |
| 85315 | PAQR8 | HTA11_2992_2000001011 | Human | Colorectum | SER | 2.31e-08 | 4.85e-01 | -0.1706 |
| 85315 | PAQR8 | HTA11_5212_2000001011 | Human | Colorectum | AD | 2.59e-17 | 7.47e-01 | -0.2061 |
| 85315 | PAQR8 | HTA11_5216_2000001011 | Human | Colorectum | SER | 1.84e-10 | 6.08e-01 | -0.1462 |
| 85315 | PAQR8 | HTA11_546_2000001011 | Human | Colorectum | AD | 2.76e-07 | 2.75e-01 | -0.0842 |
| 85315 | PAQR8 | HTA11_9341_2000001011 | Human | Colorectum | SER | 5.61e-03 | 2.55e-01 | -0.00410000000000005 |
| 85315 | PAQR8 | HTA11_7862_2000001011 | Human | Colorectum | AD | 1.24e-02 | 1.98e-01 | -0.0179 |
| 85315 | PAQR8 | HTA11_866_3004761011 | Human | Colorectum | AD | 1.21e-15 | 3.76e-01 | 0.096 |
| Page: 1 2 |
| Tissue | Expression Dynamics | Abbreviation |
| Colorectum (GSE201348) | 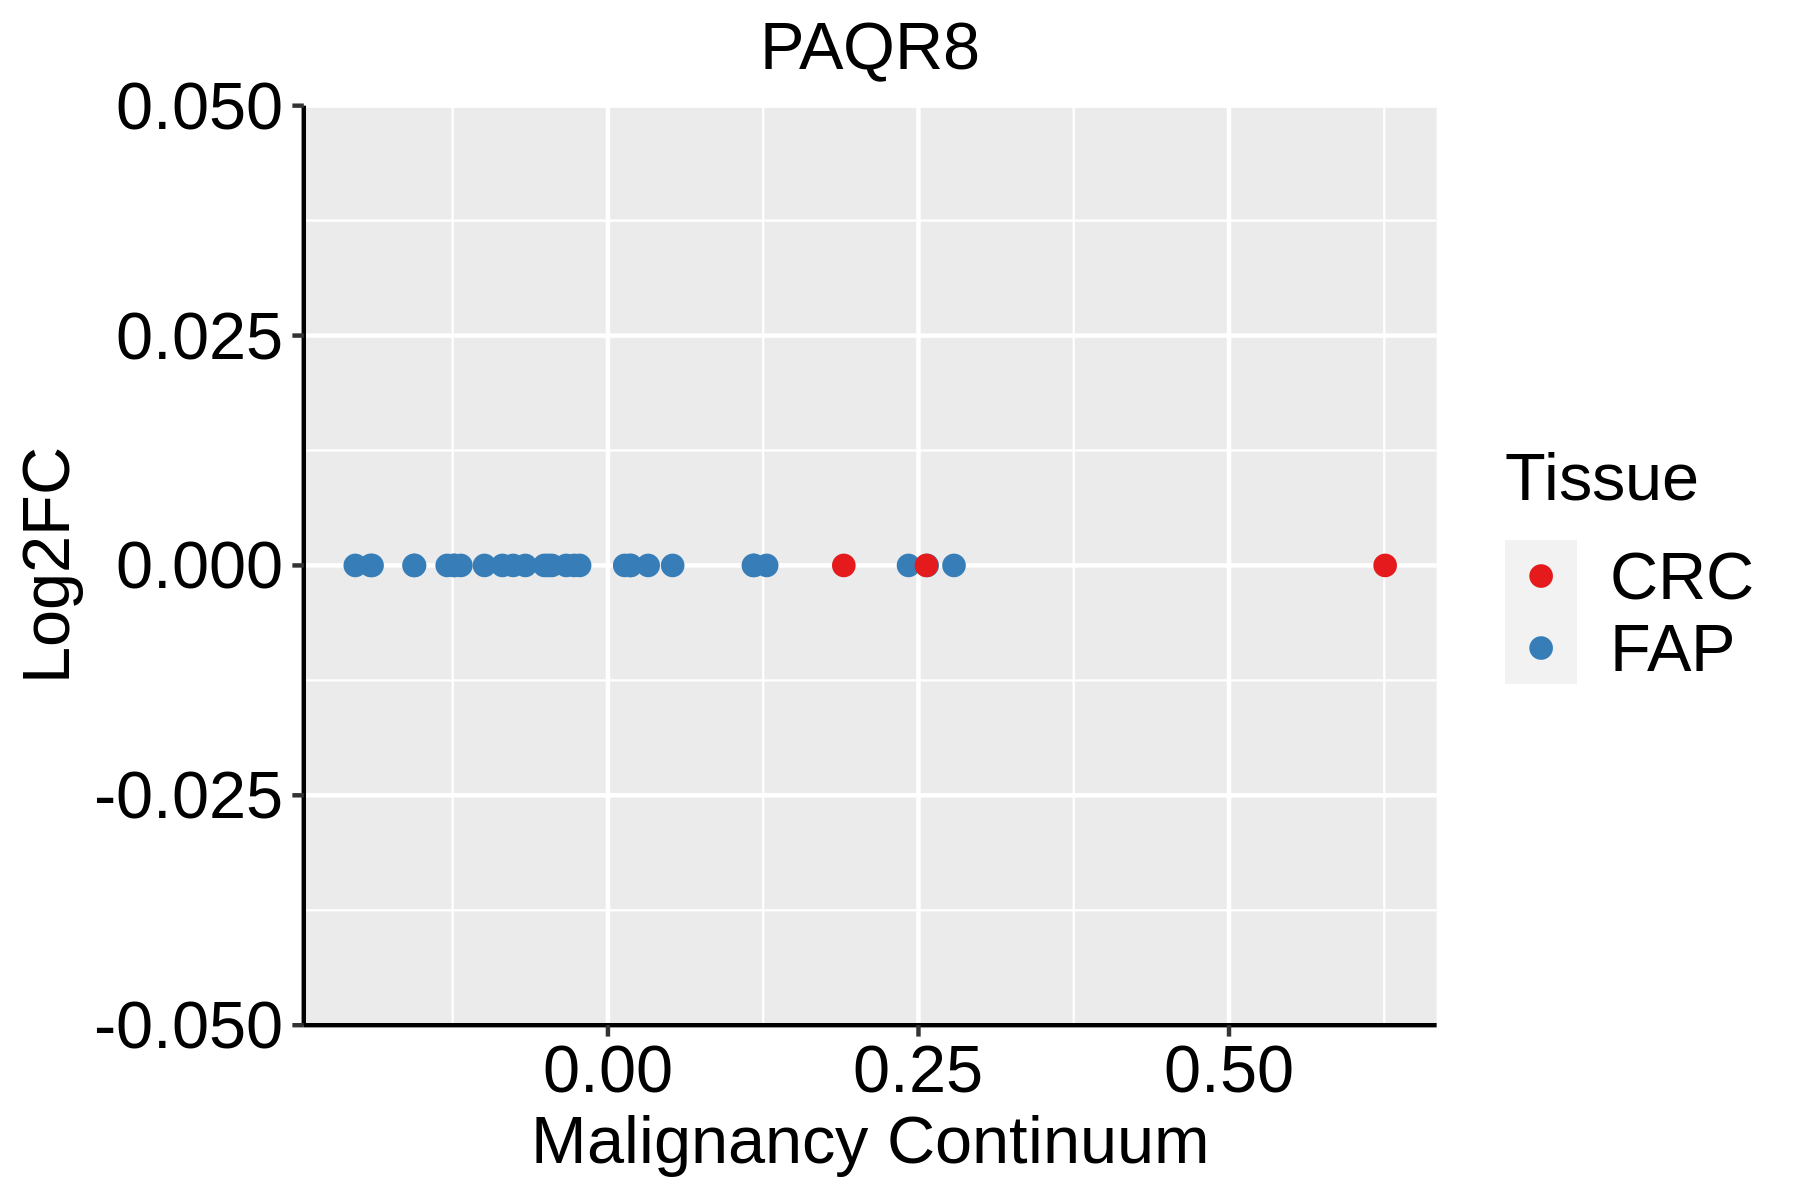 | FAP: Familial adenomatous polyposis |
| CRC: Colorectal cancer | ||
| Colorectum (HTA11) |  | AD: Adenomas |
| SER: Sessile serrated lesions | ||
| MSI-H: Microsatellite-high colorectal cancer | ||
| MSS: Microsatellite stable colorectal cancer |
| ∗log2FC in expression of this searched gene in stem-like cells from each diseased tissue sample relative to stem-like cells in normal samples in each tissue plotted against the malignancy continuum. Samples are colored based on if they are from different disease stage. |
Top |
Malignant transformation related pathway analysis |
| Find out the enriched GO biological processes and KEGG pathways involved in transition from healthy to precancer to cancer |
| Tissue | Disease Stage | Enriched GO biological Processes |
| Colorectum | AD |  |
| Colorectum | SER |  |
| Colorectum | MSS |  |
| Colorectum | MSI-H |  |
| Colorectum | FAP |  |
| ∗Top 15 enriched GO BP terms are showed in the bar plot of each disease state in each tissue. Each row represents a significant GO biological process which is colored according to the -log10(p.adjust). |
| Page: 1 2 3 4 5 6 7 8 9 |
| GO ID | Tissue | Disease Stage | Description | Gene Ratio | Bg Ratio | pvalue | p.adjust | Count |
| GO:0071383 | Colorectum | AD | cellular response to steroid hormone stimulus | 73/3918 | 204/18723 | 6.31e-07 | 2.24e-05 | 73 |
| GO:0043401 | Colorectum | AD | steroid hormone mediated signaling pathway | 51/3918 | 136/18723 | 6.52e-06 | 1.63e-04 | 51 |
| GO:0048545 | Colorectum | AD | response to steroid hormone | 104/3918 | 339/18723 | 1.33e-05 | 2.90e-04 | 104 |
| GO:0009755 | Colorectum | AD | hormone-mediated signaling pathway | 64/3918 | 190/18723 | 2.78e-05 | 5.24e-04 | 64 |
| GO:00713831 | Colorectum | SER | cellular response to steroid hormone stimulus | 55/2897 | 204/18723 | 1.66e-05 | 5.05e-04 | 55 |
| GO:00485451 | Colorectum | SER | response to steroid hormone | 80/2897 | 339/18723 | 5.15e-05 | 1.25e-03 | 80 |
| GO:00434011 | Colorectum | SER | steroid hormone mediated signaling pathway | 38/2897 | 136/18723 | 1.42e-04 | 2.82e-03 | 38 |
| GO:00097551 | Colorectum | SER | hormone-mediated signaling pathway | 49/2897 | 190/18723 | 1.54e-04 | 3.00e-03 | 49 |
| GO:00713832 | Colorectum | MSS | cellular response to steroid hormone stimulus | 72/3467 | 204/18723 | 8.87e-09 | 5.43e-07 | 72 |
| GO:00434012 | Colorectum | MSS | steroid hormone mediated signaling pathway | 51/3467 | 136/18723 | 1.43e-07 | 6.67e-06 | 51 |
| GO:00485452 | Colorectum | MSS | response to steroid hormone | 101/3467 | 339/18723 | 2.60e-07 | 1.10e-05 | 101 |
| GO:00097552 | Colorectum | MSS | hormone-mediated signaling pathway | 63/3467 | 190/18723 | 9.26e-07 | 3.23e-05 | 63 |
| GO:00485453 | Colorectum | MSI-H | response to steroid hormone | 40/1319 | 339/18723 | 9.37e-04 | 1.64e-02 | 40 |
| GO:00434013 | Colorectum | MSI-H | steroid hormone mediated signaling pathway | 19/1319 | 136/18723 | 3.19e-03 | 3.93e-02 | 19 |
| GO:00097553 | Colorectum | MSI-H | hormone-mediated signaling pathway | 24/1319 | 190/18723 | 3.88e-03 | 4.51e-02 | 24 |
| Page: 1 |
| Pathway ID | Tissue | Disease Stage | Description | Gene Ratio | Bg Ratio | pvalue | p.adjust | qvalue | Count |
| Page: 1 |
Top |
Cell-cell communication analysis |
| Identification of potential cell-cell interactions between two cell types and their ligand-receptor pairs for different disease states |
| Ligand | Receptor | LRpair | Pathway | Tissue | Disease Stage |
| Page: 1 |
Top |
Single-cell gene regulatory network inference analysis |
| Find out the significant the regulons (TFs) and the target genes of each regulon across cell types for different disease states |
| TF | Cell Type | Tissue | Disease Stage | Target Gene | RSS | Regulon Activity |
| ∗The dot plots of a searched regulon are shown for all cell subpopulations in each disease state of each tissue based on the regulon specific score inferred using pySCENIC and by calculating the average expression. |
| Page: 1 |
Top |
Somatic mutation of malignant transformation related genes |
| Annotation of somatic variants for genes involved in malignant transformation |
| Hugo Symbol | Variant Class | Variant Classification | dbSNP RS | HGVSc | HGVSp | HGVSp Short | SWISSPROT | BIOTYPE | SIFT | PolyPhen | Tumor Sample Barcode | Tissue | Histology | Sex | Age | Stage | Therapy Types | Drugs | Outcome |
| PAQR8 | insertion | In_Frame_Ins | novel | c.974_975insAGAATATTGGGA | p.Leu325_Ser326insGluTyrTrpAsp | p.L325_S326insEYWD | Q8TEZ7 | protein_coding | TCGA-A8-A06X-01 | Breast | breast invasive carcinoma | Female | >=65 | I/II | Unknown | Unknown | SD | ||
| PAQR8 | insertion | Nonsense_Mutation | novel | c.975_976insAGGCCAGGCATGGTGGCTTAACGCCTGTAAT | p.Ser326ArgfsTer7 | p.S326Rfs*7 | Q8TEZ7 | protein_coding | TCGA-A8-A06X-01 | Breast | breast invasive carcinoma | Female | >=65 | I/II | Unknown | Unknown | SD | ||
| PAQR8 | insertion | Frame_Shift_Ins | novel | c.735_736insACTGCATCCCAGCTGGGCGACAGAGCAAGACCCTGTT | p.Trp246ThrfsTer25 | p.W246Tfs*25 | Q8TEZ7 | protein_coding | TCGA-A8-A09D-01 | Breast | breast invasive carcinoma | Female | <65 | I/II | Chemotherapy | doxorubicin | CR | ||
| PAQR8 | SNV | Missense_Mutation | c.413N>C | p.Leu138Pro | p.L138P | Q8TEZ7 | protein_coding | deleterious(0.01) | possibly_damaging(0.519) | TCGA-A6-5661-01 | Colorectum | colon adenocarcinoma | Female | >=65 | I/II | Unknown | Unknown | SD | |
| PAQR8 | SNV | Missense_Mutation | c.994N>A | p.Ala332Thr | p.A332T | Q8TEZ7 | protein_coding | tolerated(0.52) | benign(0.001) | TCGA-AD-6889-01 | Colorectum | colon adenocarcinoma | Male | >=65 | I/II | Chemotherapy | xeloda | PD | |
| PAQR8 | insertion | In_Frame_Ins | novel | c.667_668insGTG | p.Leu223delinsArgVal | p.L223delinsRV | Q8TEZ7 | protein_coding | TCGA-A6-2672-01 | Colorectum | colon adenocarcinoma | Female | >=65 | III/IV | Unknown | Unknown | SD | ||
| PAQR8 | SNV | Missense_Mutation | rs769096577 | c.1012N>A | p.Ala338Thr | p.A338T | Q8TEZ7 | protein_coding | deleterious(0) | probably_damaging(0.996) | TCGA-A5-A0G2-01 | Endometrium | uterine corpus endometrioid carcinoma | Female | <65 | III/IV | Unknown | Unknown | SD |
| PAQR8 | SNV | Missense_Mutation | novel | c.1053N>T | p.Lys351Asn | p.K351N | Q8TEZ7 | protein_coding | tolerated(0.41) | benign(0.069) | TCGA-A5-A2K5-01 | Endometrium | uterine corpus endometrioid carcinoma | Female | >=65 | I/II | Unknown | Unknown | SD |
| PAQR8 | SNV | Missense_Mutation | novel | c.649G>T | p.Ala217Ser | p.A217S | Q8TEZ7 | protein_coding | tolerated(1) | benign(0.001) | TCGA-AJ-A3EK-01 | Endometrium | uterine corpus endometrioid carcinoma | Female | <65 | I/II | Chemotherapy | carboplatin | CR |
| PAQR8 | SNV | Missense_Mutation | c.235N>A | p.Val79Ile | p.V79I | Q8TEZ7 | protein_coding | tolerated(0.15) | probably_damaging(0.927) | TCGA-AJ-A8CW-01 | Endometrium | uterine corpus endometrioid carcinoma | Female | <65 | I/II | Unknown | Unknown | SD |
| Page: 1 2 3 4 5 |
Top |
Related drugs of malignant transformation related genes |
| Identification of chemicals and drugs interact with genes involved in malignant transfromation |
| (DGIdb 4.0) |
| Entrez ID | Symbol | Category | Interaction Types | Drug Claim Name | Drug Name | PMIDs |
| Page: 1 |

Copyright 2023-Present -The University of Texas Health Science Center at Houston |