
|
|||||
|
 | |
| |
| |
| |
| |
| |
|
Gene: PAPSS1 |
Gene summary for PAPSS1 |
| Gene information | Species | Human | Gene symbol | PAPSS1 | Gene ID | 9061 |
| Gene name | 3'-phosphoadenosine 5'-phosphosulfate synthase 1 | |
| Gene Alias | ATPSK1 | |
| Cytomap | 4q25 | |
| Gene Type | protein-coding | GO ID | GO:0000103 | UniProtAcc | O43252 |
Top |
Malignant transformation analysis |
| Identification of the aberrant gene expression in precancerous and cancerous lesions by comparing the gene expression of stem-like cells in diseased tissues with normal stem cells |
| Entrez ID | Symbol | Replicates | Species | Organ | Tissue | Adj P-value | Log2FC | Malignancy |
| 9061 | PAPSS1 | EEC-subject3 | Human | Endometrium | EEC | 2.93e-27 | -5.14e-01 | -0.2525 |
| 9061 | PAPSS1 | EEC-subject4 | Human | Endometrium | EEC | 6.90e-05 | 2.80e-01 | -0.2571 |
| 9061 | PAPSS1 | GSM5276934 | Human | Endometrium | EEC | 5.39e-38 | -6.90e-01 | -0.0913 |
| 9061 | PAPSS1 | GSM5276935 | Human | Endometrium | EEC | 1.03e-02 | -2.64e-01 | -0.123 |
| 9061 | PAPSS1 | GSM5276937 | Human | Endometrium | EEC | 1.82e-20 | -5.94e-01 | -0.0897 |
| 9061 | PAPSS1 | GSM6177620_NYU_UCEC1_lib1_lib1 | Human | Endometrium | EEC | 5.23e-17 | -3.96e-01 | -0.1869 |
| 9061 | PAPSS1 | GSM6177620_NYU_UCEC1_lib2_lib2 | Human | Endometrium | EEC | 2.68e-20 | -3.82e-01 | -0.1875 |
| 9061 | PAPSS1 | GSM6177620_NYU_UCEC1_lib3_lib3 | Human | Endometrium | EEC | 1.15e-19 | -4.59e-01 | -0.1883 |
| 9061 | PAPSS1 | GSM6177621_NYU_UCEC2_lib1_lib1 | Human | Endometrium | EEC | 8.22e-11 | 2.41e-03 | -0.1934 |
| 9061 | PAPSS1 | GSM6177622_NYU_UCEC3_lib1_lib1 | Human | Endometrium | EEC | 7.74e-29 | -4.61e-01 | -0.1917 |
| 9061 | PAPSS1 | GSM6177622_NYU_UCEC3_lib2_lib2 | Human | Endometrium | EEC | 8.87e-30 | -3.52e-01 | -0.1916 |
| 9061 | PAPSS1 | GSM6177623_NYU_UCEC3_Vis | Human | Endometrium | EEC | 4.19e-07 | -2.87e-01 | -0.1269 |
| 9061 | PAPSS1 | LZE2D | Human | Esophagus | HGIN | 3.76e-02 | 2.48e-01 | 0.0642 |
| 9061 | PAPSS1 | LZE2T | Human | Esophagus | ESCC | 4.23e-02 | 2.30e-01 | 0.082 |
| 9061 | PAPSS1 | LZE4T | Human | Esophagus | ESCC | 9.21e-21 | 4.96e-01 | 0.0811 |
| 9061 | PAPSS1 | LZE5T | Human | Esophagus | ESCC | 9.48e-04 | 5.31e-01 | 0.0514 |
| 9061 | PAPSS1 | LZE7T | Human | Esophagus | ESCC | 4.81e-09 | 3.06e-01 | 0.0667 |
| 9061 | PAPSS1 | LZE8T | Human | Esophagus | ESCC | 8.44e-10 | 2.30e-01 | 0.067 |
| 9061 | PAPSS1 | LZE20T | Human | Esophagus | ESCC | 2.62e-05 | 2.51e-01 | 0.0662 |
| 9061 | PAPSS1 | LZE22T | Human | Esophagus | ESCC | 2.13e-03 | 4.23e-01 | 0.068 |
| Page: 1 2 3 4 5 6 7 |
| Tissue | Expression Dynamics | Abbreviation |
| Endometrium | 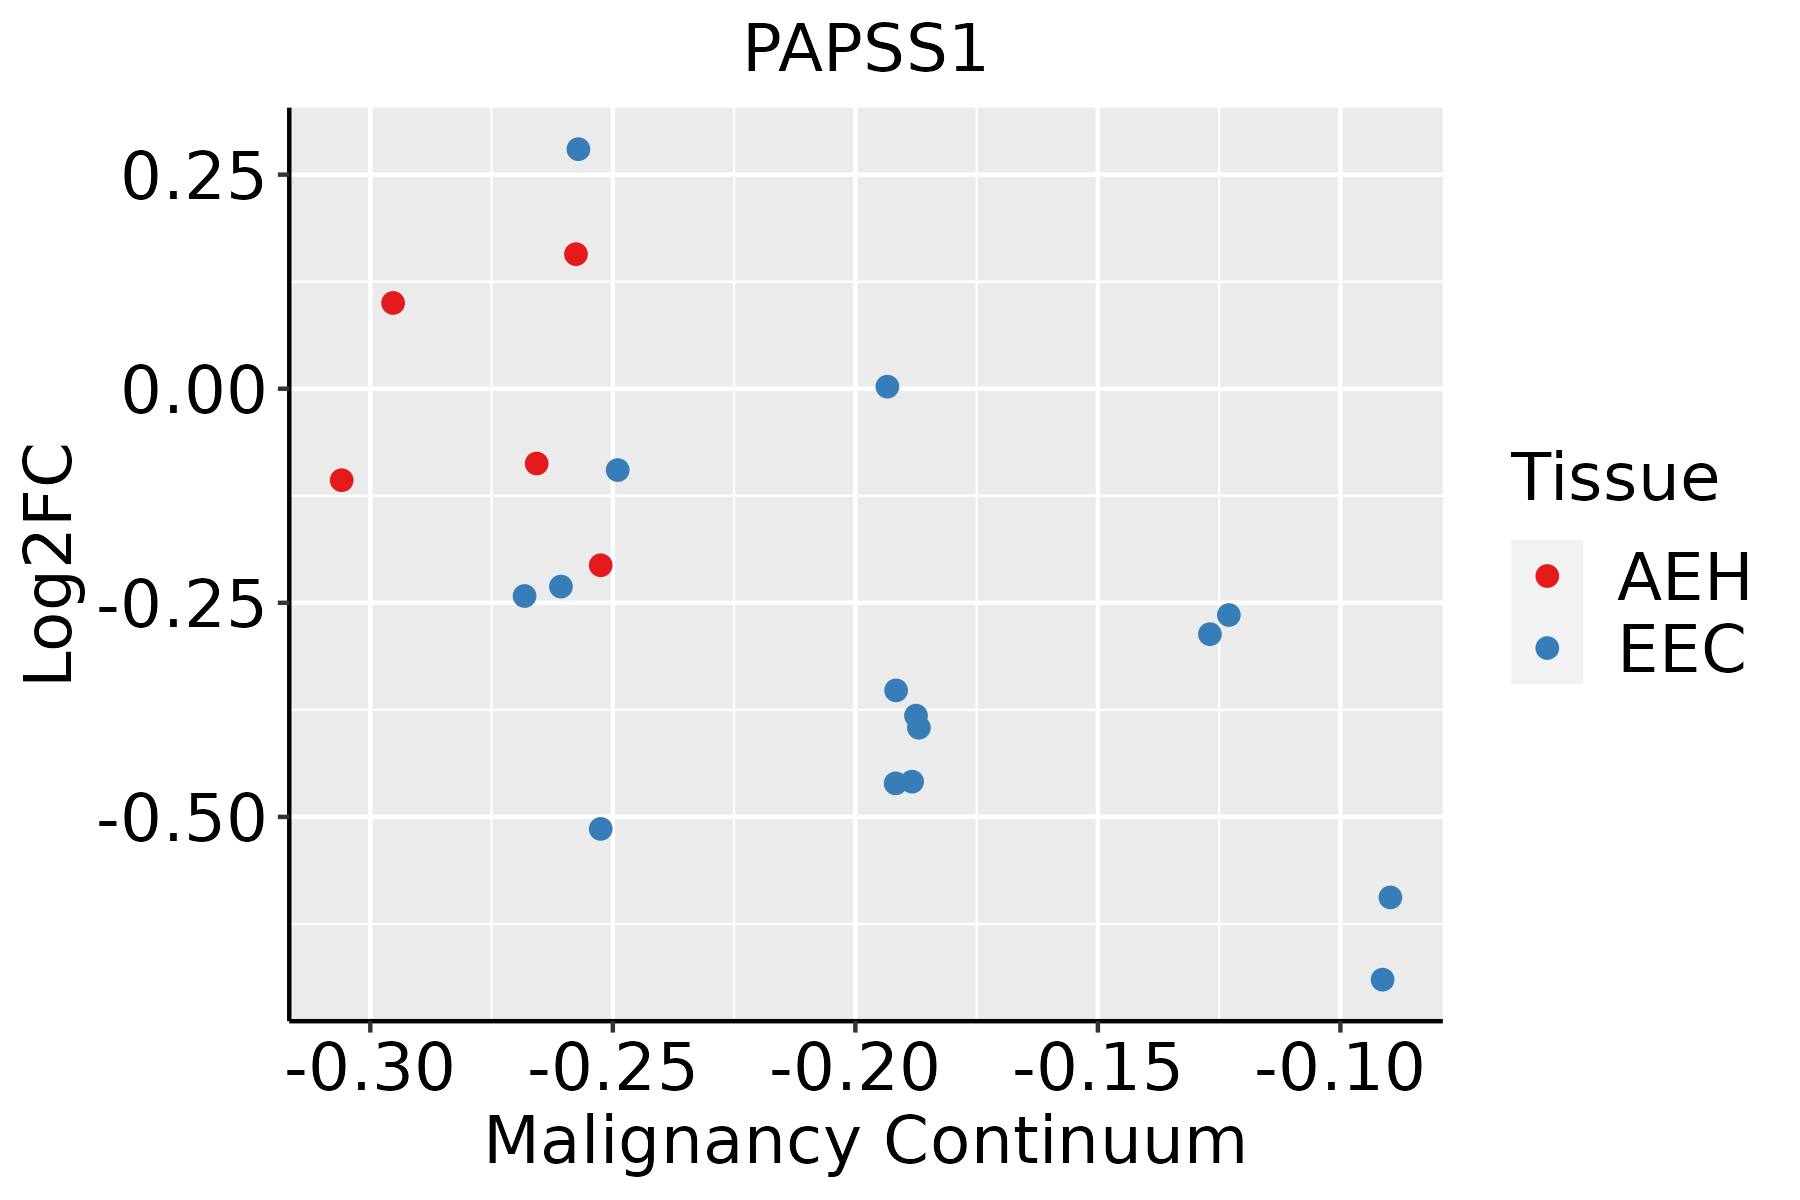 | AEH: Atypical endometrial hyperplasia |
| EEC: Endometrioid Cancer | ||
| Esophagus | 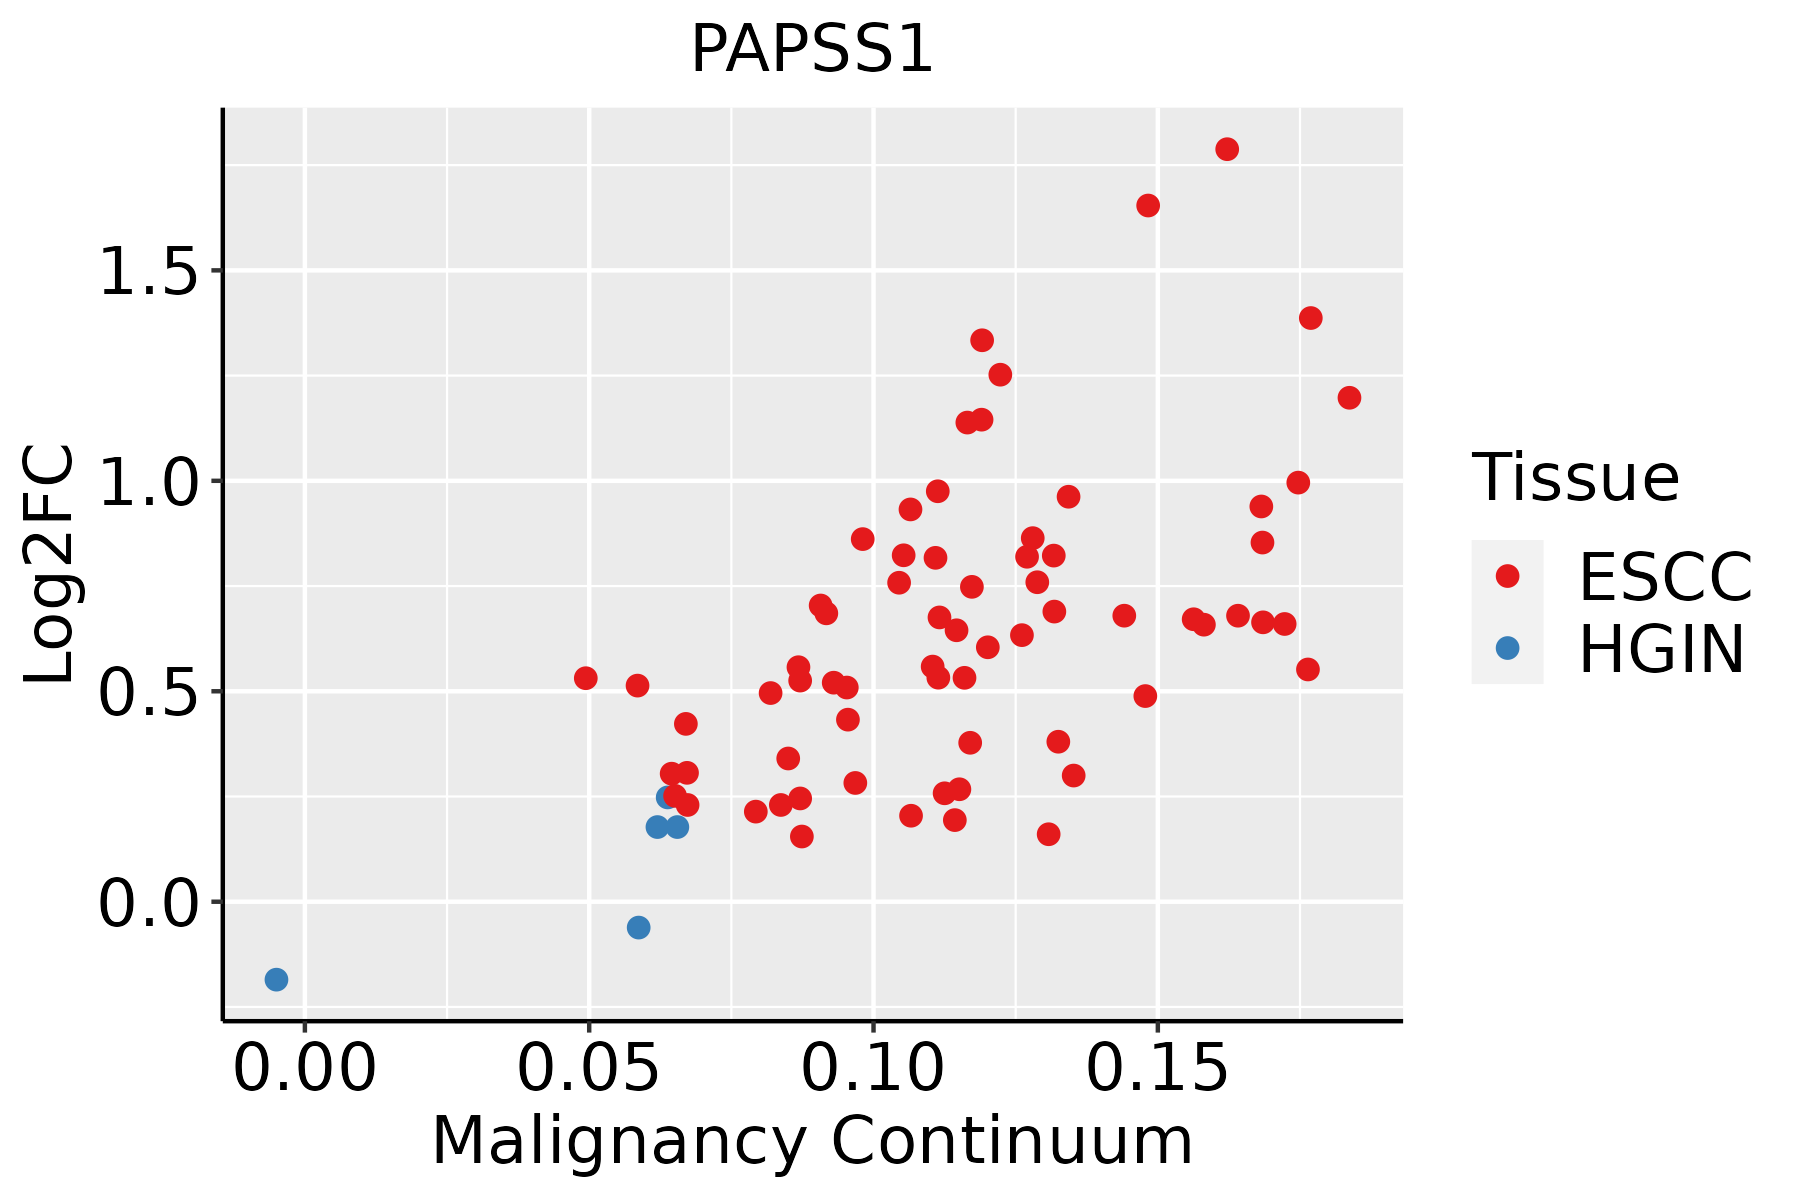 | ESCC: Esophageal squamous cell carcinoma |
| HGIN: High-grade intraepithelial neoplasias | ||
| LGIN: Low-grade intraepithelial neoplasias | ||
| Liver |  | HCC: Hepatocellular carcinoma |
| NAFLD: Non-alcoholic fatty liver disease | ||
| Oral Cavity |  | EOLP: Erosive Oral lichen planus |
| LP: leukoplakia | ||
| NEOLP: Non-erosive oral lichen planus | ||
| OSCC: Oral squamous cell carcinoma | ||
| Prostate |  | BPH: Benign Prostatic Hyperplasia |
| Skin |  | AK: Actinic keratosis |
| cSCC: Cutaneous squamous cell carcinoma | ||
| SCCIS:squamous cell carcinoma in situ | ||
| Thyroid | 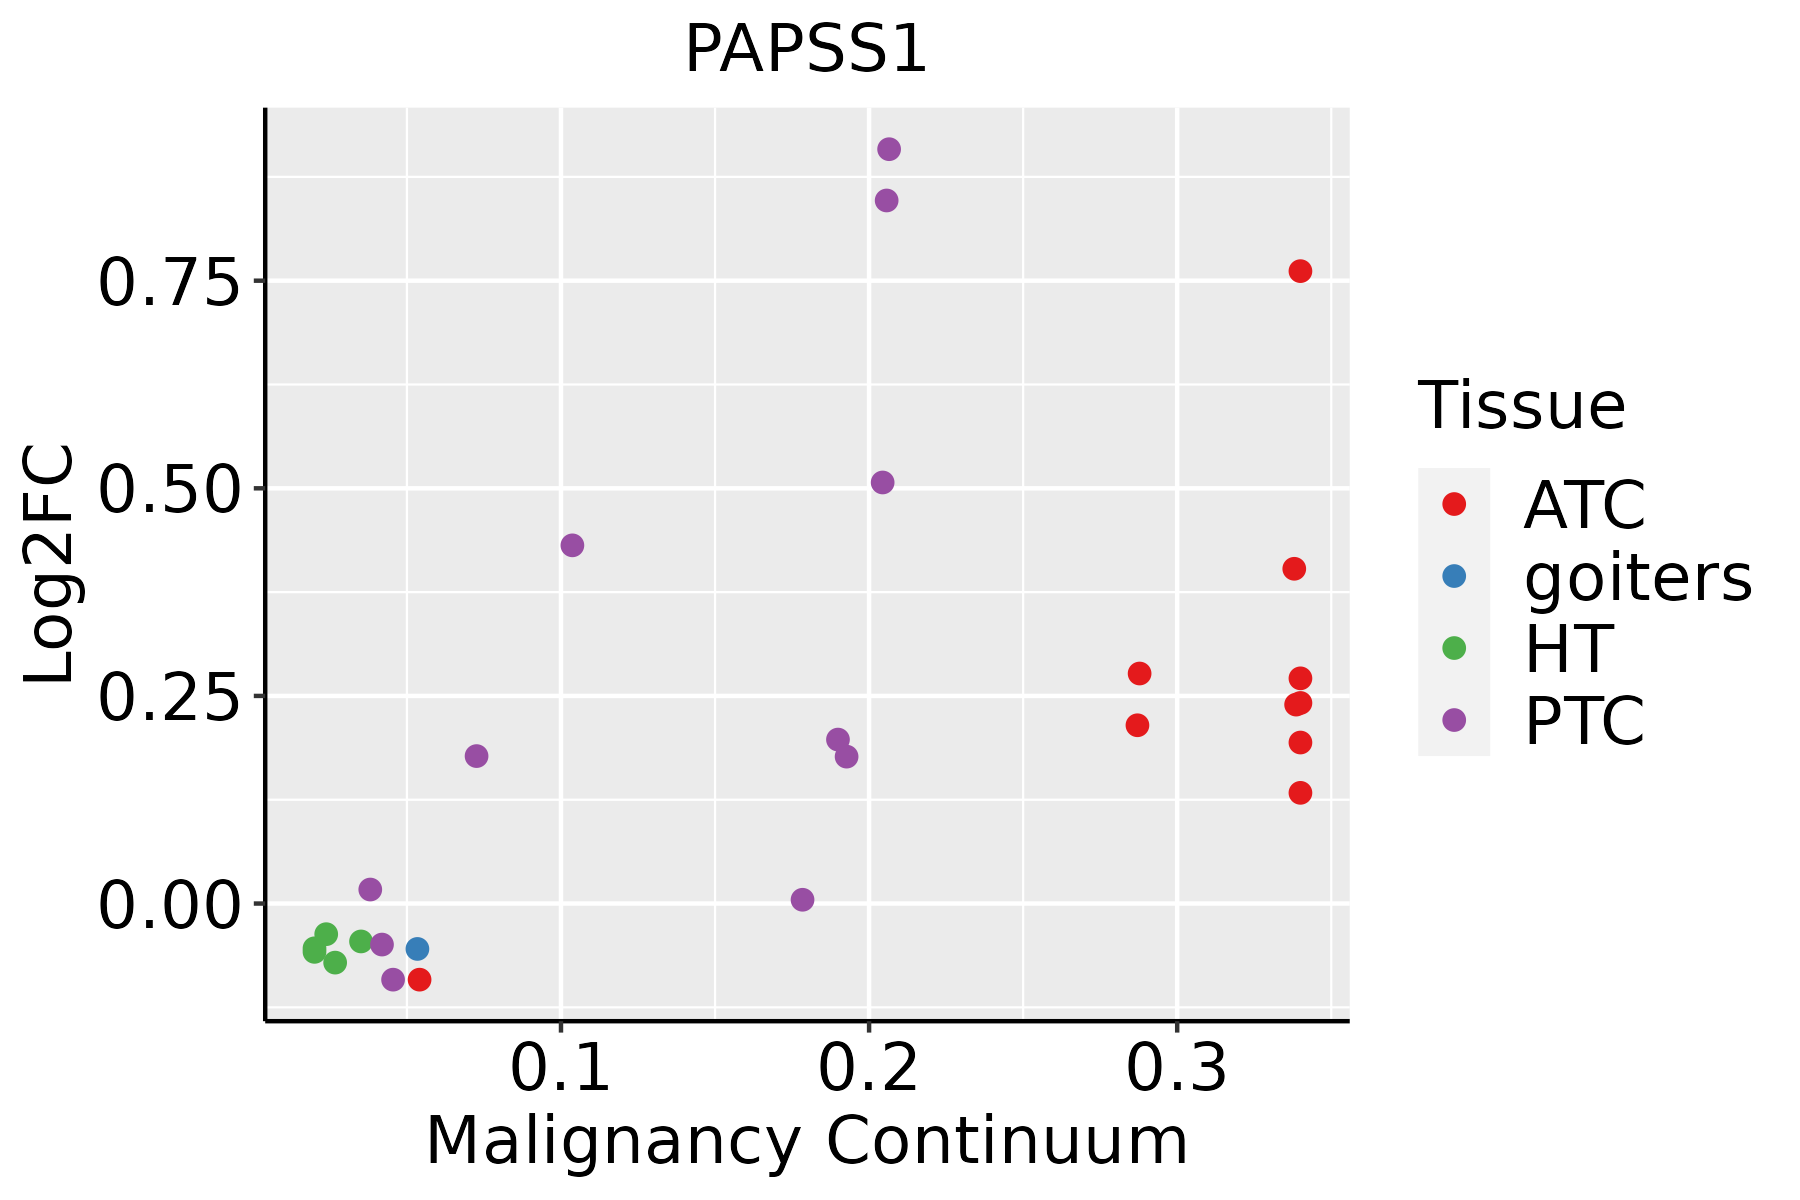 | ATC: Anaplastic thyroid cancer |
| HT: Hashimoto's thyroiditis | ||
| PTC: Papillary thyroid cancer |
| ∗log2FC in expression of this searched gene in stem-like cells from each diseased tissue sample relative to stem-like cells in normal samples in each tissue plotted against the malignancy continuum. Samples are colored based on if they are from different disease stage. |
Top |
Malignant transformation related pathway analysis |
| Find out the enriched GO biological processes and KEGG pathways involved in transition from healthy to precancer to cancer |
| Tissue | Disease Stage | Enriched GO biological Processes |
| Colorectum | AD |  |
| Colorectum | SER |  |
| Colorectum | MSS |  |
| Colorectum | MSI-H |  |
| Colorectum | FAP |  |
| ∗Top 15 enriched GO BP terms are showed in the bar plot of each disease state in each tissue. Each row represents a significant GO biological process which is colored according to the -log10(p.adjust). |
| Page: 1 2 3 4 5 6 7 8 9 |
| GO ID | Tissue | Disease Stage | Description | Gene Ratio | Bg Ratio | pvalue | p.adjust | Count |
| GO:000915017 | Endometrium | EEC | purine ribonucleotide metabolic process | 69/2168 | 368/18723 | 3.38e-05 | 5.77e-04 | 69 |
| GO:000616317 | Endometrium | EEC | purine nucleotide metabolic process | 71/2168 | 396/18723 | 1.14e-04 | 1.54e-03 | 71 |
| GO:000925916 | Endometrium | EEC | ribonucleotide metabolic process | 69/2168 | 385/18723 | 1.43e-04 | 1.84e-03 | 69 |
| GO:007252117 | Endometrium | EEC | purine-containing compound metabolic process | 73/2168 | 416/18723 | 1.82e-04 | 2.24e-03 | 73 |
| GO:001969316 | Endometrium | EEC | ribose phosphate metabolic process | 70/2168 | 396/18723 | 1.96e-04 | 2.38e-03 | 70 |
| GO:000915216 | Endometrium | EEC | purine ribonucleotide biosynthetic process | 36/2168 | 169/18723 | 2.03e-04 | 2.45e-03 | 36 |
| GO:000911716 | Endometrium | EEC | nucleotide metabolic process | 80/2168 | 489/18723 | 8.65e-04 | 7.95e-03 | 80 |
| GO:000926015 | Endometrium | EEC | ribonucleotide biosynthetic process | 36/2168 | 182/18723 | 8.83e-04 | 8.03e-03 | 36 |
| GO:004639015 | Endometrium | EEC | ribose phosphate biosynthetic process | 37/2168 | 190/18723 | 1.02e-03 | 8.98e-03 | 37 |
| GO:000675315 | Endometrium | EEC | nucleoside phosphate metabolic process | 80/2168 | 497/18723 | 1.39e-03 | 1.14e-02 | 80 |
| GO:000616414 | Endometrium | EEC | purine nucleotide biosynthetic process | 36/2168 | 191/18723 | 2.14e-03 | 1.61e-02 | 36 |
| GO:007252214 | Endometrium | EEC | purine-containing compound biosynthetic process | 37/2168 | 200/18723 | 2.62e-03 | 1.90e-02 | 37 |
| GO:00091656 | Endometrium | EEC | nucleotide biosynthetic process | 43/2168 | 254/18723 | 6.79e-03 | 3.95e-02 | 43 |
| GO:19012936 | Endometrium | EEC | nucleoside phosphate biosynthetic process | 43/2168 | 256/18723 | 7.79e-03 | 4.34e-02 | 43 |
| GO:000915219 | Esophagus | HGIN | purine ribonucleotide biosynthetic process | 43/2587 | 169/18723 | 3.94e-05 | 9.74e-04 | 43 |
| GO:004639019 | Esophagus | HGIN | ribose phosphate biosynthetic process | 46/2587 | 190/18723 | 8.06e-05 | 1.79e-03 | 46 |
| GO:007252216 | Esophagus | HGIN | purine-containing compound biosynthetic process | 47/2587 | 200/18723 | 1.46e-04 | 2.91e-03 | 47 |
| GO:000616416 | Esophagus | HGIN | purine nucleotide biosynthetic process | 45/2587 | 191/18723 | 1.87e-04 | 3.52e-03 | 45 |
| GO:000926019 | Esophagus | HGIN | ribonucleotide biosynthetic process | 43/2587 | 182/18723 | 2.41e-04 | 4.33e-03 | 43 |
| GO:000911720 | Esophagus | HGIN | nucleotide metabolic process | 92/2587 | 489/18723 | 1.11e-03 | 1.36e-02 | 92 |
| Page: 1 2 3 4 5 6 7 8 9 10 11 |
| Pathway ID | Tissue | Disease Stage | Description | Gene Ratio | Bg Ratio | pvalue | p.adjust | qvalue | Count |
| Page: 1 |
Top |
Cell-cell communication analysis |
| Identification of potential cell-cell interactions between two cell types and their ligand-receptor pairs for different disease states |
| Ligand | Receptor | LRpair | Pathway | Tissue | Disease Stage |
| Page: 1 |
Top |
Single-cell gene regulatory network inference analysis |
| Find out the significant the regulons (TFs) and the target genes of each regulon across cell types for different disease states |
| TF | Cell Type | Tissue | Disease Stage | Target Gene | RSS | Regulon Activity |
| ∗The dot plots of a searched regulon are shown for all cell subpopulations in each disease state of each tissue based on the regulon specific score inferred using pySCENIC and by calculating the average expression. |
| Page: 1 |
Top |
Somatic mutation of malignant transformation related genes |
| Annotation of somatic variants for genes involved in malignant transformation |
| Hugo Symbol | Variant Class | Variant Classification | dbSNP RS | HGVSc | HGVSp | HGVSp Short | SWISSPROT | BIOTYPE | SIFT | PolyPhen | Tumor Sample Barcode | Tissue | Histology | Sex | Age | Stage | Therapy Types | Drugs | Outcome |
| PAPSS1 | SNV | Missense_Mutation | rs374190069 | c.1774N>T | p.Arg592Cys | p.R592C | O43252 | protein_coding | deleterious(0) | probably_damaging(0.995) | TCGA-A8-A099-01 | Breast | breast invasive carcinoma | Female | >=65 | III/IV | Hormone Therapy | exemestane | SD |
| PAPSS1 | SNV | Missense_Mutation | c.818G>A | p.Gly273Asp | p.G273D | O43252 | protein_coding | deleterious(0) | probably_damaging(1) | TCGA-BH-A18U-01 | Breast | breast invasive carcinoma | Female | >=65 | III/IV | Unknown | Unknown | SD | |
| PAPSS1 | SNV | Missense_Mutation | novel | c.1525N>C | p.Ala509Pro | p.A509P | O43252 | protein_coding | deleterious(0) | benign(0.364) | TCGA-E2-A1LA-01 | Breast | breast invasive carcinoma | Female | <65 | I/II | Hormone Therapy | arimidex | SD |
| PAPSS1 | SNV | Missense_Mutation | c.291N>C | p.Lys97Asn | p.K97N | O43252 | protein_coding | deleterious(0.01) | probably_damaging(0.985) | TCGA-FU-A3HZ-01 | Cervix | cervical & endocervical cancer | Female | <65 | I/II | Chemotherapy | cisplatin | CR | |
| PAPSS1 | SNV | Missense_Mutation | novel | c.1079G>A | p.Cys360Tyr | p.C360Y | O43252 | protein_coding | tolerated(0.34) | probably_damaging(0.997) | TCGA-HG-A2PA-01 | Cervix | cervical & endocervical cancer | Female | <65 | I/II | Unspecific | Taxol | PD |
| PAPSS1 | SNV | Missense_Mutation | novel | c.274C>T | p.Arg92Cys | p.R92C | O43252 | protein_coding | deleterious(0) | probably_damaging(0.996) | TCGA-UC-A7PI-01 | Cervix | cervical & endocervical cancer | Female | <65 | I/II | Unknown | Unknown | PD |
| PAPSS1 | SNV | Missense_Mutation | novel | c.1102N>G | p.Met368Val | p.M368V | O43252 | protein_coding | tolerated(0.12) | possibly_damaging(0.561) | TCGA-VS-A9UH-01 | Cervix | cervical & endocervical cancer | Female | <65 | I/II | Chemotherapy | cisplatin | CR |
| PAPSS1 | SNV | Missense_Mutation | novel | c.1660A>G | p.Thr554Ala | p.T554A | O43252 | protein_coding | tolerated(0.19) | benign(0) | TCGA-A6-5664-01 | Colorectum | colon adenocarcinoma | Male | >=65 | III/IV | Chemotherapy | fluorouracil | SD |
| PAPSS1 | SNV | Missense_Mutation | rs763373160 | c.275G>A | p.Arg92His | p.R92H | O43252 | protein_coding | deleterious(0.01) | probably_damaging(0.99) | TCGA-AA-3510-01 | Colorectum | colon adenocarcinoma | Male | >=65 | I/II | Unknown | Unknown | SD |
| PAPSS1 | SNV | Missense_Mutation | c.1157N>A | p.Arg386Gln | p.R386Q | O43252 | protein_coding | deleterious(0.02) | benign(0.071) | TCGA-AA-3984-01 | Colorectum | colon adenocarcinoma | Female | <65 | I/II | Unknown | Unknown | SD |
| Page: 1 2 3 4 5 6 7 |
Top |
Related drugs of malignant transformation related genes |
| Identification of chemicals and drugs interact with genes involved in malignant transfromation |
| (DGIdb 4.0) |
| Entrez ID | Symbol | Category | Interaction Types | Drug Claim Name | Drug Name | PMIDs |
| Page: 1 |

Copyright 2023-Present -The University of Texas Health Science Center at Houston |