| Tissue | Expression Dynamics | Abbreviation |
| Colorectum (GSE201348) |  | FAP: Familial adenomatous polyposis |
| CRC: Colorectal cancer |
| Colorectum (HTA11) |  | AD: Adenomas |
| SER: Sessile serrated lesions |
| MSI-H: Microsatellite-high colorectal cancer |
| MSS: Microsatellite stable colorectal cancer |
| Endometrium | 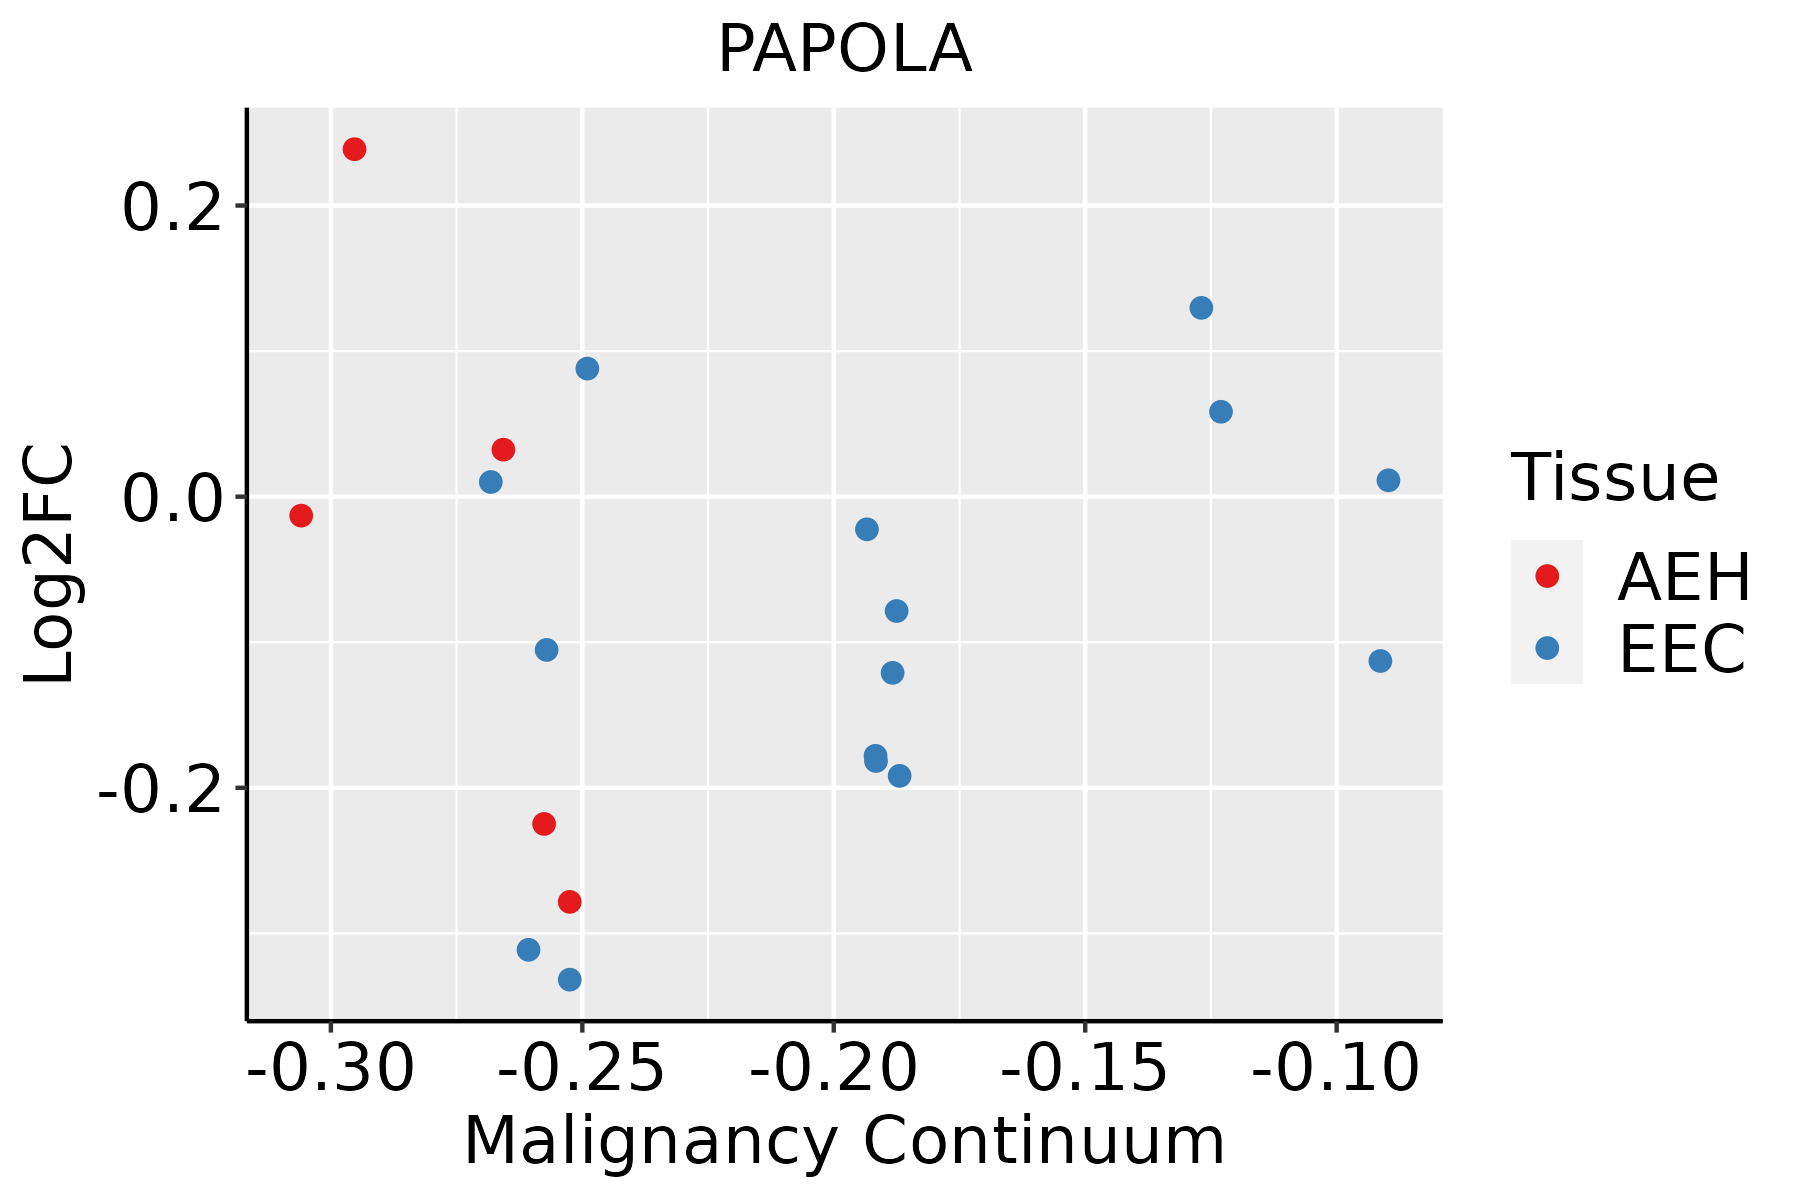 | AEH: Atypical endometrial hyperplasia |
| EEC: Endometrioid Cancer |
| Esophagus |  | ESCC: Esophageal squamous cell carcinoma |
| HGIN: High-grade intraepithelial neoplasias |
| LGIN: Low-grade intraepithelial neoplasias |
| Liver | 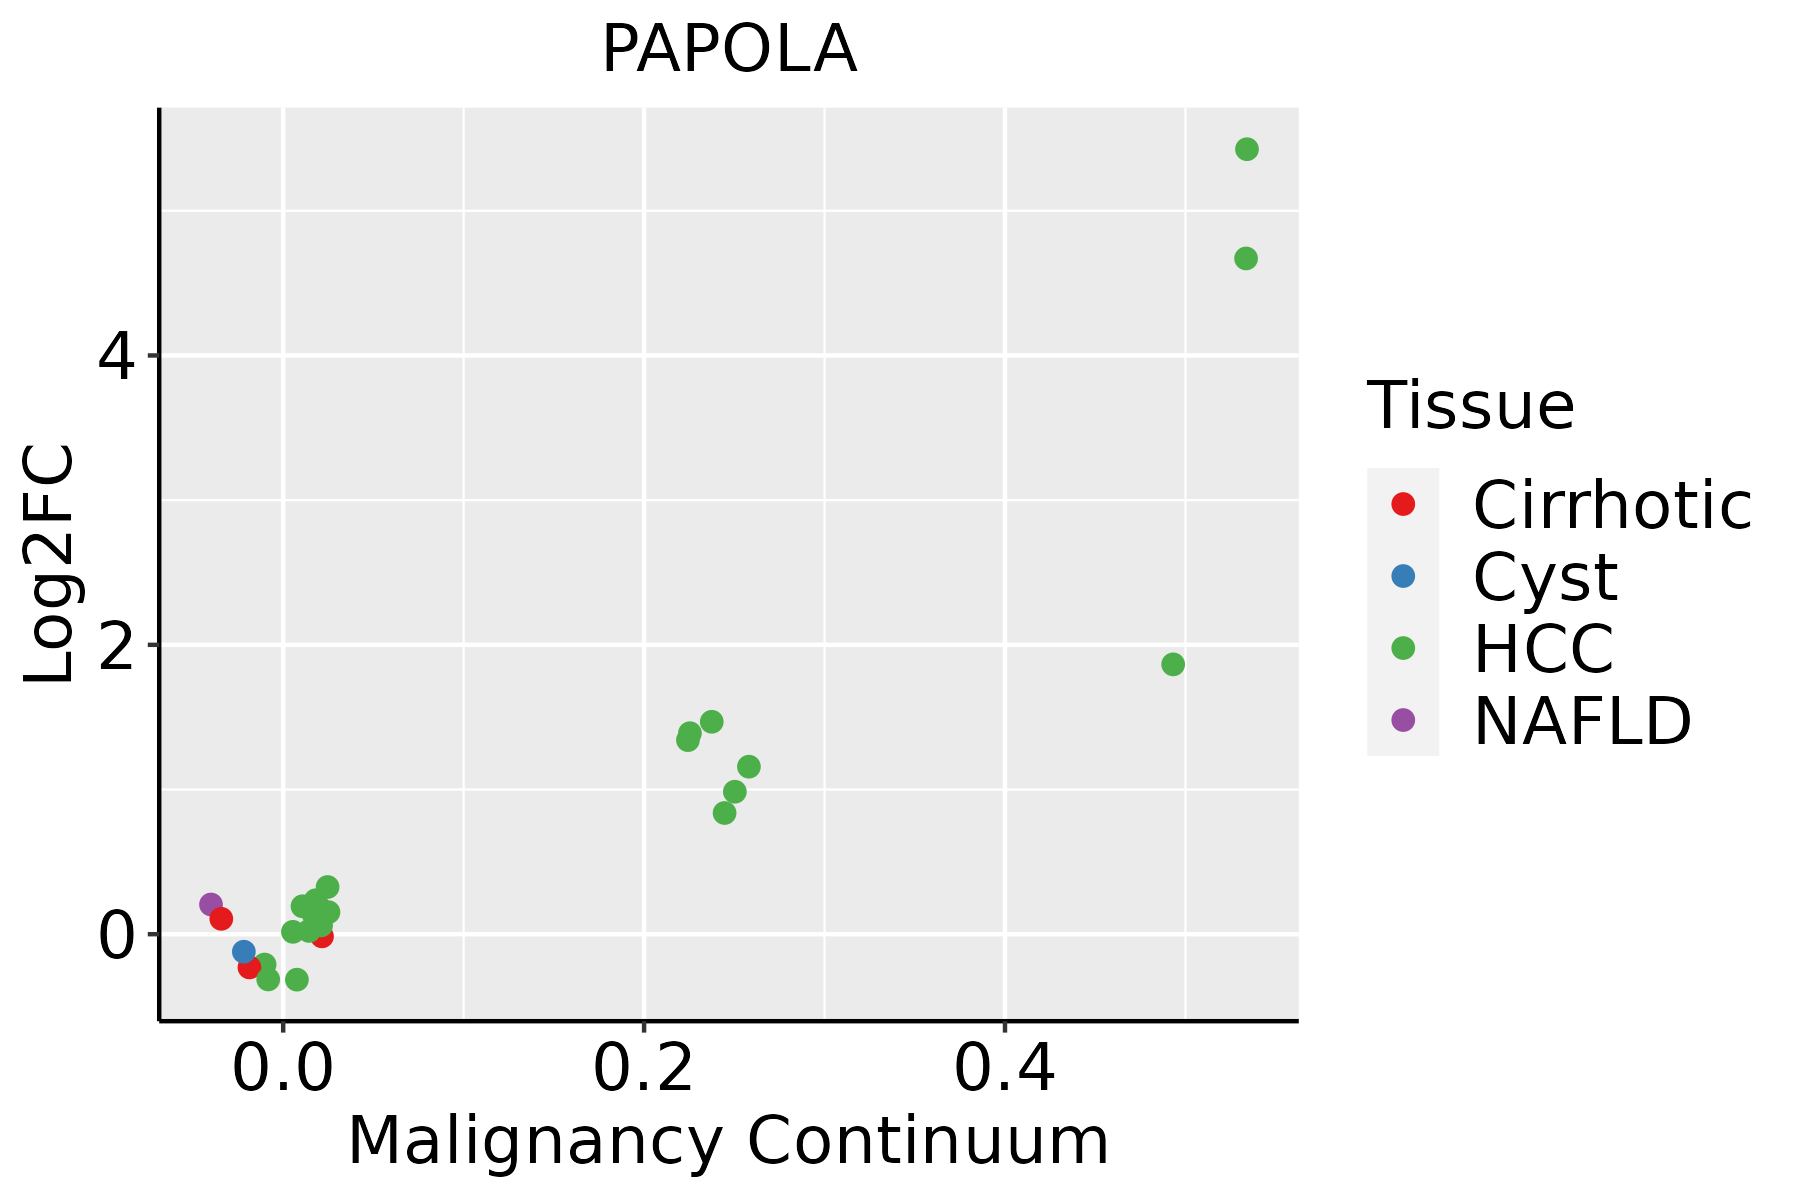 | HCC: Hepatocellular carcinoma |
| NAFLD: Non-alcoholic fatty liver disease |
| Oral Cavity | 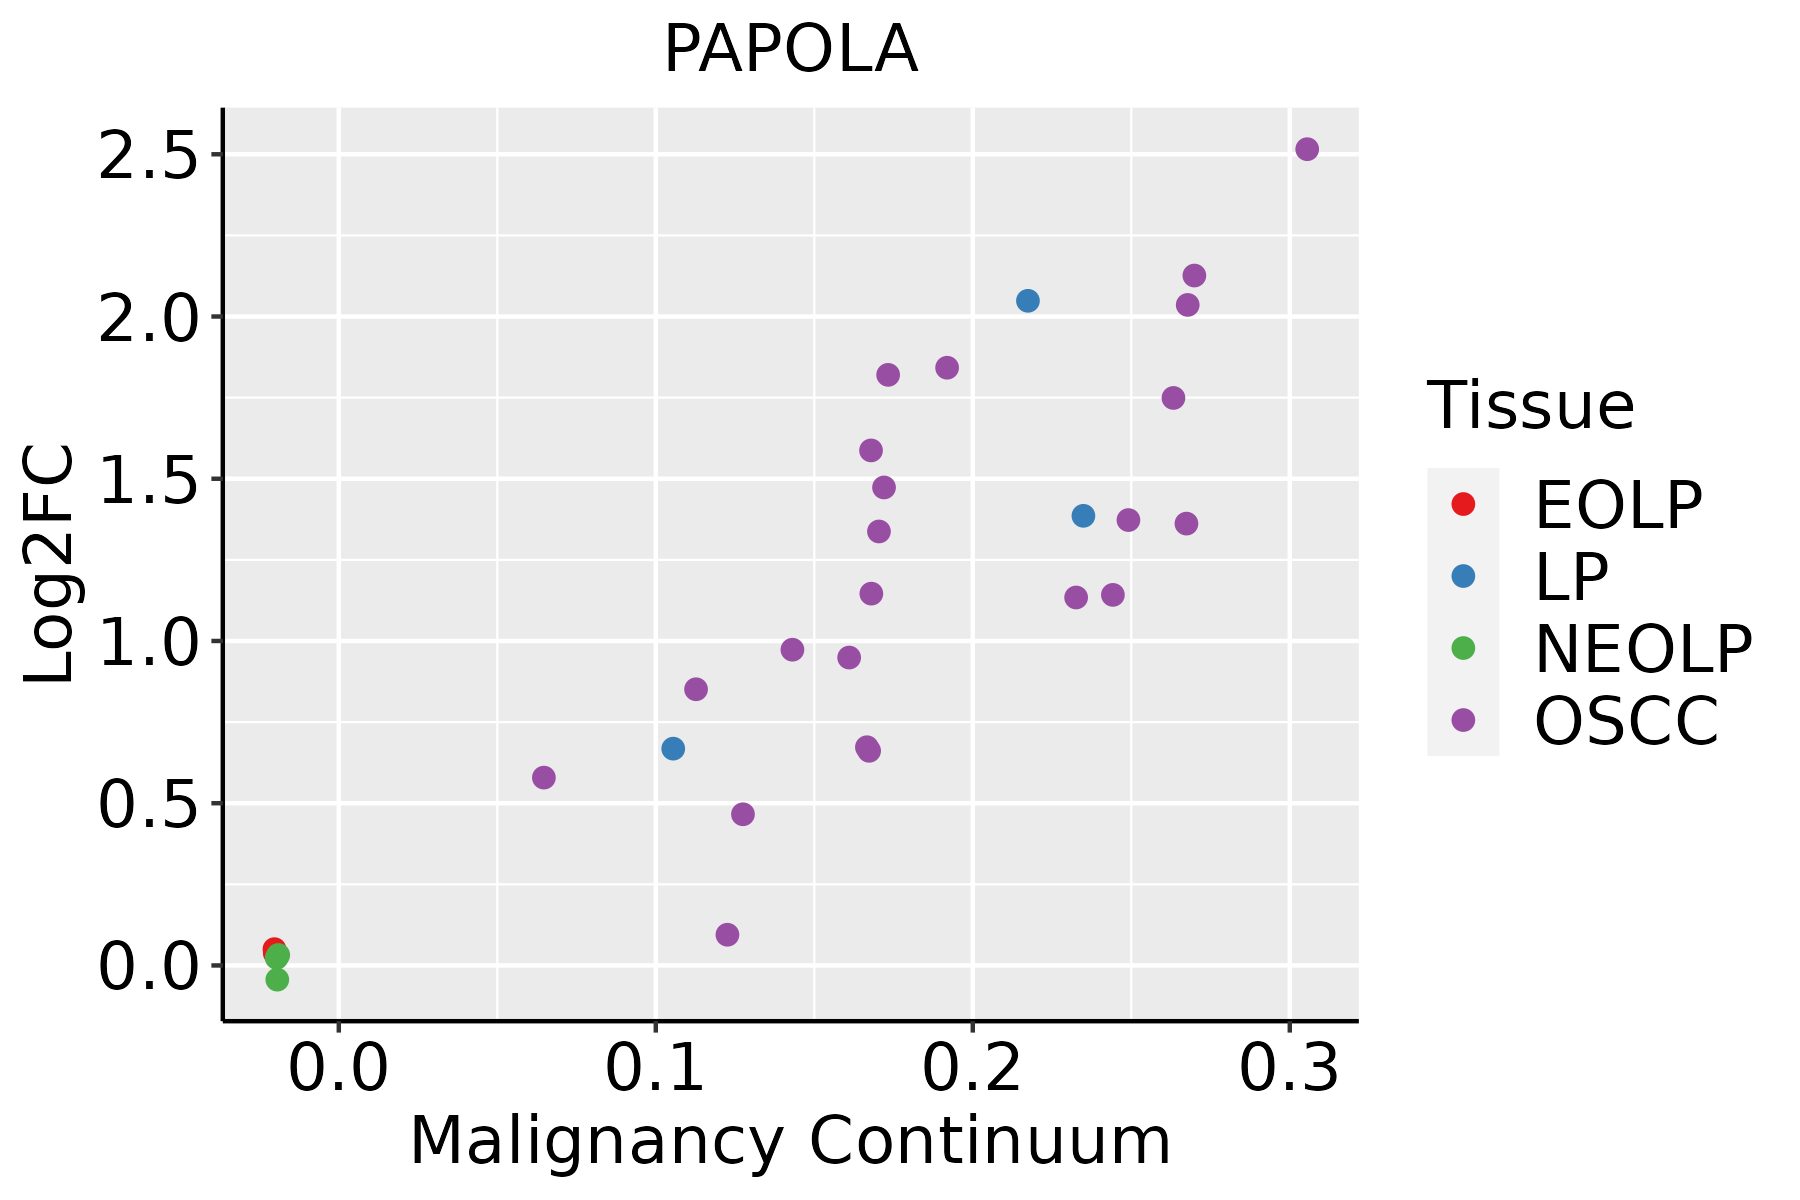 | EOLP: Erosive Oral lichen planus |
| LP: leukoplakia |
| NEOLP: Non-erosive oral lichen planus |
| OSCC: Oral squamous cell carcinoma |
| Prostate | 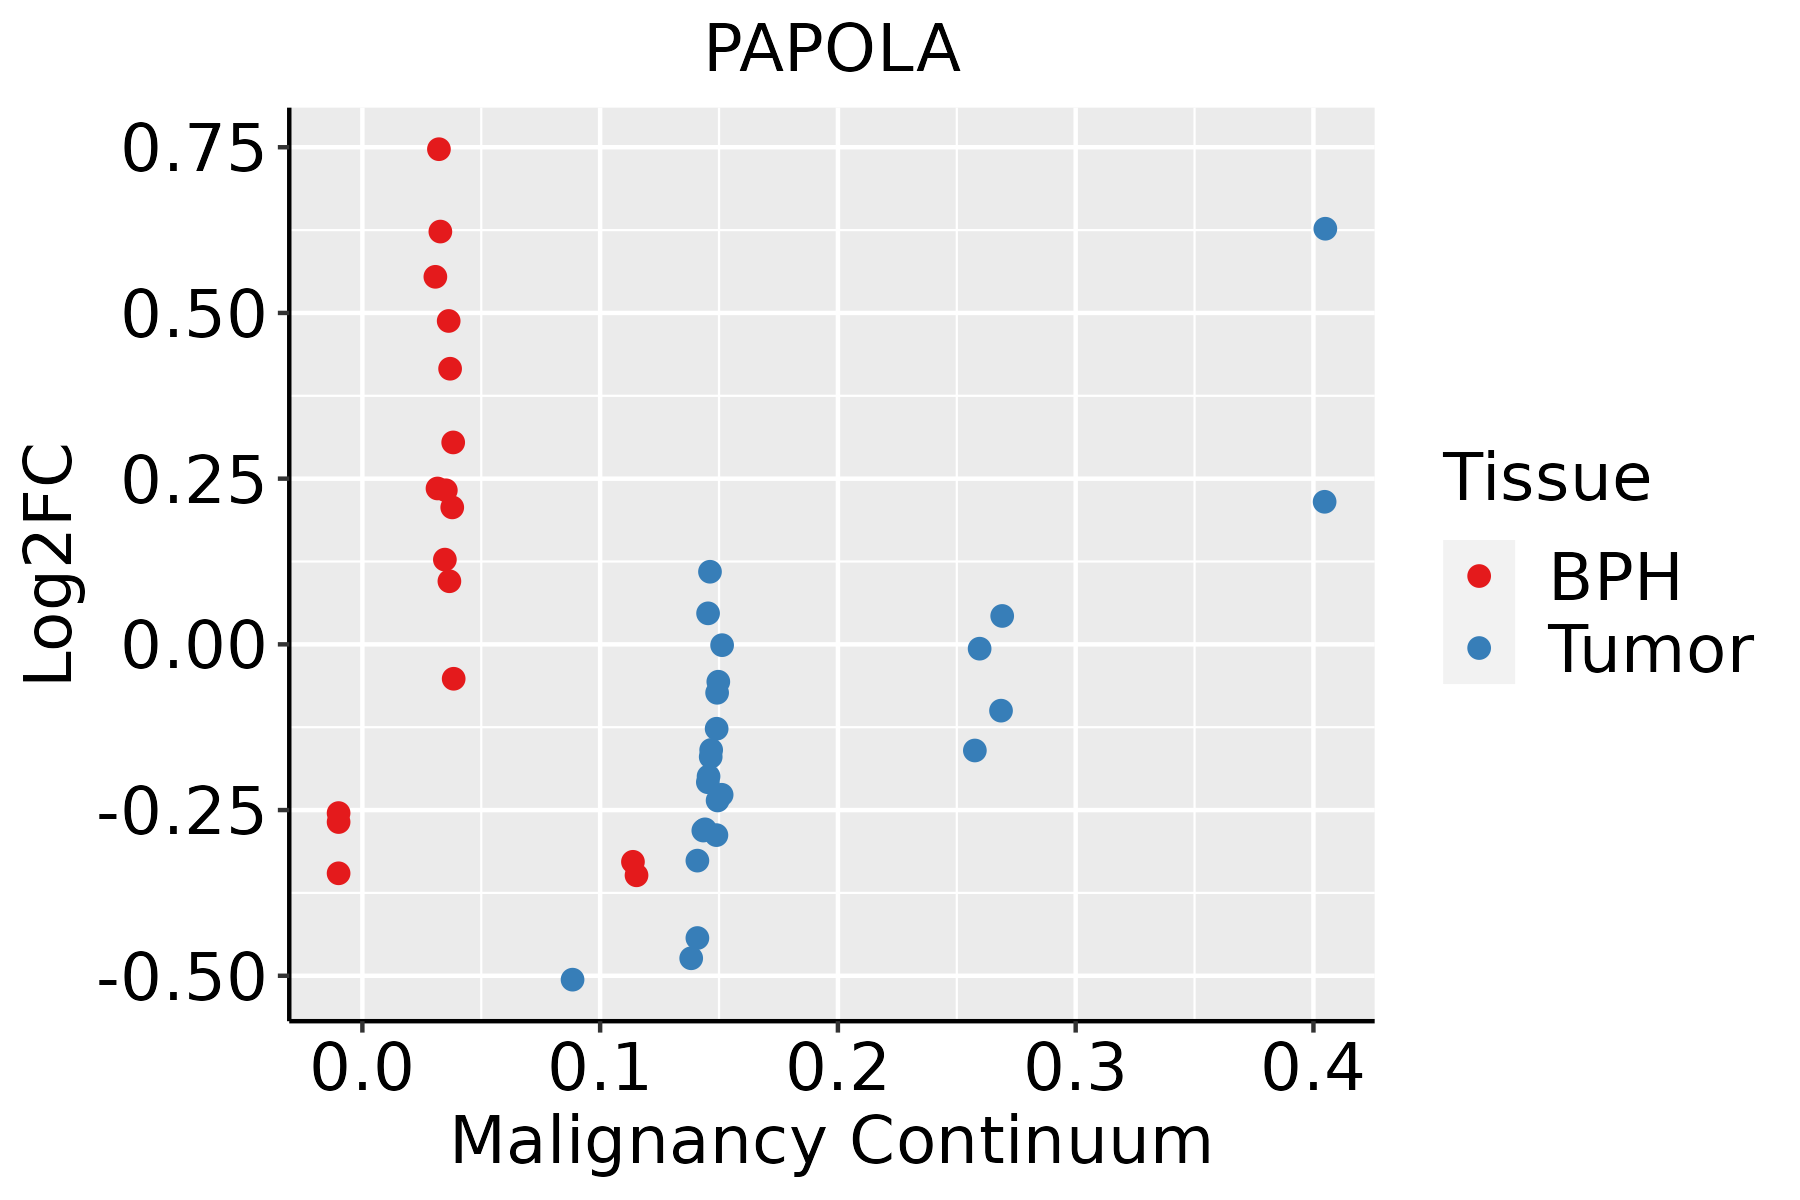 | BPH: Benign Prostatic Hyperplasia |
| Skin |  | AK: Actinic keratosis |
| cSCC: Cutaneous squamous cell carcinoma |
| SCCIS:squamous cell carcinoma in situ |
| Thyroid |  | ATC: Anaplastic thyroid cancer |
| HT: Hashimoto's thyroiditis |
| PTC: Papillary thyroid cancer |
| GO ID | Tissue | Disease Stage | Description | Gene Ratio | Bg Ratio | pvalue | p.adjust | Count |
| GO:1903311 | Colorectum | AD | regulation of mRNA metabolic process | 117/3918 | 288/18723 | 1.69e-14 | 4.23e-12 | 117 |
| GO:0050684 | Colorectum | AD | regulation of mRNA processing | 61/3918 | 137/18723 | 4.23e-10 | 3.58e-08 | 61 |
| GO:19033111 | Colorectum | SER | regulation of mRNA metabolic process | 78/2897 | 288/18723 | 2.61e-07 | 1.43e-05 | 78 |
| GO:00506841 | Colorectum | SER | regulation of mRNA processing | 42/2897 | 137/18723 | 5.57e-06 | 2.01e-04 | 42 |
| GO:19033112 | Colorectum | MSS | regulation of mRNA metabolic process | 115/3467 | 288/18723 | 1.23e-17 | 6.41e-15 | 115 |
| GO:00506842 | Colorectum | MSS | regulation of mRNA processing | 57/3467 | 137/18723 | 2.88e-10 | 2.68e-08 | 57 |
| GO:19033114 | Colorectum | FAP | regulation of mRNA metabolic process | 97/2622 | 288/18723 | 1.35e-17 | 4.13e-14 | 97 |
| GO:00506844 | Colorectum | FAP | regulation of mRNA processing | 51/2622 | 137/18723 | 9.70e-12 | 4.96e-09 | 51 |
| GO:19033115 | Colorectum | CRC | regulation of mRNA metabolic process | 80/2078 | 288/18723 | 3.21e-15 | 6.40e-12 | 80 |
| GO:00506845 | Colorectum | CRC | regulation of mRNA processing | 41/2078 | 137/18723 | 1.57e-09 | 5.23e-07 | 41 |
| GO:190331110 | Endometrium | AEH | regulation of mRNA metabolic process | 77/2100 | 288/18723 | 1.69e-13 | 4.40e-11 | 77 |
| GO:005068410 | Endometrium | AEH | regulation of mRNA processing | 42/2100 | 137/18723 | 6.05e-10 | 5.67e-08 | 42 |
| GO:190331115 | Endometrium | EEC | regulation of mRNA metabolic process | 79/2168 | 288/18723 | 1.01e-13 | 2.64e-11 | 79 |
| GO:005068414 | Endometrium | EEC | regulation of mRNA processing | 43/2168 | 137/18723 | 4.52e-10 | 4.59e-08 | 43 |
| GO:1903311110 | Esophagus | ESCC | regulation of mRNA metabolic process | 210/8552 | 288/18723 | 3.25e-21 | 5.56e-19 | 210 |
| GO:0050684110 | Esophagus | ESCC | regulation of mRNA processing | 109/8552 | 137/18723 | 3.51e-16 | 2.59e-14 | 109 |
| GO:003112412 | Esophagus | ESCC | mRNA 3'-end processing | 47/8552 | 62/18723 | 1.29e-06 | 1.58e-05 | 47 |
| GO:003144013 | Esophagus | ESCC | regulation of mRNA 3'-end processing | 25/8552 | 28/18723 | 1.77e-06 | 2.10e-05 | 25 |
| GO:00311233 | Esophagus | ESCC | RNA 3'-end processing | 76/8552 | 116/18723 | 1.25e-05 | 1.15e-04 | 76 |
| GO:00063783 | Esophagus | ESCC | mRNA polyadenylation | 33/8552 | 44/18723 | 7.30e-05 | 5.49e-04 | 33 |
| Pathway ID | Tissue | Disease Stage | Description | Gene Ratio | Bg Ratio | pvalue | p.adjust | qvalue | Count |
| hsa03015 | Colorectum | AD | mRNA surveillance pathway | 35/2092 | 97/8465 | 7.95e-03 | 3.13e-02 | 2.00e-02 | 35 |
| hsa030151 | Colorectum | AD | mRNA surveillance pathway | 35/2092 | 97/8465 | 7.95e-03 | 3.13e-02 | 2.00e-02 | 35 |
| hsa030152 | Colorectum | FAP | mRNA surveillance pathway | 26/1404 | 97/8465 | 7.11e-03 | 2.64e-02 | 1.60e-02 | 26 |
| hsa030153 | Colorectum | FAP | mRNA surveillance pathway | 26/1404 | 97/8465 | 7.11e-03 | 2.64e-02 | 1.60e-02 | 26 |
| hsa0301524 | Esophagus | ESCC | mRNA surveillance pathway | 72/4205 | 97/8465 | 6.12e-07 | 4.10e-06 | 2.10e-06 | 72 |
| hsa0301534 | Esophagus | ESCC | mRNA surveillance pathway | 72/4205 | 97/8465 | 6.12e-07 | 4.10e-06 | 2.10e-06 | 72 |
| hsa030154 | Liver | Cirrhotic | mRNA surveillance pathway | 46/2530 | 97/8465 | 1.92e-04 | 1.30e-03 | 8.03e-04 | 46 |
| hsa0301511 | Liver | Cirrhotic | mRNA surveillance pathway | 46/2530 | 97/8465 | 1.92e-04 | 1.30e-03 | 8.03e-04 | 46 |
| hsa0301521 | Liver | HCC | mRNA surveillance pathway | 66/4020 | 97/8465 | 3.16e-05 | 1.88e-04 | 1.04e-04 | 66 |
| hsa0301531 | Liver | HCC | mRNA surveillance pathway | 66/4020 | 97/8465 | 3.16e-05 | 1.88e-04 | 1.04e-04 | 66 |
| hsa030158 | Oral cavity | OSCC | mRNA surveillance pathway | 75/3704 | 97/8465 | 1.30e-11 | 2.01e-10 | 1.02e-10 | 75 |
| hsa0301513 | Oral cavity | OSCC | mRNA surveillance pathway | 75/3704 | 97/8465 | 1.30e-11 | 2.01e-10 | 1.02e-10 | 75 |
| hsa0301523 | Oral cavity | LP | mRNA surveillance pathway | 50/2418 | 97/8465 | 1.39e-06 | 1.50e-05 | 9.66e-06 | 50 |
| hsa0301533 | Oral cavity | LP | mRNA surveillance pathway | 50/2418 | 97/8465 | 1.39e-06 | 1.50e-05 | 9.66e-06 | 50 |
| hsa0301541 | Oral cavity | EOLP | mRNA surveillance pathway | 30/1218 | 97/8465 | 2.26e-05 | 1.20e-04 | 7.07e-05 | 30 |
| hsa0301551 | Oral cavity | EOLP | mRNA surveillance pathway | 30/1218 | 97/8465 | 2.26e-05 | 1.20e-04 | 7.07e-05 | 30 |
| hsa030156 | Oral cavity | NEOLP | mRNA surveillance pathway | 25/1112 | 97/8465 | 5.70e-04 | 3.18e-03 | 2.00e-03 | 25 |
| hsa030157 | Oral cavity | NEOLP | mRNA surveillance pathway | 25/1112 | 97/8465 | 5.70e-04 | 3.18e-03 | 2.00e-03 | 25 |
| hsa030155 | Prostate | BPH | mRNA surveillance pathway | 32/1718 | 97/8465 | 2.20e-03 | 8.63e-03 | 5.34e-03 | 32 |
| hsa0301512 | Prostate | BPH | mRNA surveillance pathway | 32/1718 | 97/8465 | 2.20e-03 | 8.63e-03 | 5.34e-03 | 32 |
| Hugo Symbol | Variant Class | Variant Classification | dbSNP RS | HGVSc | HGVSp | HGVSp Short | SWISSPROT | BIOTYPE | SIFT | PolyPhen | Tumor Sample Barcode | Tissue | Histology | Sex | Age | Stage | Therapy Types | Drugs | Outcome |
| PAPOLA | SNV | Missense_Mutation | | c.554N>T | p.Arg185Leu | p.R185L | P51003 | protein_coding | deleterious(0.05) | benign(0.037) | TCGA-A8-A097-01 | Breast | breast invasive carcinoma | Female | >=65 | I/II | Hormone Therapy | tamoxiphen | SD |
| PAPOLA | SNV | Missense_Mutation | | c.1099T>A | p.Phe367Ile | p.F367I | P51003 | protein_coding | deleterious(0) | probably_damaging(0.997) | TCGA-A8-A09Z-01 | Breast | breast invasive carcinoma | Female | >=65 | I/II | Unknown | Unknown | SD |
| PAPOLA | SNV | Missense_Mutation | | c.377N>A | p.Arg126Gln | p.R126Q | P51003 | protein_coding | deleterious(0) | probably_damaging(1) | TCGA-AN-A046-01 | Breast | breast invasive carcinoma | Female | >=65 | I/II | Unknown | Unknown | SD |
| PAPOLA | SNV | Missense_Mutation | novel | c.1101N>A | p.Phe367Leu | p.F367L | P51003 | protein_coding | deleterious(0.01) | probably_damaging(0.995) | TCGA-BH-A1FC-01 | Breast | breast invasive carcinoma | Female | >=65 | I/II | Unknown | Unknown | SD |
| PAPOLA | insertion | Frame_Shift_Ins | novel | c.321_322insGAGC | p.His108GlufsTer7 | p.H108Efs*7 | P51003 | protein_coding | | | TCGA-A8-A07P-01 | Breast | breast invasive carcinoma | Female | >=65 | I/II | Chemotherapy | 5-fluorouracil | SD |
| PAPOLA | insertion | Frame_Shift_Ins | novel | c.323_324insCCGTACCTGGCTGAAAACTTTTATTTTC | p.Thr109ArgfsTer14 | p.T109Rfs*14 | P51003 | protein_coding | | | TCGA-A8-A07P-01 | Breast | breast invasive carcinoma | Female | >=65 | I/II | Chemotherapy | 5-fluorouracil | SD |
| PAPOLA | insertion | Frame_Shift_Ins | novel | c.662_663insATTCACA | p.Leu222PhefsTer52 | p.L222Ffs*52 | P51003 | protein_coding | | | TCGA-AR-A0U0-01 | Breast | breast invasive carcinoma | Female | >=65 | I/II | Unknown | Unknown | SD |
| PAPOLA | deletion | Frame_Shift_Del | novel | c.1727delN | p.Ser577LeufsTer5 | p.S577Lfs*5 | P51003 | protein_coding | | | TCGA-EW-A2FV-01 | Breast | breast invasive carcinoma | Female | <65 | III/IV | Chemotherapy | docetaxel | SD |
| PAPOLA | SNV | Missense_Mutation | novel | c.1886N>T | p.Ser629Leu | p.S629L | P51003 | protein_coding | tolerated(0.22) | unknown(0) | TCGA-EK-A3GK-01 | Cervix | cervical & endocervical cancer | Female | <65 | I/II | Unknown | Unknown | SD |
| PAPOLA | insertion | In_Frame_Ins | novel | c.2142_2142+1insAAAACATCCAGTACAGACCTTTCTGATATCCCTGCTCTCCCT | p.Lys715_Pro728dup | p.K715_P728dup | P51003 | protein_coding | | | TCGA-JW-A5VK-01 | Cervix | cervical & endocervical cancer | Female | <65 | I/II | Unknown | Unknown | SD |


