
|
|||||
|
 | |
| |
| |
| |
| |
| |
|
Gene: PAPD7 |
Gene summary for PAPD7 |
| Gene information | Species | Human | Gene symbol | PAPD7 | Gene ID | 11044 |
| Gene name | terminal nucleotidyltransferase 4A | |
| Gene Alias | LAK-1 | |
| Cytomap | 5p15.31 | |
| Gene Type | protein-coding | GO ID | GO:0000070 | UniProtAcc | B7ZLL4 |
Top |
Malignant transformation analysis |
| Identification of the aberrant gene expression in precancerous and cancerous lesions by comparing the gene expression of stem-like cells in diseased tissues with normal stem cells |
| Entrez ID | Symbol | Replicates | Species | Organ | Tissue | Adj P-value | Log2FC | Malignancy |
| 11044 | PAPD7 | HCC1_Meng | Human | Liver | HCC | 1.79e-03 | 2.18e-02 | 0.0246 |
| 11044 | PAPD7 | HCC2_Meng | Human | Liver | HCC | 2.84e-06 | 8.17e-02 | 0.0107 |
| 11044 | PAPD7 | HCC1 | Human | Liver | HCC | 2.25e-08 | 3.19e+00 | 0.5336 |
| 11044 | PAPD7 | HCC2 | Human | Liver | HCC | 4.49e-11 | 2.76e+00 | 0.5341 |
| 11044 | PAPD7 | Pt14.a | Human | Liver | HCC | 1.18e-02 | 2.22e-01 | 0.0169 |
| Page: 1 |
| Tissue | Expression Dynamics | Abbreviation |
| Liver | 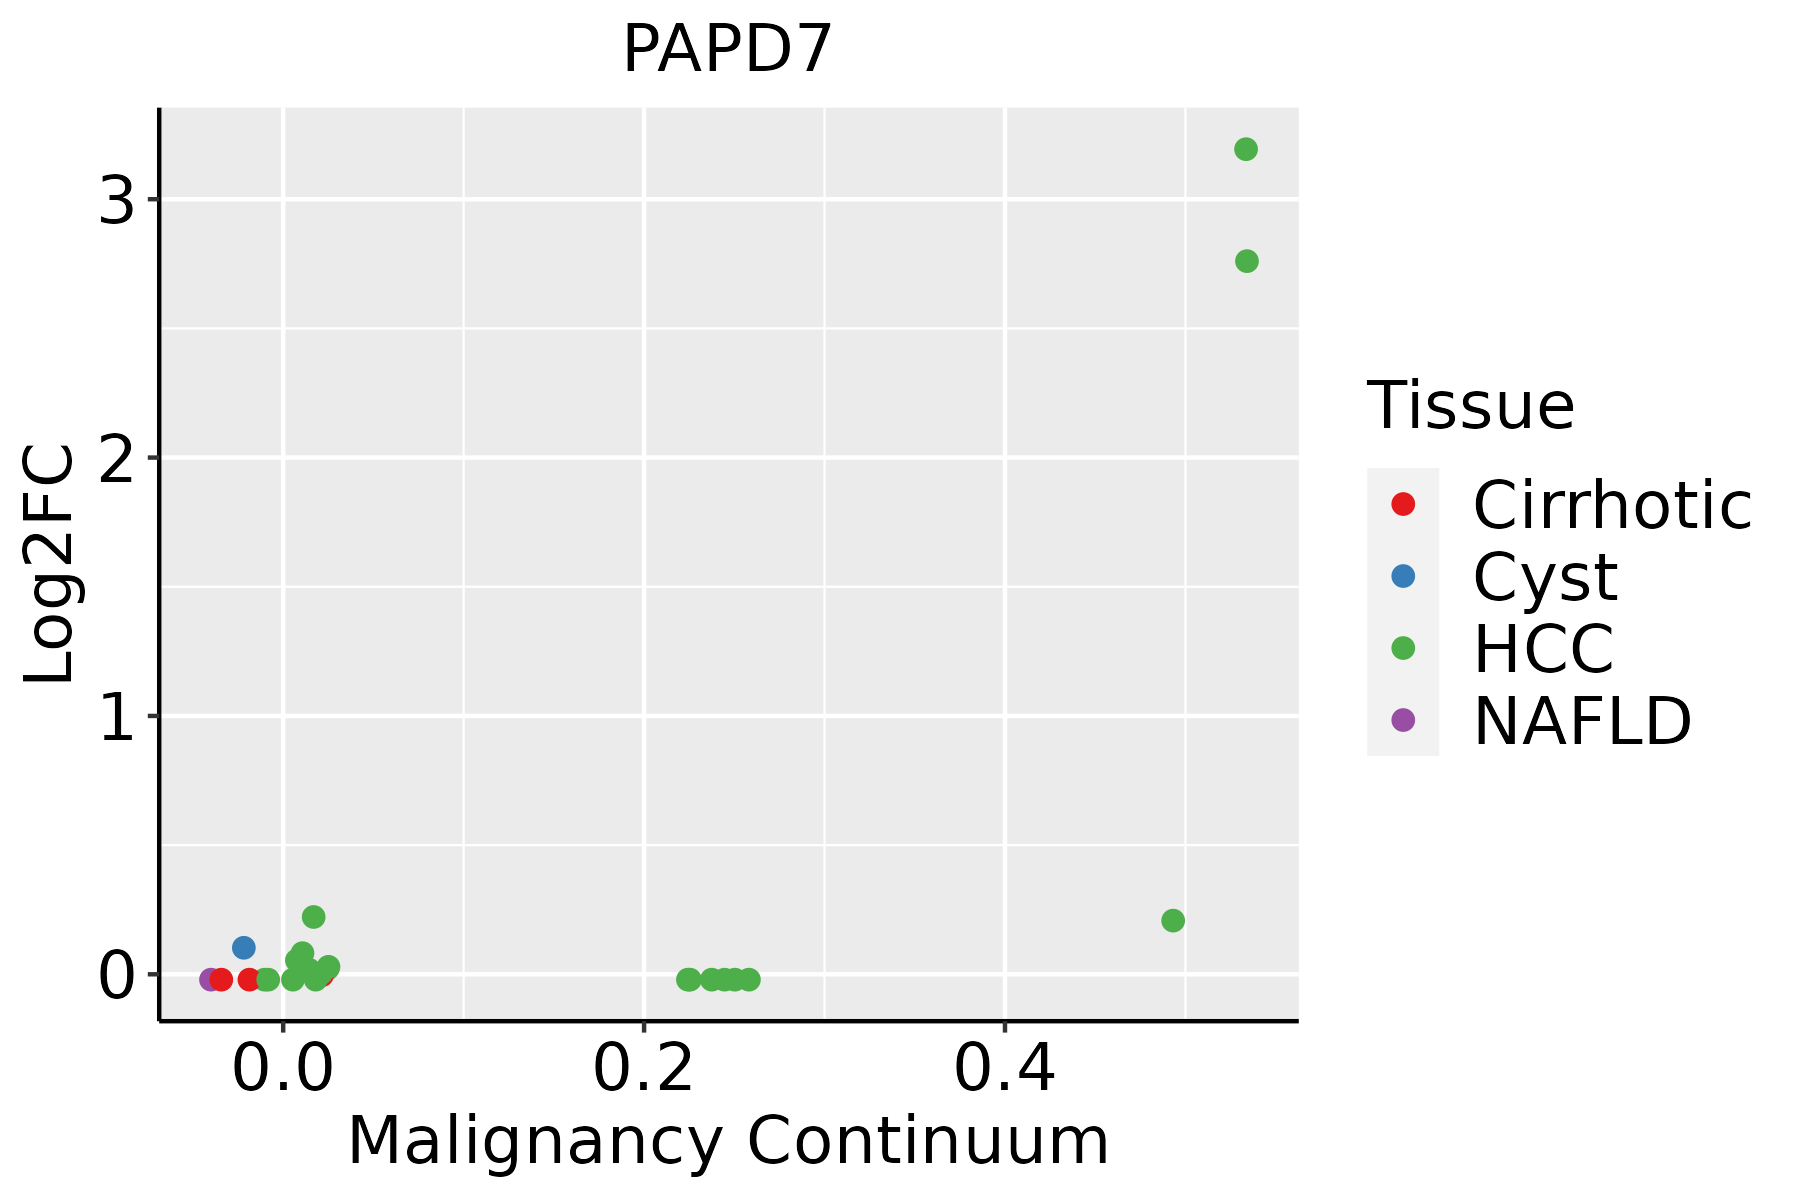 | HCC: Hepatocellular carcinoma |
| NAFLD: Non-alcoholic fatty liver disease |
| ∗log2FC in expression of this searched gene in stem-like cells from each diseased tissue sample relative to stem-like cells in normal samples in each tissue plotted against the malignancy continuum. Samples are colored based on if they are from different disease stage. |
Top |
Malignant transformation related pathway analysis |
| Find out the enriched GO biological processes and KEGG pathways involved in transition from healthy to precancer to cancer |
| Tissue | Disease Stage | Enriched GO biological Processes |
| Colorectum | AD |  |
| Colorectum | SER |  |
| Colorectum | MSS |  |
| Colorectum | MSI-H |  |
| Colorectum | FAP |  |
| ∗Top 15 enriched GO BP terms are showed in the bar plot of each disease state in each tissue. Each row represents a significant GO biological process which is colored according to the -log10(p.adjust). |
| Page: 1 2 3 4 5 6 7 8 9 |
| GO ID | Tissue | Disease Stage | Description | Gene Ratio | Bg Ratio | pvalue | p.adjust | Count |
| Page: 1 |
| Pathway ID | Tissue | Disease Stage | Description | Gene Ratio | Bg Ratio | pvalue | p.adjust | qvalue | Count |
| Page: 1 |
Top |
Cell-cell communication analysis |
| Identification of potential cell-cell interactions between two cell types and their ligand-receptor pairs for different disease states |
| Ligand | Receptor | LRpair | Pathway | Tissue | Disease Stage |
| Page: 1 |
Top |
Single-cell gene regulatory network inference analysis |
| Find out the significant the regulons (TFs) and the target genes of each regulon across cell types for different disease states |
| TF | Cell Type | Tissue | Disease Stage | Target Gene | RSS | Regulon Activity |
| ∗The dot plots of a searched regulon are shown for all cell subpopulations in each disease state of each tissue based on the regulon specific score inferred using pySCENIC and by calculating the average expression. |
| Page: 1 |
Top |
Somatic mutation of malignant transformation related genes |
| Annotation of somatic variants for genes involved in malignant transformation |
| Hugo Symbol | Variant Class | Variant Classification | dbSNP RS | HGVSc | HGVSp | HGVSp Short | SWISSPROT | BIOTYPE | SIFT | PolyPhen | Tumor Sample Barcode | Tissue | Histology | Sex | Age | Stage | Therapy Types | Drugs | Outcome |
| PAPD7 | SNV | Missense_Mutation | c.146N>G | p.Asp49Gly | p.D49G | Q5XG87 | protein_coding | deleterious(0) | probably_damaging(0.969) | TCGA-AN-A04C-01 | Breast | breast invasive carcinoma | Female | <65 | I/II | Unknown | Unknown | SD | |
| PAPD7 | SNV | Missense_Mutation | novel | c.1201T>A | p.Leu401Met | p.L401M | Q5XG87 | protein_coding | deleterious_low_confidence(0.04) | probably_damaging(0.946) | TCGA-BH-A8FY-01 | Breast | breast invasive carcinoma | Female | >=65 | I/II | Unknown | Unknown | SD |
| PAPD7 | SNV | Missense_Mutation | novel | c.16N>A | p.Glu6Lys | p.E6K | Q5XG87 | protein_coding | deleterious(0.03) | possibly_damaging(0.694) | TCGA-E9-A226-01 | Breast | breast invasive carcinoma | Female | <65 | III/IV | Hormone Therapy | tamoxiphen | PD |
| PAPD7 | insertion | Nonsense_Mutation | novel | c.1185_1186insCCAACAACTAATTGAATGTAATTTTTAAAATTAAATTA | p.Gly396ProfsTer5 | p.G396Pfs*5 | Q5XG87 | protein_coding | TCGA-A8-A08H-01 | Breast | breast invasive carcinoma | Female | >=65 | I/II | Unknown | Unknown | SD | ||
| PAPD7 | insertion | Nonsense_Mutation | novel | c.558_559insCACAGCTAAAATCAGTCC | p.Phe186_Phe187insHisSerTerAsnGlnSer | p.F186_F187insHS*NQS | Q5XG87 | protein_coding | TCGA-AO-A0J5-01 | Breast | breast invasive carcinoma | Female | <65 | III/IV | Other, specify in notesBisphosphonate | zoledronic | PD | ||
| PAPD7 | SNV | Missense_Mutation | rs757204868 | c.1394C>T | p.Ala465Val | p.A465V | Q5XG87 | protein_coding | tolerated_low_confidence(0.12) | benign(0.001) | TCGA-2W-A8YY-01 | Cervix | cervical & endocervical cancer | Female | <65 | I/II | Chemotherapy | cisplatin | CR |
| PAPD7 | SNV | Missense_Mutation | novel | c.591N>C | p.Leu197Phe | p.L197F | Q5XG87 | protein_coding | tolerated(0.11) | benign(0.115) | TCGA-HM-A4S6-01 | Cervix | cervical & endocervical cancer | Female | <65 | III/IV | Chemotherapy | cisplatin | CR |
| PAPD7 | SNV | Missense_Mutation | c.855N>G | p.Ile285Met | p.I285M | Q5XG87 | protein_coding | deleterious(0) | benign(0.1) | TCGA-IR-A3LK-01 | Cervix | cervical & endocervical cancer | Female | >=65 | I/II | Chemotherapy | cisplatin | PD | |
| PAPD7 | SNV | Missense_Mutation | rs748296365 | c.1585N>A | p.His529Asn | p.H529N | Q5XG87 | protein_coding | deleterious_low_confidence(0.01) | benign(0.14) | TCGA-AA-3877-01 | Colorectum | colon adenocarcinoma | Female | >=65 | I/II | Unknown | Unknown | SD |
| PAPD7 | SNV | Missense_Mutation | c.1597N>T | p.Arg533Trp | p.R533W | Q5XG87 | protein_coding | deleterious_low_confidence(0) | probably_damaging(0.99) | TCGA-AU-6004-01 | Colorectum | colon adenocarcinoma | Female | >=65 | I/II | Unknown | Unknown | SD |
| Page: 1 2 3 4 5 6 7 8 9 |
Top |
Related drugs of malignant transformation related genes |
| Identification of chemicals and drugs interact with genes involved in malignant transfromation |
| (DGIdb 4.0) |
| Entrez ID | Symbol | Category | Interaction Types | Drug Claim Name | Drug Name | PMIDs |
| Page: 1 |

Copyright 2023-Present -The University of Texas Health Science Center at Houston |